Biochem. J. (1997) 323, 649â659 (Printed in Great Britain). 649. Kinetics of low-density lipoprotein receptor activity in Hep-G2 cells: derivation and validation of a ...
649
Biochem. J. (1997) 323, 649–659 (Printed in Great Britain)
Kinetics of low-density lipoprotein receptor activity in Hep-G2 cells : derivation and validation of a Briggs–Haldane-based kinetic model for evaluating receptor-mediated endocytotic processes in which receptors recycle H. James HARWOOD JR.* and Lorraine D. PELLARIN Department of Metabolic Diseases, Pfizer Central Research, Pfizer Inc., Eastern Point Road, Groton, CT 06340, U.S.A.
The process of receptor-mediated endocytosis for receptors that recycle to the cell surface in an active form can be considered as being kinetically analogous to that of a uni-substrate, uniproduct enzyme-catalysed reaction. In this study we have derived steady-state initial-velocity rate equations for this process, based on classical Briggs–Haldane and King–Altman kinetic approaches to multi-step reactions, and have evaluated this kinetic paradigm, using as a model system the low-density lipoprotein (LDL)-receptor-mediated endocytosis of the trapped label ["%C]sucrose-LDL in uninduced, steady-state Hep-G2 cells. Using the derived rate equations, together with experimentally determined values for Bmax (123 fmol}mg of cell protein), Kd (14±3 nM), the endocytotic rate constant ke (analogous to kcat ; 0±163 min−"), Km (80 nM) and maximal internalization velocity (26±4 fmol}min per mg), we have calculated the ratio ke}Km (0±00204 nM−"[min−"), the bimolecular rate constant for LDL and LDL-receptor association (0±00248 nM−"[min−"), the firstorder rate constant for LDL–LDL-receptor complex dissociation (0±0354 min−"), the total cellular content of LDL receptors (154 fmol}mg of cell protein), the intracellular LDL receptor
concentration (30±7 fmol}mg of cell protein) and the pseudofirst-order rate constant for LDL receptor recycling (0±0653 min−"). Based on this mathematical model, the kinetic mechanism for the receptor-mediated endocytosis of ["%C]sucrose-LDL by steady-state Hep-G2 cells is one of constitutive endocytosis via independent internalization sites that follows steady-state Briggs–Haldane kinetics, such that LDL– LDL-receptor interactions are characterized by a rapid-highaffinity ligand–receptor association, followed by ligand–receptor complex internalization that is rapid relative to complex dissociation, and by receptor recycling that is more rapid than complex internalization and that serves to maintain 80 % of cellular LDL receptors on the cell surface in the steady-state. The consistency with which these quantitative observations parallel previous qualitative observations regarding LDL-receptormediated endocytosis, together with the high correlation between theoretical internalization velocities (calculated from determined rate constants) and experimental internalization velocities, underscore the validity of considering receptor-mediated endocytotic processes for recycling receptors in catalytic terms.
INTRODUCTION
complicated interplay between ligand internalization, ligand degradation and export of ligand degradation products out of the cell [9,10,22–25]. Thus descriptions of endocytotic events have been mainly restricted to qualitative evaluations [1,4,5,7,9,10]. To address this, Wiley and co-workers [9–13] have developed kinetic models for evaluating the mechanism of ligand–receptor interaction, ligand–receptor-complex internalization and ligand–receptor degradation for cell-surface receptors, such as the EGF receptor, that do not recycle. These models, although useful for the quantitative evaluation of EGF-receptor-mediated processes, remain complicated due to the release of radioiodinated degradation products of cellular EGF metabolism into the medium, requiring complicated time-dependence evaluations with extrapolation to zero ligand degradation for determination of kinetic constants [9–13]. In addition, the models are not directly or are only partially applicable to the evaluation of receptor-mediated processes for which receptors recycle to the cell surface in an active form to undergo additional rounds of endocytosis. For evaluation of receptor-mediated endocytosis by receptors that recycle to the cell surface in an active form, the use of
Receptor-mediated endocytosis is a process whereby ligands that are specifically bound to cell-surface receptors are rapidly partitioned into intracellular vesicles via a process that proceeds by way of clathrin-coated regions of the cell surface [1–8]. For many receptors whose primary function is bulk transport of nutrient molecules [e.g. low-density lipoprotein (LDL), transferrin, transcobalamin II and vitellogenin receptors], ligand– receptor complexes disassociate after internalization and the receptor returns to the cell surface in an active form to initiate additional rounds of endocytosis [2,4–6,8]. For other receptors, such as the epidermal growth factor (EGF) receptor, the internalized receptor is not returned to the cell surface but is degraded intracellularly [6,8,9–13]. While a wealth of quantitative information has been generated regarding the interactions of polypeptide ligands with their respective receptors [14–21] by calculating apparent dissociation constants (Kd) and numbers of binding sites per cell (Bmax), quantitative evaluation of the processes involved in receptormediated endocytosis and receptor recycling under physiological conditions at steady state has been difficult as a result of the
Abbreviations used : LDL, low-density lipoprotein ; EGF, epidermal growth factor ; DMEM, Dulbecco’s minimal essential medium ; Sucrose-LDL, [14C] sucrose-labelled LDL. * To whom correspondence should be addressed.
650
H. J. Harwood, Jr. and L. D. Pellarin
trapped label probes whose intracellular processing is such that internalized radiolabel is quantitatively retained intracellularly allows rates of internalization to be determined unambiguously, and permits the process of receptor-mediated endocytosis to be considered theoretically as being kinetically analogous to that of a uni-substrate, uni-product enzyme-catalysed reaction whereby receptor (analogous to enzyme) and ligand (analogous to substrate) associate at the cell surface (analogous to enzyme– substrate complex-formation), are internalized (analogous to conversion of enzyme–substrate complex into enzyme–product complex) and disassociate intracellularly with receptor recycling to the cell surface (analogous to product release from the enzyme yielding catalytically competent enzyme). It is thus possible to evaluate this process mathematically, provided that the receptor returns to the cell surface in a catalytically competent form within a relatively short time-frame relative to the duration of measurement, consistent with the ‘ catalytic ’ nature of the evaluation. In this paper we have developed a kinetic model for quantitatively evaluating the process of receptor-mediated endocytosis by receptors that recycle to the cell surface in an active form, by considering the process of ligand–receptor interaction, ligandreceptor complex internalization and receptor recycling in catalytic terms, deriving steady-state initial-velocity rate equations for the process, through application of classical Briggs–Haldane steady-state approaches to enzyme–substrate interactions [26] and King–Altman methods for deriving steady-state equations for multi-step reactions [27]. In addition, we have validated the derived kinetic model for receptor-mediated endocytosis by recycling receptors, using as a model system endocytosis of the trapped label ["%C]sucrose-LDL (Sucrose-LDL) by the LDL receptor of cultured hepatic (Hep-G2) cells. We selected the LDL receptor as a representative recycling receptor with which to evaluate this model, since these receptors, which are found on the surface of most animal cells [1], are well characterized [1–7] class II [8] receptors that undergo a continuous process of constitutive recycling via clathrin-coated regions on the cell surface at the rate of one cycle every 3–12 min. Secondly, we selected Hep-G2 cells as an appropriate model system in which to evaluate the derived kinetic model since LDL receptor activity in this cell line has been well characterized [16,21,28] and since, in experimental animals and humans, it is generally believed that the majority of plasma LDL catabolism occurs by LDL-receptor-mediated uptake in the liver [29], thus making a hepatocyte cell line the most appropriate cell line in which to conduct such an evaluation. Thirdly, we selected the trapped label Sucrose-LDL as an appropriate reporter ligand, since quantitative intracellular retention of its degradation products following lysosomal LDL catabolism has been well documented in a variety of cell lines [30–32]. A preliminary account of this work was presented at the 1996 Annual Meeting of the American Society for Biochemistry and Molecular Biology [32a].
MATERIALS AND METHODS Chemicals ["%C]Sucrose (540 mCi}mmol) was from Amersham (Arlington Heights, IL, U.S.A.). EcoLite liquid scintillation fluid was from ICN Biomedicals (Irvine, CA, U.S.A.). Aprotinin, cyanuric chloride and BSA were from Sigma Chemical Co. (St. Louis, Mo, U.S.A.). Sterile saline was from Kendall-McGaw Laboratories (Irvine, CA, U.S.A.). Bio-Gel A-0±5 (100–200 mesh) was from Bio-Rad Laboratories (Richmond, CA, U.S.A.). BCA protein assay reagent was from Pierce (Rockford, IL, U.S.A.).
Dulbecco’s minimal essential medium (DMEM), -glutamine, gentamicin, trypsin}EDTA solution and PBS were from GIBCO Laboratories (Grand Island, NY, U.S.A.). Fetal bovine serum was from HyClone Laboratories (Logan, UT, U.S.A.). Hep-G2 cells were initially obtained from the American Type Culture Collection (Rockville, MD, U.S.A.).
Solutions Blood anticoagulant solution contained 50 g}l EDTA (pH 7±4), 50 g}l NaN and 500 kallikrein-inhibitory units}l aprotinin in $ saline. Dialysis buffer A contained 0±2 mM EDTA (pH 7±4) and 150 mM NaCl. Dialysis buffer B contained 20 mM KXPO % (pH 7±2), 1±0 mM EDTA and 150 mM NaCl. Column elution buffer contained 20 mM KXPO (pH 6±8), 1±0 mM EDTA and % 150 mM NaCl. 1±019 saline solution contained 18±4 g}l KBr in saline, 1±063 saline solution contained 82±8 g}l KBr in saline, and 1±215 saline solution contained 335 g}l KBr in saline. Supplemented DMEM contained 10 % (v}v) fetal bovine serum, 10 ml}l 200 mM -glutamine and 800 µl}L 50 mg}ml gentamicin in DMEM. DMEM}BSA solution contained 2 mg}ml BSA in DMEM.
Isolation of human LDL Human LDL was isolated by sequential flotation. Blood samples were obtained from healthy normocholesterolaemic donors via an antecubital vein following an overnight fast, using 19 gauge needles and 60 ml syringes containing blood anticoagulation solution (1±0 ml per 50 ml of blood). Blood samples were cooled on ice, transferred to 50 ml plastic conical tubes and centrifuged at 2000 g for 20 min at 4 °C. Plasma was removed and adjusted to d ¯ 1±025 with solid KBr. Aliquots (25 ml) of the densityadjusted plasma were layered under 15 ml of 1±019 saline solution and centrifuged at 10 °C for " 20 h at 195 000 g. Very-low- and intermediate-density lipoprotein particles floated through the 1±019 saline solution and were discarded. The plasma density was then adjusted to d ¯ 1±070 with solid KBr. Aliquots (25 ml) of the density-adjusted plasma were layered under 15 ml of 1±063 saline solution and recentrifuged. LDL particles floated through the 1±063 saline solution and were removed, washed by recentrifugation through 1±063 saline solution and dialysed against dialysis buffer A with three buffer changes, each of 100 ml of buffer per ml of LDL fraction. Following dialysis, the LDL fraction (average 15–20 mg}ml) was stored under argon at 4 °C for up to 4 weeks. Immediately prior to use, LDL fractions were diluted to a final protein concentration of 5 mg}ml with dialysis buffer B.
Preparation of lipoprotein-deficient serum Lipoprotein-deficient serum was prepared as previously described [22]. Fetal bovine serum was adjusted to d ¯ 1±25 with solid KBr. Aliquots (25 ml) of the density-adjusted serum were layered under 15 ml of 1±215 saline solution and centrifuged at 10 °C for 48 h at 504 000 g (70 000 rev.}min ; Beckman 70 Ti rotor). The upper fraction containing all of the lipoproteins was removed and discarded. The lower fraction containing delipidated serum was dialysed extensively against dialysis buffer A with a minimum of five buffer changes, each of 100 ml buffer per ml of delipidated serum. After dialysis, the delipidated serum was adjusted with buffer A to the original serum volume and filter-sterilized, and 5 ml aliquots were apportioned to 50 ml sterile plastic tubes and stored frozen at ®20 °C.
Kinetics of low-density lipoprotein receptor activity in Hep-G2 cells Preparation of Sucrose-LDL Sucrose-LDL was prepared based on the method of Pittman and Taylor [24] for generating ["%C]sucrose-labelled lipoproteins using cyanuric chloride. Two vials, each containing 250 µCi of ["%C]sucrose (540 Ci}mmol ; 0±463 µmol), were processed in parallel. For each vial, after lyophilization to remove ethanol added by the supplier, ["%C]sucrose was redissolved in 10 µl of deionized water. Aliquots (15 µl) of 93 mM NaOH (3 molar equivalents of NaOH) were added to each tube and, following brief mixing, 20 µl of a freshly prepared 46 mM solution of recrystallized cyanuric chloride in acetone (2 molar equivalents of cyanuric chloride) was added to each tube. Reactions proceeded for 15 s with vigorous shaking, and then were quenched by 15 µl of 95 mM acetic acid (4 molar equivalents of acetic acid). Each resulting mixture, containing activated ["%C]sucrose, was then immediately added to 1±53 ml of dialysis buffer B containing 7±65 mg of LDL protein (0±033 molar equivalent of LDL protein, based on a molecular mass for apolipoprotein B of 500 000 kDa). After incubation at room temperature for a minimum of 4 h (typically overnight), the two reaction mixtures were combined and applied to a 1±0 cm¬20 cm Bio-Gel A-0±5 column (15 ml bed volume), pre-equilibrated with column elution buffer. The column was eluted with 2 bed volumes of column elution buffer, and 0±5 ml fractions were collected. Fractions containing SucroseLDL, which eluted in the column void volume, were pooled (approximate pool volume 3–4 ml), dialysed against dialysis buffer B with three buffer changes (each of 100 ml of buffer per ml of Sucrose-LDL fraction), filter-sterilized (0±45 µm filter) and stored in a sterile tube at 4 °C under argon for a maximum of 2 weeks. The specific radioactivity of Sucrose-LDL ranged between 15 and 20 d.p.m.}ng of protein. It is important to note that the volumes of 93 mM NaOH, 46 mM cyanuric chloride in acetone and 95 mM acetic acid stated are for reactions using 0±463 µmol of ["%C]sucrose. These volumes should be revised for each preparation based on the amount of ["%C]sucrose used in the reaction, such that the exact molar equivalents of NaOH, cyanuric chloride and acetic acid specified above are used. Similarly, the LDL addition should be calculated for each preparation such that exactly 0±033 molar equivalent of LDL protein (based on a molecular mass for apolipoprotein B of 500 kDa) is used.
Growth and isolation of Hep-G2 cells Hep-G2 cells seeded in T-75 flasks at a density of 2±0¬10' cells}flask were maintained in culture for 7 days at 37 °C in a 5 % CO atmosphere in 12 ml of supplemented DMEM (medium # changes on days 3 and 5). After this time, cultures had reached 80–90 % confluency (late-exponential phase) and maintained " 90 % cell viability (by Trypan Blue Dye exclusion). Lateexponential-phase cultures were passaged by removing the medium, rinsing cells with 5 ml of trypsin}EDTA (0±05 % trypsin, 0±53 mM EDTA) and then adding 5 ml of fresh trypsin}EDTA to each flask. After incubation for 2–5 min at 37 °C, 5 ml of supplemented DMEM were added to each flask and the trypsinreleased cells were transferred to 15 ml conical plastic tissue culture tubes and sedimented at 2000 g for 5 min at 4 °C. Cells were resuspended in 12 ml of fresh supplemented DMEM and their concentration and viability assessed using a haemocytometer.
Measurement of Sucrose-LDL endocytosis by Hep-G2 cells Cultured cells, grown and isolated as described above, were seeded in 24-well culture plates at an initial density of 1±0¬10&
651
cells per well in supplemented DMEM (1±0 ml of medium}well). Cultures were maintained for 7 days (medium changes on days 3 and 5), by which time cells had reached 80–90 % confluency (late-exponential phase) and maintained " 90 % cell viability (Trypan Blue dye exclusion). After 7 days of culture, cells were rinsed with 300 µl of PBS, and then 300 µl of DMEM containing both 10 % (v}v) lipoprotein-deficient serum and 100 µg of Sucrose-LDL (final assay concentration 250 µg}ml) was added to each well. A 10-fold excess of autologous unlabelled LDL (1 mg ; final assay concentration 2500 µg}ml) was also included in wells used for assessing non-specific binding and internalization. After incubation at 37 °C in a 5 % CO at# mosphere for 3 h, the medium was removed and the cells were washed twice with 300 µl of DMEM}BSA solution. A third 300 µl volume of DMEM}BSA solution was allowed to remain with the cells for 10 min at room temperature. For studies in which LDL endocytosis was measured as the sum of surfaceassociated LDL plus internalized LDL, cells were saponified and assessed for radioactivity as described below. For studies in which cell-surface-associated LDL and internalized LDL were assessed independently, cells were rinsed briefly with PBS and cooled to 4 °C (15 min). To the cooled cells was added 300 µl of a 4 °C solution of DMEM containing 10 mg}ml heparin. Following a 60 min incubation at 4 °C with gentle shaking to dissociate bound Sucrose-LDL, the medium was removed, mixed with 5±0 ml of Ecolite liquid scintillation fluid and assessed for heparin-releasable radioactivity (surface-associated SucroseLDL). The cells were then washed twice with 300 µl of PBS and saponified for 45 min at 70 °C with 300 µl of 0±2 M NaOH. A 10 µl aliquot was then removed from each well for protein determination and the remainder was mixed with 5±0 ml of EcoLite and assessed for heparin-resistant radioactivity (internalized Sucrose-LDL). Cell-surface LDL binding and rates of LDL internalization are expressed as ng of Sucrose-LDL bound per mg of cell protein and ng of Sucrose-LDL internalized during the 3 h incubation per mg of cell protein respectively, and were calculated based on the specific radioactivity of the SucroseLDL, the cellular protein concentration determined for each individual well and the non-specific binding and internalization observed in the presence of 10-fold excess unlabelled LDL (which generally were less than 20 % of total binding and 6 % of total internalization). Intra-plate, inter-plate and inter-assay variability (S.D.) averaged 8 %, 14 % and 26 % respectively. Under these conditions, endocytosis of Sucrose-LDL by nearconfluent monolayer cultures of Hep-G2 cells grown in medium containing 10 % full serum was dependent on the concentration of Sucrose-LDL supplied to the cells (Figure 1a) ; exhibited saturation kinetics, with maximal and half-maximal endocytosis occurring at 250 µg}ml and 48 µg}ml respectively (Figure 1a) ; was a linear function of the time of incubation at 37 °C for at least 6 h (" 100 cycles of endocytosis), indicative of intracellular label retention (Figure 1b) ; was prevented by incubation with an 8-fold or greater excess of unlabelled LDL (Figure 1c), incubation at 4 °C (35 compared with 1590 ng}mg of cell protein for incubation with 250 µg}ml Sucrose-LDL for 3 h at 4 °C compared with 37 °C) or depletion of intracellular potassium levels (prevents receptor-mediated internalization of LDL [33] ; 40 compared with 620 ng}mg of cell protein for incubation with 150 µg}ml Sucrose-LDL for 3 h at 37 °C in the absence and presence respectively of potassium in the medium) ; and exhibited a signal-to-noise ratio of 15 relative to non-specific endocytosis measured in the presence of a 10-fold excess of unlabelled LDL (Figure 1). In addition to linear time-dependent intracellular accumulation of radioligand for at least 100 cycles of endocytosis, the
652
H. J. Harwood, Jr. and L. D. Pellarin
Sucrose-LDL bound and internalized (ng/mg of cell protein)
4000
5000
(a)
3500
(b) Total Non-specific
(c)
3000
4000
3000
2500 3000
2000
Total Non-specific Specific
2000 1500
2000
1000
1000 1000
500 0
0 0
100
200 300 400 Sucrose-LDL (µg/ml)
500
0
60 120 180 240 300 360 Duration of incubation (min)
0
0
2
4 6 8 10 12 14 Unlabelled LDL/Sucrose-LDL
16
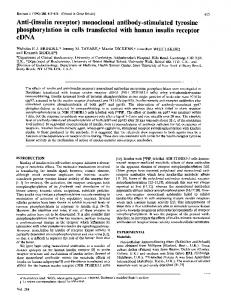
Figure 1 Endocytosis of Sucrose-LDL by Hep-G2 cells is concentration-dependent, saturable, time-dependent, prevented by the addition of excess unlabelled LDL and exhibits a high signal-to-noise ratio Hep-G2 cells, cultured for 7 days in supplemented DMEM in 24-well format, were incubated in a 5 % CO2 atmosphere with 300 µl of DMEM containing 10 % lipoprotein-deficient serum and (a) the indicated concentrations of Sucrose-LDL (sp. radioactivity 21 d.p.m./ng) in the presence or absence of quantities of unlabelled LDL 10-fold greater than the Sucrose-LDL concentration for 3 h at 37 °C ; (b) 100 µg of Sucrose-LDL (250 µg/ml ; 10 d.p.m./ng) in the presence or absence of a 10-fold excess (1 mg ; 2500 µg/ml) of unlabelled LDL for the indicated times at 37 °C ; (c) 60 µg of Sucrose-LDL (150 µg/ml ; 12 d.p.m./ng) and the indicated amounts of unlabelled LDL for 3 h at 37 °C. Following incubation, cells were washed and saponified, and cell-associated radioactivity was determined as described in the Materials and methods section. Data for total endocytosis are the means of triplicate determinations. Data for non-specific endocytosis (left and middle panels) are for parallel wells containing added unlabelled LDL. Data for specific endocytosis (left panel) were calculated by difference. (a) Total (D), non-specific (*) and specific (E) Sucrose-LDL bound and internalized during the 3 h incubation as a function of the concentration of Sucrose-LDL present in the incubation medium. (b) Total (E) and non-specific (D) SucroseLDL bound and internalized as a function of the duration of incubation. (c) Total Sucrose-LDL bound and internalized during the 3 h incubation as a function of the ratio of unlabelled LDL to Sucrose-LDL present in the incubation medium.
amount of Sucrose-LDL that accumulated intracellularly for all LDL concentrations evaluated was equal to, and highly correlated (r ¯ 0±95) with, the sum of the degradation products of intracellular "#&I-LDL metabolism excreted into the medium plus the equilibrium concentration of "#&I-LDL retained intracellularly, indicating that all of the Sucrose-LDL that was internalized was retained within the cell.
Measurement of protein concentration Protein concentration was measured using BCA Protein Assay Reagent, with BSA as standard.
RESULTS Rationale for considering receptor-mediated endocytosis of Sucrose-LDL by Hep-G2 cells as a ‘ catalytic ’ process As outlined above (cf. [32]), endocytosis of Sucrose-LDL by Hep-G2 cells occurs through a receptor-mediated process by which multiple cycles of the following sequence occur during the course of evaluation : (1) interaction of LDL with cell-surface LDL receptor, (2) LDL-receptor complex internalization, (3) intracellular LDL-LDL-receptor complex dissociation and (4) LDL receptor recycling. Since, for Sucrose-LDL, radiolabelled products of its intracellular degradation are trapped within the cell following receptor-mediated internalization [30–32], then internalized LDL–LDL-receptor complex and free intracellular Sucrose-LDL are indistinguishable, and the intracellular concentration of radiolabel is a direct measure of the rate of internalization of Sucrose-LDL [32]. Thus the rate of internalization of Sucrose-LDL can be expressed quantitatively in terms of intracellular Sucrose-LDL accumulation as a function of incubation time. Also, since the LDL receptor returns to the cell surface in an active form within a time-frame that is short relative to the duration of evaluation (see below), the process of
LDL binding, internalization and receptor recycling can be viewed kinetically in terms of a ‘ catalytic ’ mechanism as outlined above.
Derivation of rate equations for receptor-mediated endocytosis of Sucrose-LDL by Hep-G2 cells based on classical steady-state Briggs–Haldane kinetics The sequence of steps leading to Sucrose-LDL internalization by Hep-G2 cells can be viewed kinetically in terms of an equilibrium binding of extracellular LDL to LDL receptors on the cell surface to form a cell-surface LDL–LDL-receptor complex followed, sequentially, by irreversible internalization of the LDL–LDL-receptor complex, intracellular dissociation of the LDL–LDL-receptor complex and recycling of liberated LDL receptor to the cell surface. Since internalized Sucrose-LDL is trapped intracellularly and does not return to the medium [32], ligand accumulates intracellularly as a function of incubation time [32]. The reaction sequence for Sucrose-LDL internalization can thus be expressed as shown in eqn. (1) : k"
k$
k&
LmRs e LRs ! LRi ! LiRs
(1)
k#
Lm is the concentration of Sucrose-LDL in the medium, Rs is the concentration of unoccupied LDL receptors on the cell surface, LRs is the concentration of occupied LDL receptors on the cell surface, LRi is the intracellular concentration of LDL receptors in the process of recycling to the cell surface, Li is the intracellular concentration of Sucrose-LDL and radiolabelled degradation products, k is the bimolecular rate constant for the association " of Sucrose-LDL and the cell-surface LDL receptor, k is the first# order rate constant for the dissociation of the cell-surface LDL–LDL-receptor complex, k is the first-order rate constant $ for the process of LDL–LDL-receptor complex internalization,
Kinetics of low-density lipoprotein receptor activity in Hep-G2 cells
0
1
k & [R [L t m $ k k $ & ¯ (2) k k k # $ & L m k k k " $ & By substituting Km for [(k k )}k ][[k }(k k )] and Vmax # $ " & $ & for k [k }(k k )][Rt, eqn. (2) may be written as ¯ $ & $ & Vmax Lm}(KmLm), which is in the form of the typical Michaelis– Menten equation for enzyme–substrate interactions. This can be rewritten, based on Hanes–Woolf rearrangements [34], to the linear relationship Lm} ¯ (1}Vmax) LmKm}Vmax. In the relationships outlined in eqn. (1), k , the first-order rate $ constant for cell-surface LDL–LDL-receptor complex internalization, is analogous to the endocytic rate constant (ke) previously described by Wiley and Cunningham [9], which is a measure of the rate of cell-surface ligand–receptor complex internalization as a function of time. ke is defined as the probability of an occupied receptor being internalized in 1 min at 37 °C [9], and is calculated as described in eqn. (3), where t is incubation time : k
0
ke ¯
10
Li 1 [ LRs t
1
(3)
As described by Wiley and Cunningham [9,10], ke is independent of receptor affinity, cell-surface receptor number and concentration of free ligand in the medium, and thus is a measure of the intrinsic rate of receptor–ligand complex internalization itself. Multiplying both sides of eqn. (3) by LRs yields eqn. (4), which is the equation for a straight line that passes through the origin and has a slope of ke : Li ¯ ke[LRs t
(4)
Based on Scatchard analysis of cell-surface LDL binding for determining Kd and Bmax, Hanes–Woolf analysis of rates of LDL internalization for determining Km and Vmax and Wiley– Cunningham analysis for determining ke, it is possible to conduct an in-depth analysis of the kinetic mechanism of the LDL receptor.
Concentration-dependent cell-surface association and intracellular accumulation of Sucrose-LDL by Hep-G2 cells When Hep-G2 cells grown in monolayer culture to nearconfluence in the presence of 10 % full serum were incubated
140 Sucrose-LDL bound (ng/mg of cell protein)
(a)
Total Non-specific Specific
120 100 80 60 40 20 0 0
100
200
300
400
4000
500 (b)
Total Non-specific Specific
3500 Sucrose-LDL internalized (ng/mg of cell protein)
and k is the pseudo-first-order rate constant for the process of & intracellular LDL–LDL-receptor complex dissociation and receptor recycling to the cell surface. The kinetics of receptor-mediated internalization of SucroseLDL by Hep-G2 cells can thus be viewed as being analogous to initial-velocity kinetics for a uni-substrate, uni-product enzymecatalysed reaction, where Lm, Rs, LRs, LRi and Li of eqn. (1) are analogous to substrate (S), enzyme (E), enzyme–substrate complex (ES), enzyme–product complex (EP) and product (P) concentrations for a Uni Uni enzyme-catalysed reaction, under conditions in which k and k are negligible relative to k and k . % ' $ & Based on the classical steady-state approach to enzyme– substrate interactions originally described by Briggs and Haldane [26], and using the King–Altman method for deriving steadystate rate equations for multi-step reactions [27], the steady-state rate equation for Sucrose-LDL binding and internalization, based on the relationships outlined in eqn. (1), is shown in eqn. (2), where is the velocity of internalization of Sucrose-LDL and Rt is the total cellular LDL receptor concentration :
653
3000 2500 2000 1500 1000 500 0 0
100
200
300
400
500
Sucrose-LDL (µg/ml)
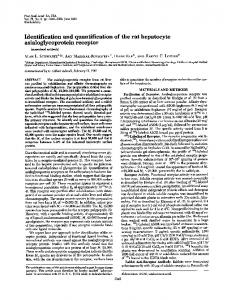
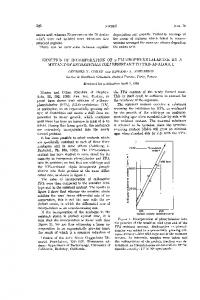
Figure 2 Concentration-dependent cell-surface association and intracellular accumulation of Sucrose-LDL by Hep-G2 cells Hep-G2 cells, cultured for 7 days in supplemented DMEM in 24-well format, were incubated with 300 µl of DMEM containing 10 % lipoprotein-deficient serum and the indicated concentrations of Sucrose-LDL (sp. radioactivity 12 d.p.m./ng) for 3 h at 37 °C in a 5 % CO2 atmosphere. At each concentration of Sucrose-LDL evaluated, parallel wells that also contained quantities of unlabelled LDL 10-fold greater than the Sucrose-LDL concentration were used to assess nonspecific cell surface association and intracellular accumulation. After incubation, cells were washed, cooled to 4 °C and assessed for heparin releasable and heparin-resistant radioactivity, as described in the Materials and methods section. Data for total cell-surface associated and total internalized Sucrose-LDL are the means³S.D. of triplicate determinations. Data for nonspecific cell-surface-associated and non-specific internalized Sucrose-LDL are for parallel wells containing added unlabelled LDL. Data for specific cell-surface-associated and specific internalized Sucrose-LDL were calculated by difference. Shown are the total (D), non-specific (*) and specific (E) cell-surface-associated Sucrose-LDL (heparin releasable ; a) and Sucrose-LDL internalized during the 3 h incubation (heparin resistant ; b) as a function of the concentration of Sucrose-LDL present in the medium.
with various concentrations of Sucrose-LDL between 5 and 500 µg}ml for 3 h at 37 °C and surface-associated and internalized Sucrose-LDL were subsequently separated by heparin release of surface-associated LDL, both the surface association and intracellular accumulation of Sucrose-LDL were dependent on the concentration of Sucrose-LDL present in the medium (Figure 2). Quantitative retention of Sucrose-LDL over the course of the 3 h incubation at 37 °C resulted in an over 30fold greater intracellular concentration of Sucrose-LDL than of surface-associated Sucrose-LDL, indicative of multiple cycles of receptor-mediated endocytosis during measurement, with completion of one cycle every 5 min (Figure 2). Under these conditions, both specific cell-surface association and specific intracellular accumulation of Sucrose-LDL exhibited similar hyperbolic saturation profiles (Figure 2), suggesting that the degree of cell surface LDL receptor occupancy dictates the rate of Sucrose-LDL internalization.
654
H. J. Harwood, Jr. and L. D. Pellarin
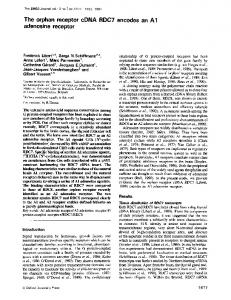
Figure 4 Evaluation of the kinetic parameters Km and Vmax for the internalization of Sucrose-LDL by Hep-G2 cells Figure 3 Evaluation of the kinetic parameters Kd and Bmax for the specific binding of Sucrose-LDL to Hep-G2 cells The data of Figure 2 for specific cell-surface association of Sucrose-LDL with Hep-G2 cells at various Sucrose-LDL concentrations are expressed as the ratio of cell-surface-associated Sucrose-LDL to free Sucrose-LDL ([S]b/[S]f) as a function of cell-surface-associated SucroseLDL ([S]b), by the method of Scatchard. Bmax and Kd (µg/ml) values were calculated from the x-axis intercept and slope respectively of the line corresponding to the high-affinity portion of the binding curve. R2 ¯ correlation coefficient.
The data of Figure 2 for the intracellular accumulation of Sucrose-LDL by Hep-G2 cells at various Sucrose-LDL concentrations are expressed as the ratio of the Sucrose-LDL concentration in the medium to the velocity of Sucrose-LDL internalization (L m /v ) as a function of the SucroseLDL concentration in the medium (L m ). Km ( µg/ml) and Vmax values were calculated from the slope and y - intercept respectively of the resultant line, based on the relationships outlined in eqn. (4). R2 ¯ correlation coefficient.
Measurement of k3, the endocytotic rate constant for the receptor-mediated internalization of Sucrose-LDL by Hep-G2 cells Determination of the kinetic parameters Kd and Bmax for the binding of Sucrose-LDL to Hep-G2 cells When the data of Figure 2 for the specific cell-surface association of Sucrose-LDL with Hep-G2 cell LDL receptors were subjected to Scatchard analysis, the maximal binding (Bmax) of SucroseLDL to Hep-G2 cells grown to near-confluence in medium containing 10 % full serum was 74 ng}mg of cell protein (Figure 3). Assuming a 1 : 1 complexation between Sucrose-LDL and cell-surface LDL receptor molecules and a molecular mass for LDL apolipoprotein B of 600 kDa, the cell-surface LDL receptor concentration in uninduced, steady-state Hep-G2 cells was 123 fmol}mg of cellular protein. The dissociation constant, Kd, for the binding of Sucrose-LDL to Hep-G2 cells under these conditions was determined to be 8±6 µg}ml and was calculated to be 14±3 nM based on the above-mentioned assumptions (Figure 3).
Determination of Km and Vmax for the internalization of SucroseLDL by Hep-G2 cells When the data of Figure 2 for the intracellular accumulation of Sucrose-LDL by Hep-G2 cells were analysed in terms of the Hanes–Woolf rearrangement of eqn. (2), a linear relationship between Lm} and Lm was observed (r# ¯ 0±99 ; Figure 4). Based on this relationship, the Km for Sucrose-LDL internalization by Hep-G2 cells was determined to be 48 µg}ml (80 nM based on the above-mentioned assumptions ; Figure 4) and the Vmax under the conditions of the experiment was determined to be 2850 ng}3 h incubation per mg of cell protein (15±8 ng}min per mg). Similar results were obtained when the data were analysed by direct non-linear curve-fitting [Km ¯ 45±9³5±8 µg}ml ; Vmax ¯ 2830³88 ng}3 h per mg of cell protein (15±5³0±5 mg}min per mg)].
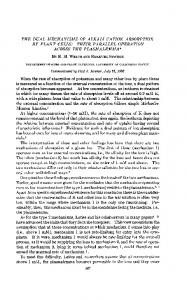
When the data of Figure 2 for the cell-surface association and intracellular accumulation of Sucrose-LDL by Hep-G2 cells were evaluated as outlined in eqn. (4) for Sucrose-LDL concentrations between 5 and 500 µg}ml (n ¯ 17), the endocytotic rate constant, ke, for Sucrose-LDL–LDL-receptor complex internalization by Hep-G2 cells was determined from the slope of the line generated by plotting the rate of internalization of SucroseLDL (Li ; min−") as a function of cell-surface-associated Sucrose-LDL for each concentration of Sucrose-LDL, and was evaluated to be 0±163 min−" (Figure 5, left panel). ke was also calculated, by averaging the individual values of ke determined for each Sucrose-LDL concentration evaluated as described in eqn. (3), to be 0±171³0±022 min−" (mean³S.D.). That the ke remained essentially constant at all Sucrose-LDL concentrations examined (both sub-saturating and saturating ; Figure 5, right panel) indicates that LDL receptors cluster to independent internalization sites rather than to each other [9], that space within the coated pits for LDL–LDL-receptor complexes is not rate-limiting even at saturating concentrations of LDL, and that unoccupied receptors are internalized at the same rate as occupied receptors. Based on data from nine independent experiments conducted at a Sucrose-LDL concentration of 250 µg}ml, the mean (³S.D.) value of ke for Sucrose-LDL–LDL-receptor complex internalization by Hep-G2 cells was 0±195³0±044 min−". This value is in close agreement with the calculated endocytotic rate constants for other receptor-ligand complexes that are known to be co-internalized with LDL receptors by way of coated pits [4], such as the ke of 0±157 min−" for EGF–EGF-receptor complex internalization by human fibroblasts [9–12] and the ke of 0±11 min−" for vitellogenin–vitellogenin-receptor complex internalization by Xenopus oocytes [17,18]. This indicates that the receptor-mediated internalization of Sucrose-LDL by HepG2 cells is primarily, if not solely, through coated-pit mediated
Kinetics of low-density lipoprotein receptor activity in Hep-G2 cells
Figure 5
655
Evaluation of the rate constant ke for the internalization of Sucrose-LDL by Hep-G2 cells
Left panel : the data of Figure 2 are expressed in terms of the rate of internalization of Sucrose-LDL (LRi /incubation time) as a function of cell-surface-associated Sucrose-LDL (LRs). ke was calculated from the slope of the resulting line, based on the relationships outlined in eqn. (6). Right panel : the value for ke, calculated for each concentration of Sucrose-LDL based on the relationships outlined in eqn. 5, is expressed as a function of the concentration of Sucrose-LDL in the incubation medium (L m ). R2 ¯ correlation coefficient.
mechanisms. In addition, a value for ke of 0±007 min−" was determined for Sucrose-LDL–LDL-receptor complex internalization by Hep-G2 cells at 4 °C, which is only 3±3 % of the value measured at 37 °C under identical conditions, further exemplifying the inhibition of receptor-mediated endocytosis at 4 °C. The value of ke}Km which, analogous to kcat}Km for enzymecatalysed reactions, establishes a lower limit for the bimolecular association constant k [26], was calculated based on exper" imentally determined values of ke and Km to be 2±04¬ 10' M−" min−".
Calculation of the association and dissociation constants, k1 and k2, for Sucrose-LDL binding to the LDL receptor Previous reports have demonstrated that, in fibroblasts, CHO cells and PC12 cells, LDL-receptor endocytosis and receptor recycling occur at rates of 3–8 min}cycle [1,35,36], similar to the 5 min}cycle noted in the present study for Hep-G2 LDL-receptor endocytosis and recycling (see above). Under these conditions, an intracellular pool of LDL receptors awaiting recycling to the cell surface was either not detected (fibroblasts ; [4]) or less than 10 % of the cell-surface LDL receptor pool (K562 cells ; [37]). The lack of a significant intracellular pool of LDL receptors in the process of recycling to the cell surface relative to the pool of LDL receptors residing on the cell surface awaiting endocytosis suggests that k , the pseudo-first-order rate constant for recycling & of internalized LDL receptors, is much greater than k . $ When k is much greater than k , the term k }(k k ) in eqn. & $ & $ & (2) approaches unity and eqn. (2) may be simplified to eqn. (5). Hence, based on eqn. (5), Vmax may be expressed as k [Rt and Km $ may be expressed as (k k )}k . # $ " ¯
k [Rt[Lm $ [(k k )}k ]Lm # $ "
(5)
By substituting Kd for k }k and ke for k in the equation # " $ defining Km above, and then solving for k , the relationship " shown in eqn. (6) is obtained : k ¯ ke}(Km®Kd) (6) " Based on this relationship and the measured values for ke, Km and Kd, the value of the bimolecular rate constant for the association between Sucrose-LDL and Hep-G2 cell-surface LDL receptors (k ) was determined to be 0±00248 nM−"[min−", a value "
similar to those previously noted for the LDL receptor of human fibroblasts (0±0033 nM−"[min−" ; [14]) and freshly isolated platelets (0±0010 nM−"[min−" ; [15]), based on equilibrium binding studies. The value of the first-order constant for Hep-G2 cellsurface Sucrose-LDL–LDL-receptor complex dissociation (k ) # was then calculated from k and Kd based on the relationship " − shown in eqn. (7), to be 0±0354 min " : (7) k ¯ Kd[k " # The observations that Km (80 nM) was 5±6-fold greater than Kd (14±3 nM), that k (0±163 min−") was 4±6-fold greater than k $ # (0±0354 min−") and that k (2±48¬10' M−"[min−") was only " slightly greater than ke}Km (2±04¬10' M−"[min−") together support the conclusion that the steady-state Briggs–Haldane approaches used for the derivation of eqn. (2) were valid [26]. Indeed, at a near-saturating, near-physiological Sucrose-LDL concentration of 250 µg}ml (417 nM ; [32]), the interaction of Sucrose-LDL with cell-surface LDL receptors reflects a fast association (k ¬Lm ; 1±034 min−") followed by a rapid " internalization (0±163 min−") relative to complex dissociation (0±0354 min−"), typical of a steady-state Briggs–Haldane kinetic mechanism.
Estimation of the intracellular LDL receptor concentration in uninduced Hep-G2 cells Based on the steady-state assumptions used for the derivation of eqn. (5), then Vmax ¯ k [Rt. Since k ¯ ke and since Vmax and ke $ $ were both determined experimentally, the total cellular concentration of LDL receptors, Rt, expressed in terms of cellsurface binding equivalents, was calculated to be 92±4 ng}mg of cellular protein, or 154 fmol of LDL receptor}mg of cellular protein, based on the above-mentioned assumptions. The fact that Rt (154 fmol}mg of cellular protein) is greater than Bmax (123 fmol}mg of cellular protein) suggests that a fraction of the total cellular pool of LDL receptors resides within the cell in the process of recycling. Since Vmax ¯ ke[Rt, Rt ¯ RsLRsLRi and Bmax ¯ LRsRs, the intracellular concentration of LDL receptors in the process of recycling to the cell surface, LR , may be expressed as shown in eqn. (8) : " (8) LRi ¯ (Vmax}ke)®Bmax Based on this relationship and the experimentally determined values for Vmax, ke and Bmax, the LDL receptor concentration
656
H. J. Harwood, Jr. and L. D. Pellarin
Table 1 Rate constants and kinetic parameters for LDL receptor activity in Hep-G2 cells Parameter Cell-surface interaction Bmax Kd k1 k2 Ligand internalization Vmax Km ke Km/Kd ke/k2 ke/Km Receptor recycling k5 k5/k3 Rt Ri Ri/Rt
Value
74 ng/mg (123 fmol/mg*†) 8±6 µg/ml (14±3 nM*) 0±00248 nM−1[min−1* 0±0354 min−1 15±8 ng/min per mg (26±4 fmol/min per mg*) 48 µg/ml (80 nM*) 0±163 min−1 5±6 4±6 0±00204 nM−1[min−1* 0±653 min−1 4±01 92±4 ng/mg (154 fmol/mg*†) 18±4 ng/mg (30±7 fmol/mg*†) 0±20
* Based on a molecular mass for apolipoprotein B of LDL of 600 kDa. † Assuming a 1 : 1 association between ligand and receptor.
within the cell, LRi, in the process of recycling at steady state, expressed in terms of cell-surface binding equivalents, was determined to be 18±4 ng}mg of cellular protein, or 30±7 fmol}mg of cellular protein, based on the above-mentioned assumptions. Thus, in the steady-state, approx. 20 % of the LDL receptors reside within the cell in the process of recycling to the cell surface.
Estimation of k5, the rate constant for intracellular LDL receptor recycling At saturating LDL concentrations, Rs ¯ 0 and LRs ¯ Bmax. Thus, in the steady state and at saturating concentrations of SucroseLDL, the velocity with which intracellular LDL receptors return to the cell surface, k [LRi, must equal the velocity at which & LDL–LDL-receptor complexes are internalized, k [Bmax. The $ pseudo-first-order rate constant for the process of LDL receptor recycling, k , may thus be expressed as shown in eqn. (9) : & (9) k ¯ k [Bmax}LRi & $ Based on the determined values for ke, Bmax and LRi, the calculated value for k is 0±653 min−". As predicted above, k is & & approx. 4-fold greater than k , indicating that LDL receptor $ recycling to the cell surface is rapid relative to internalization of the LDL–LDL-receptor complex.
Comparison of experimental internalization velocities with theoretical internalization velocities calculated based on derived rate constants A summary of the experimentally determined and calculated rate constants for the receptor-mediated uptake of Sucrose-LDL by Hep-G2 cells, based on the relationship outlined in eqns. (1)–(9), is shown in Table 1. To assess the reliability of the rate constants determined using the derived kinetic model for the receptor-mediated endocytosis of Sucrose-LDL by Hep-G2 cells, theoretical internalization velocities, calculated by substituting the values for k , k , k , k " # $ &
Figure 6 Correlation between experimental internalization velocity and theoretical internalization velocity calculated based on derived rate constants The experimental internalization velocity is that of Figure 2, expressed as ng of Sucrose-LDL internalized/min per mg of cell protein. The theoretical internalization velocity for each concentration of Sucrose-LDL evaluated in Figure 2 was calculated using the experimentally determined values for k1, k2, k3 (¯ ke), k5 and R t listed in Table 1, based on the relationships outlined in eqn. (3). Shown is the relationship between experimental internalization velocity and theoretical internalization velocity for various concentrations of Sucrose-LDL between 5 and 500 µg/ml. R2 ¯ correlation coefficient.
and Rt from Table 1 into eqn. (3) for each Sucrose-LDL concentration evaluated in Figure 2, were compared with the experimentally determined internalization velocities (Figure 2). As shown in Figure 6, the calculated theoretical internalization velocities were in close agreement with and highly correlated (r# ¯ 0±965) with experimental internalization velocities for Sucrose-LDL concentrations between 5 µg}ml and 500 µg}ml.
DISCUSSION In this study we have developed a kinetic model for evaluating the process of receptor-mediated endocytosis for receptors that recycle, by considering the process in terms of a ‘ catalytic ’ mechanism analogous to a uni-substrate, uni-product enzymecatalysed reaction, and by deriving steady-state initial-velocity rate equations for the process, based on classical Briggs–Haldane kinetics and King–Altman approaches to multi-step enzymecatalysed reactions. In addition, we have validated the kinetic model derived utilizing as a model system LDL-receptormediated endocytosis of the trapped label (Sucrose-LDL) by uninduced steady-state Hep-G2 cells grown to near-confluence in medium containing 10 % full serum. Such a kinetic evaluation of receptor-mediated endocytotic processes using this model system is a valid consideration, since Sucrose-LDL is quantitively retained intracellularly following receptor-mediated internalization, and since the internalized LDL receptor returns to the cell surface in an active form to undergo additional rounds of endocytosis within a time-frame that is considerably shorter than the duration of evaluation. Indeed, when theoretical internalization velocities for the receptor-mediated endocytosis of Sucrose-LDL by steady-state Hep-G2 cells were calculated based on substitution of determined rate constants into the derived rate equation (eqn. 2), the calculated theoretical internalization velocities were in close agreement with and highly correlated with experimentally determined internalization velocities, exhibiting a 1 : 1 relationship and a correlation coefficient (r#) of 0±965.
Kinetics of low-density lipoprotein receptor activity in Hep-G2 cells In addition, the consistency with which the characteristics of the LDL-receptor-mediated endocytotic process, described in quantitative terms in the present study using the derived mathematical model, parallel previous qualitative characterization of the LDL-receptor-mediated endocytotic process [1–7] also serves to underscore the validity of evaluating receptor-mediated endocytosis by receptors that recycle in catalytic terms. For example, where previous studies have suggested a rapid association between LDL and the LDL receptor and subsequent slow complex dissociation, based on dissociation constants of 10–30 nM [14–16], low rates of spontaneous dissociation of radioiodinated LDL from fibroblast LDL receptors (30 % in 3 h at 37 °C [7]) even in the presence of unlabelled LDL [7], and a relative inability to remove associated LDL from the LDL receptor in the absence of polyanionic compounds (e.g. sulphated polysaccharides or polyphosphates [7]), the present study assessed k " and k for LDL–LDL-receptor association and complex dis# sociation at the Hep-G2 cell surface, indicating a 29±2-fold greater rate of LDL association with the LDL receptor than of LDL–LDL-receptor complex dissociation at the cell surface (Table 1). In addition, where previous studies suggested that the rate of coated-pit mediated cell-surface LDL–LDL-receptor complex internalization is more rapid than complex dissociation, based on time courses for the cell-surface association of LDLferritin, gold-labelled LDL or radioiodinated LDL relative to their internalization [4], the present studies indicate a ratio for k }k of 4±6, indicating that cell-surface LDL–LDL-receptor $ # complexes are 4±6 times as likely to be internalized by Hep-G2 cells as they are to dissociate at the membrane surface. Furthermore, where previous studies suggested that the rate of recycling of the LDL receptor to the cell surface is greater than the rate of ligand–receptor association and complex internalization via coated pits [4], the present studies indicate that receptor recycling following ligand–receptor complex Table 2
internalization by Hep-G2 cells is four times faster than ligand– receptor complex internalization. Moreover, where previous studies in fibroblasts and K-562 cells suggest that the majority of LDL receptors reside on the cell surface in the process of coatedpit-mediated internalization [4,37], the present studies indicate that approx. 80 % of the LDL receptors reside on the Hep-G2 cell surface in the steady-state, and that only a portion reside within the cells in the process of recycling to the cell surface. Finally, where previous studies suggested that LDL receptors cluster within coated pits and are continuously internalized whether or not they are charged with ligand [1–6], the present studies indicate that receptor-mediated LDL uptake by Hep-G2 cells continues at a constant rate over extended periods of time, regardless of LDL concentration, such that the rates of internalization of occupied and unoccupied LDL receptors are equal. In considering receptor-mediated endocytosis for receptors that recycle as being analogous to enzyme-catalysed reactions for enzymes utilizing macromolecular lipophilic substrates, several observations regarding rate constants determined for the process of receptor-mediated Sucrose-LDL endocytosis by Hep-G2 cells are noteworthy. First, the low Kd of 1±4¬10) M for the interaction of Sucrose-LDL with the Hep-G2 cell LDL receptor is similar in magnitude to that previously noted for the LDL receptor from other cell types (Table 2), and is also similar to that noted for other coated-pit co-internalized cell-surface receptors mediating internalization of macromolecular protein ligands, for cell-surface receptors and transporters with small-molecule ligands, and for enzymes with macromolecular substrates (Table 2). These low Kd values are typically the result of values of k that " are well below diffusion-controlled limits of 10* M−"[s−" [38], presumably due to the large sizes of the two interacting molecules, together with low values of k that range from 10−% to 10−# s−" # for receptor}transporter-mediated processes and from 10−# to
Association and dissociation rate constants for receptor–ligand and enzyme–substrate interactions
Sar, sarcosine. Receptor or enzyme
657
Ligand or substrate
Receptors with protein ligands LDL receptor Hep-G2 cells [14C]Sucrose-LDL 125 Human fibroblasts I-LDL 125 Human platelets I-LDL EGF receptor 125 Human fibroblasts I-EGF 125 Mouse fibroblasts I-EGF 125 A431 cells I-EGF Vitellogenin receptor (Xenopus oocytes) [32P]Vitellogenin 3 Substance P receptor [ H]SarMet-substance P 125 Angiotensin II receptor I-Angiotensin Receptors/transporters with small-molecule ligands β-Adrenergic receptor [3H]Dihydroalprenolol α2-Adrenergic receptor [125I]Iodoclonidine Muscarinic M1 receptor [3H]Telenzepine InsP3 receptor [3H]Ins(1,4,5)P3 A1 adenosine receptor [3H]Phenylisopropyladenosine Enzymes with macromolecular substrates Protein farnesyltransferase Farnesyl pyrophosphate cAMP-dependent protein kinase LRRASLG Trypsin Soybean trypsin inhibitor Chymotrypsin Proflavin DNA topoisomerase I 19/25-mer Ribonuclease P Pre-tRNAAsp Serine-tRNA synthetase tRNASer
k1 (M−1[s−1)
k2 (s−1)
Ref.
4±1¬104 5±5¬104 1±5¬104
5±9¬10−4 6±3¬10−5 8±0¬10−4
This study [14] [15]
2±9¬106 3±1¬106 3±4¬104 9±6¬102 3±1¬105 1±8¬1010
1±2¬10−2 2±5¬10−2 1±8¬10−3 – 7±9¬10−2 5±0¬10−5
[12] [12] [13] [17,18] [19] [20]
3±6¬106 1±3¬106 2±8¬105 1±2¬106 7±8¬105
8±7¬10−4 1±0¬10−4 2±8¬10−4 3±3¬10−3 5±0¬10−4
[39] [40] [41] [42] [43]
4±6¬106 3±0¬106 1±0¬107 1±2¬108 8±0¬105 6±3¬106 2±1¬108
1±3¬10−2 8±0¬102 1±3¬10−5 8±3¬103 8±0¬10−3 6±5¬10−1 1±1¬101
[44] [45] [46] [38] [47] [48] [38]
658 Table 3
H. J. Harwood, Jr. and L. D. Pellarin kcat, Km and kcat/Km values for receptor–ligand and enzyme–substrate interactions
HEPC, 2-hexadecanoylthio-1-ethylphosphorcholine ; ds, double-stranded ; FPP, farnesyl pyrophosphate. Receptor or enzyme
Ligand or substrate
Receptors with protein ligands LDL receptor Hep-G2 cells [14C]Sucrose-LDL 125 CHO cells I-LDL 125 PC12 cells I-LDL EGF receptor 125 Human fibroblasts I-EGF 125 Mouse fibroblasts I-EGF 125 A431 cells I-EGF Vitellogenin receptor (Xenopus oocytes) [32P]Vitellogenin Transferrin receptor 125 B82L cells I-Transferrin 125 A431 cells I-Transferrin Enzymes with macromolecular substrates cAMP-dependent protein kinase LRRASLG Myosin light chain kinase Myosin light chain Phosphoprotein phosphatase LRRAS(P)VAQL Plasmin Fibrinogen Tissue plasminogen activator Plasminogen T7 RNA polymerase 22 bp dsDNA template DNA topoisomerase I 19/25-mer Ribonuclease P Pre-tRNAAsp Enzymes with lipid substrates or lipid and protein substrates Phospholipase A2 HEPC Squalene synthetase Farnesyl pyrophosphate FPP synthase Geranyl pyrophosphate Protein geranylgeranyltransferase-I Ras(CAIL) Protein farnesyltransferase Ras(CVLS) Protein myristoyltransferase GNAAAARR
kcat (s−1)
Km (M)
kcat/Km (M−1[s−1)
Ref.
2±7¬10−3 3±1¬10−3* 2±1¬10−3*
8±0¬10−8 – –
3±4¬104 – –
This study [35] [36]
2±5¬10−3 5±3¬10−3 2±3¬10−3 1±8¬10−3
– – – –
– – – –
[9–12] [12] [13] [17,18]
1±0¬10−2 1±6¬10−2
– –
– –
[11] [13]
2±1¬101 2±9¬101 3±4¬100 1±0¬10−1 2±2¬10−1 6±0¬10−1 6±0¬102 1±9¬10−2
6±5¬10−5 5±0¬10−6 5±3¬10−4 7±3¬10−6 2±0¬10−7 2±5¬10−9 7±0¬10−8 1±2¬10−7
3±0¬105 5±7¬106 6±4¬103 1±4¬104 1±1¬106 2±4¬108 8±0¬105 1±6¬105
[45] [49] [50] [51] [52] [53] [47] [48]
2±3¬10−1 3±3¬100 1±6¬100 1±2¬10−1 9±3¬10−2 7±8¬100
7±8¬10−5 4±0¬10−5 6±7¬10−6 2±0¬10−6 6±3¬10−7 6±0¬10−5
2±9¬103 8±3¬104 2±3¬105 6±0¬104 1±5¬105 1±3¬105
[54] [55] [56] [57] [58] [58]
* Calculated values based on reported time required to complete one internalization cycle.
10$ s−" for macromolecular substrate enzyme-catalysed processes (Table 2). Within this grouping, the LDL receptor exhibits among the slowest of bimolecular association constants (4±1¬10% M−"[s−"), relative to values ranging between 10' and 10) M−" s−" for EGF, substance P and angiotensin II receptors, for receptors with small-molecular-mass ligands and for enzymes with macromolecular substrates (Table 2), while at the same time exhibiting amongst the lowest first-order dissociation constants of this grouping (5±9¬10−% s−" ; Table 2). These observations may reflect the greater size of the LDL molecule relative to the other ligands and substrates, resulting in lower k values due to greater " diffusional limitations together with decreased values of k due to # an increased number of possible interactions between ligand and receptor. By contrast, enzymes with small-molecular-mass substrates (e.g. catalase, lysozyme, creatinine kinase, lactate dehydrogenase, alcohol dehydrogenase, malate dehydrogenase, pyruvate carboxylase) exhibit Kd values that are considerably greater in magnitude (10−#–10−( M [38]) than those of cell-surface receptors with either protein or small-molecular-mass ligands or enzymes with macromolecular substrates (10−)–10−"! M ; Table 2). These differences are categorically reflected by higher first-order dissociation constants for the enzymes with low-molecular-mass substrates (10"–10& s−" [38]), with bimolecular association constants (10'–10* M−"[s−" [38]) that approximate those of the other classes of enzymes, receptors and transporters (Table 2). With respect to rates of catalysis (ke for receptor-mediated processes ; kcat for enzyme-catalysed reactions), the rate of internalization of the LDL–LDL-receptor complex by Hep-G2
cells is approximately equal to rates noted for LDL–LDLreceptor complex internalization in other cell types (estimated based on reported times required to complete one cycle of internalization), as well as rates noted for internalization of ligand–receptor complexes for receptors that are co-internalized with the LDL receptor via coated pits (C10−$ s−" ; Table 3), and presumably reflects the rate at which coated pits invaginate and are internalized from the cell surface [3]. The rates of coated-pitmediated internalization of these ligand–receptor complexes, however, are considerably lower than the rates of catalysis noted for enzymes utilizing macromolecular substrates (10−"–10# s−" ; Table 3), lipid substrates (10−"–10! s−" ; Table 3) or both protein and lipid substrates (10−"–10" s−" ; Table 3), all of which are considerably lower than the rates of catalysis observed for enzymes using small-molecular substrates (e.g. catalase, carbonic anhydrase, acetylcholinesterase, triosephosphate isomerase, fumerase ; rates of 10#–10( s−" [38]). However, the Km for the receptor-mediated internalization of LDL by Hep-G2 cells (8¬10−) M) is considerably lower than that of enzymes utilizing small-molecule substrates (10!–10−' M [38]), enzymes utilizing protein substrates (10−%–10−( M ; Table 3) and enzymes utilizing lipid substrates (C 10−' M ; Table 3), and is rivalled only by enzymes utilizing nucleic acid substrates (10−(–10−* M ; Table 3). The kcat}Km value for receptor-mediated LDL internalization by Hep-G2 cells (3±4¬10% M−"[s−") is thus similar to those exhibited by most of the enzymes with protein, nucleic acid, lipid or lipid and protein substrates (10%–10' M−"[s−" ; Table 3), but is still considerably lower than those exhibited by many of the enzymes utilizing small-molecule substrates (10&–10) M−"[s−" [38]).
Kinetics of low-density lipoprotein receptor activity in Hep-G2 cells Finally, the observation that k , the rate constant for recycling & of internalized receptors, is approx. 4 times greater than ke, the rate constant for internalization of cell-surface LDL receptors, is consistent with a process designed to maintain the majority of LDL receptors on the cell surface and to allow sufficient removal of LDL from the circulation without a requirement for vast cellsurface LDL receptor numbers. Indeed, the observation that only a fraction (approx. 20 %) of the total pool of LDL receptors in steady-state Hep-G2 cells is present in the form that is unavailable to bind LDL in the medium, together with previous observations made in fibroblasts incubated in lipid-deficient medium in which an intracellular pool was undetected [4] and in K-562 cells in the steady-state in which 10 % of the receptors were found to reside intracellularly [37], is consistent with rates for recycling of LDL receptors to the cell surface after internalization that are substantially greater than the rates of coatedpit-mediated LDL–LDL-receptor complex internalization. That the entire process of LDL–LDL-receptor complex movement to the endosomes, fusion to form recycling vesicles, fusion of these vesicles with the cell membrane, return of the LDL receptors to the cell surface and clustering within coated pits in a catalytically competent form can take place with a recycling time of less than 2 min is not unreasonable, considering that transfer of neurotransmitters from one membrane to another has been shown to occur within seconds [4]. Whether the reduced intracellular content of LDL receptors in induced fibroblasts and steady-state K-562 cells relative to HepG2 cells reflects a greater than 4-fold difference between ke and k remains to be determined. In addition, whether this func& tionally incompetent fraction of LDL receptors represents intracellular LDL receptors contained within endocytotic vesicles and in the process of returning to the cell surface, LDL receptors clustered at the cell surface but in a form that is inaccessible to LDL, or a combination of the two, also remains to be determined. Taken together, these observations indicate that receptormediated endocytotic processes for receptors that recycle can be viewed kinetically in terms of a catalytic mechanism, provided that the receptor returns to the cell surface in a catalytically competent form within a relatively short time-frame relative to the duration of measurement to undergo additional rounds of receptor-mediated internalization, and provided that the internalized ligand is retained intracellularly. Whether similar kinetic analyses are possible for other recycling receptor systems or under experimental conditions in which the number of receptors on the cell surface is altered as a consequence of physiological or pharmacological manipulation remains to be determined.
REFERENCES 1 Brown, M. S. and Goldstein, J. L. (1986) Science 232, 34–47 2 Brown, M. S., Anderson, R. G. W. and Goldstein, J. L. (1983) Cell 32, 663–667 3 Pastan, I. H. and Willingham, M. C. (1981) Science 214, 504–509 4 Goldstein, J. L., Anderson, R. G. W. and Brown, M. S. (1979) Nature (London) 279, 679–685 5 Myant, N. B. (1990) Cholesterol Metabolism, LDL, and the LDL receptor, pp. 233–315, Academic Press Inc., New York 6 Goldstein, J. L., Brown, M. S., Anderson, R. G. W., Russell, D. W. and Schneider, W. J. (1985) Ann. Rev. Cell Biol. 1, 1–39 7 Goldstein, J. L. and Brown, M. S. (1977) Annu. Rev. Biochem. 46, 897–930 8 Kaplan, J. (1981) Science 212, 14–20 9 Wiley, H. S. and Cunningham, D. D. (1982) J. Biol. Chem. 257, 4222–4229 10 Wiley, H. S. and Cunningham, D. D. (1981) Cell 25, 433–440 11 Lund, K. A., Opresko, L. K., Starbuck, C., Walsh, B. J. and Wiley, H. S. (1990) J. Biol. Chem. 265, 15713–15727 Received 17 June 1996/16 December 1996 ; accepted 19 December 1996
659
12 Knauer, D. J., Wiley, H. S. and Cunningham, D. D. (1984) J. Biol. Chem. 259, 5623–5631 13 Wiley, H. S. (1988) J. Cell Biol. 107, 801–810 14 Pitas, R. E., Innerarity, T. L., Arnold, K. S. and Mahley, R. W. (1989) Proc. Natl. Acad. Sci. U.S.A. 76, 2311–2315 15 Pedreno, J., DeCastellarnau, C., Cullare, C., Sanchez, J., Gomez-Gerique, J., Ordonez-Llanos, J. and Gonzalez-Sastre, F. (1992) Arteriosclerosis Thromb. 12, 1353–1362 16 Javitt, N. B. (1990) FASEB J. 4, 161–168 17 Opresko, L. K. and Wiley, H. S. (1987) J. Biol. Chem. 262, 4109–4115 18 Opresko, L. K. and Wiley, H. S. (1987) J. Biol. Chem. 262, 4116–4123 19 Johnson, C. L. and Johnson, C. G. (1992) J. Neurochem. 58, 471–477 20 Servant, G., Boulay, G., Bosse, R., Escher, E. and Guillemette, G. (1993) Mol. Pharmacol. 43, 677–683 21 Havekes, L., van Hinsbergh, V., Kempen, H. J. and Emeis, J. (1983) Biochem. J. 214, 951–958 22 Goldstein, J. L., Basu, S. K. and Brown, M. S. (1983) Methods Enzymol. 98, 241–260 23 Rajan, V. P. and Menon, K. M. J. (1985) Endocrinology 117, 2408–2416 24 Pittman, R. C. and Taylor, Jr., C. A. (1986) Methods Enzymol. 129, 612–628 25 Goldstein, J. L. and Brown, M. S. (1974) J. Biol. Chem. 249, 5153–5162 26 Fersht, A. (1985) Enzyme Structure and Mechanism, pp. 98–120, W. H. Freeman and Co., New York 27 Plowman, K. M. (1972) Enzyme Kinetics, pp. 30–39, McGraw Book Co., New York 28 Dashti, N., Wolfbauer, G., Koren, E., Knowles, B. and Alaupovic, P. (1984) Biochim. Biophys. Acta 794, 373–384 29 Pittman, R. C., Carew, T. E., Attie, A. D., Witztum, J. L., Watanabe, Y. and Steinberg, D. (1982) J. Biol. Chem. 257, 7994–8000 30 Pittman, R. C. and Steinberg, D. (1978) Biochem. Biophys. Res. Commun. 81, 1254–1259 31 Pittman, R. C., Green, S. .R., Attie, A. D. and Steinberg, D. (1979) J. Biol. Chem. 254, 6876–6879 32a Harwood, Jr., H. J. and Pellarin, L. D. (1996) FASEB J. 10, A1104 32 Pellarin, L. D. and Harwood, Jr., H. J. (1992) FASEB J. 6, A1362 33 Larkin, J. M., Donzell, W. C. and Anderson, R. G. W. (1985) J. Cell Physiol. 124, 372–378 34 Segel, I. H. (1976) Biochemical Calculations, p. 236, John Wiley and Sons, New York 35 Anderson, R. G. W., Brown, M. S. and Goldstein, J. L. (1981) J. Cell Biol. 88, 441–452 36 Green, S. A. and Kelly, R. B. (1992) J. Cell Biol. 117, 47–55 37 Bos, C. R., Shank, S. L. and Snider, M. D. (1995) J. Biol. Chem. 270, 665–671 38 Fersht, A. (1985) Enzyme Structure and Mechanism, pp. 121–154, W. H. Freeman and Co., New York. 39 Spurlock, M. E., Cusumano, J. C. and Mills, S. E. (1993) J. Anim. Sci. 71, 1778–1785 40 Baron, B. M. and Seigel, B. W. (1990) Mol. Pharmacol. 38, 348–356 41 Feifel, R., deMiranda, J. F. R., Strohmann, C., Tacke, R., Assen, A. J., Mutschler, E. and Lambrecht, G. (1991) Eur. J. Pharmacol. 195, 115–123 42 Garlind, A., Cowburn, R. F. and Fowler, C. J. (1994) Neurochem. Int. 24, 73–80 43 Casado, V., Mallol, J., Lluis, C., Canela, E. I. and Franco, R. (1991) J. Cell Biochem. 47, 278–288 44 Furfine, E. S., Leban, J. J., Landavazo, A., Moomaw, J. F. and Casey, P. J. (1995) Biochemistry, 34, 6857–6862 45 Adams, J. A. and Taylor, S. S. (1992) Biochemistry 31, 8516–8522 46 Otlewski, J. and Zbyryt, T. (1994) Biochemistry 33, 200–207 47 Stivers, J. T., Shuman, S. and Mildvan, A. S. (1994) Biochemistry 33, 327–339 48 Beebe, J. A. and Fierke, C. A. (1994) Biochemistry 33, 10294–10304 49 Ikebe, M. and Hartshorne, D. J. (1986) J. Biol. Chem. 261, 8249–8253 50 Shacter, E., Chock, P. B. and Stadtman, E. R. (1984) J. Biol. Chem. 259, 12252–12259 51 Simon, D. I., Ezratty, A. M. and Loscalzo, J. (1994) Biochemistry 33, 6555–6563 52 Stack, M. S. and Pizzo, S. V. (1994) Arch. Biochem. Biophys. 309, 117–122 53 Maslak, M. and Martin, C. T. (1994) Biochemistry 33, 6918–6924 54 Warwicker, J., Muller-Harvey, I., Sumner, I. and Bhat, K. M. (1994) J. Mol. Biol. 236, 904–917 55 Zhang, D., Jennings, S. M., Robinson, G. W. and Poulter, C. D. (1993) Arch. Biochem. Biophys. 304, 133–143 56 Song, L. and Poulter, C. D. (1994) Proc. Natl. Acad. Sci. U.S.A. 91, 3044–3048 57 Yokoyama, K., McGeady, P. and Gelb, M. H. (1995) Biochemistry 34, 1344–1354 58 Pompliano, D. L., Rands, E., Schaber, M. D., Mosser, S. D., Anthony, N. J. and Gibbs, J. B. (1992) Biochemistry 31, 3800–3807