Mexico and Portugal, or jointly, by groups of countries, thus identifying on one ... changes in policies, in Mexico as well) and 4) repatriation policies designed to.
Higher Eductation in Ibero-America | 2015 Report
Knowledge transfer activities, innovation and entrepreneurship in universities. EXECUTIVE SUMMARY
Senén Barro Ameneiro (Ed.)
EXECUTIVE SUMMARY: Knowledge transfer activities, innovation and entrepreneurship in universities Higher Education in Ibero-America 2015 Report This document is the Executive Summary of the book: Knowledge transfer activities, innovation and entrepreneurship in universities. Higher Education in Ibero-America. 2015 Report, available at http://www.cinda.cl/wp-content/uploads/2014/02/LIBRO-INFORME-TRANSFERENCIA-DE-I-D-2015.pdf. This report should be referenced as follows: Barro, S. (ed.) (2015). La transferencia de I+D, la innovación y el emprendimiento en las universidades. Educación superior en Iberoamérica. Informe 2015. Chile: CINDA. .
|1
INDEX
1.
INTRODUCTION ..................................................................................................................... 3
2.
R&D RESOURCES IN HIGHER EDUCATION SYSTEMS ............................................................. 4
3. THE INSTITUTIONALIZATION OF THE SUPPORT OF KNOWLEDGE AND TECHNOLOGY TRANSFER ...................................................................................................................................... 6 3.1. THE TECHNOLOGY TRANSFER OFFICES (TTOs) ................................................................... 6 3.2. OTHER INTERFACE STRUCTURES: INCUBATORS AND SCIENCE/TECHNOLOGY PARKS....... 7 3.3. TECHNOLOGY TRANSFER REGULATIONS............................................................................ 8 4. RESULTS FROM UNIVERSITY RESEARCH .................................................................................... 9 4.1. ADVANCED HUMAN CAPITAL ............................................................................................. 9 4.2. BIBLIOMETRIC INDICATORS.............................................................................................. 10 5. RESULTS FROM UNIVERSITY KNOWLEDGE AND TECHNOLOGY TRANSFER ............................ 12 5.1. PATENTING AND LICENSING ACTIVITIES .......................................................................... 12 5.2. SCIENTIFIC, TECHNICAL OR ARTISTIC ACTIVITIES COMMISSIONED OR HIRED TO THIRD PARTIES ................................................................................................................................... 14 6. RESULTS FROM ENTREPRENEURSHIP...................................................................................... 15 7. CONSIDERATIONS AND RECOMMENDATIONS FOR THE DESIGN OF POLICIES IN R&D&I&E .. 16 INFORMATION AVAILABILITY .................................................................................................. 16 FINANCIAL R&D RESOURCES ................................................................................................... 17 HUMAN R&D RESOURCES ....................................................................................................... 17 INTERFACE STRUCTURES ......................................................................................................... 17 THE INSTITUTIONALIZATION OF KNOWLEDGE TRANSFER ACTIVITIES.................................... 18 ADVANCED HUMAN CAPITAL .................................................................................................. 18 BIBLIOMETRIC INDICATORS..................................................................................................... 19 PATENTING AND LICENSING ACTIVITIES ................................................................................. 19 ACADEMIC ENTREPRENEURSHIP ............................................................................................. 20 INSTITUTIONAL CONCENTRATION OF RESOURCES AND RESULTS .......................................... 20 REFERENCES ................................................................................................................................ 20 ANNEX 1: CONTRIBUTING AUTHORS .......................................................................................... 22 ANNEX 2: ACRONYMS OF COUNTRIES IN FIGURES ..................................................................... 22
Higher Education in Ibero-America. 2015 Report. Executive Summary |3
EXECUTIVE SUMMARY: Knowledge transfer activities, innovation and entrepreneurship in universities. Higher Education in Ibero-America. 2015 Report.
Senén Barro Researcher at Centro de Investigación en Tecnologías de la Información (CiTIUS) from the University of Santiago de Compostela and President of RedEmprendia Sara Fernández Associate professor at the University of Santiago de Compostela
1. INTRODUCTION
Universities need to provide solutions to the social and economic needs of the region where they are based. Their mission is no longer limited to research and education; instead, they have included a “third” dimension, namely to contribute to the economic growth of their regions (Branscomb, Kodama, & Florida, 1999; Etzkowitz et al., 2000). As a consequence, the role of universities in the national Science and Innovation System (SIS) is undeniable. In the specific context of Ibero-America, they gain even further relevance, as the other agents making up the ecosystem of innovation -mainly firms or the private industry- play a secondary role compared to regions with a similar level of development. This is why it is fundamental to study the contribution of Higher Education Institutions (HEIs) in such aspects. The following is an Executive Summary of the book Higher Education in Ibero-America. 2015 Report, which analyzes the transfer of knowledge, the innovation and the entrepreneurship of the IberoAmerican Higher Education Systems (HESs) during the first decade of the 21st century. In order to improve related aspects, first we need to perform an accurate diagnosis from which to lay the foundation for the appropriate recommendations leading to public and university policies. The report is divided into chapters analyzing the processes and the contribution of academic R&D. Due to the inconsistencies in the amount of information and its availability among Ibero-American HESs, the analysis has been made individually (country by country), for Argentina, Brazil, Chile, Colombia, Spain, Mexico and Portugal, or jointly, by groups of countries, thus identifying on one side a group formed by Costa Rica, Ecuador, Panama, Peru and Uruguay (Group 1), and, on the other, a group formed by Bolivia, Guatemala, Honduras, Nicaragua, Paraguay, the Dominican Republic, El Salvador and Venezuela (Group 2). These country studies are the basis which the penultimate chapter stems from. It refers to the strong and weak points of the connections between university R&D (Research and Development) and the industry, and it develops a group analysis of the region, allowing us to draw fundamental conclusions and recommend actions to improve the situation, summarized in the last chapter, Considerations and Recommendations for the Design of Policies in R&D&I&E (Research and Development and Innovation and Entrepreneurship). The Executive Summary presented in this document is the result of both chapters. Following this introduction, the next section describes the human and financial resource endowment allocated to academic R&D. The third section studies to which extent the support of transfer from universities has been institutionalized. Sections four to six present the main results from the HESs measured in terms of publications, patenting activity and entrepreneurship, respectively. Finally, we present the main considerations regarding knowledge transfer, innovation and entrepreneurship in the HESs of the region, as well as the main recommendations that can be drawn from the trends detected in these processes.
Higher Education in Ibero-America. 2015 Report. Executive Summary |4
2. R&D RESOURCES IN HIGHER EDUCATION SYSTEMS
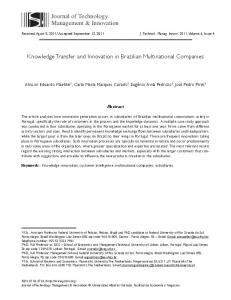
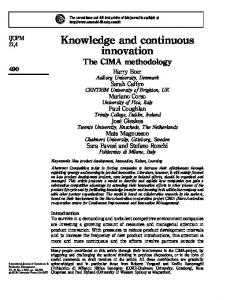
During the decade 2000-2010, the financial and human R&D resources of Ibero-American HESs have risen significantly. With regards to financial resources, every country, except Guatemala, has considerably increased the expenditure on university R&D. In fact, this amount has doubled in most countries and even multiplied by three in Portugal and Costa Rica, and by four in Colombia and Uruguay (Figure 1). However, we must note that in Spain and Portugal, for which we have data for 2011 and 2012, this indicator is falling as a consequence of the severe crisis their economies have suffered since 2008. Above $200 million in 2010
Below $200 million in 2010
7,000
120
6,000
100
5,000
80
4,000
60
3,000 2,000
40
1,000
20
-
B
E
M
P
2000
A
CH CO
CR
U
2010
EL_S GU
2000
PA
EC
2010
Figure 1. R&D expenditure at current prices and PPPs performed by the HES in some countries of the region (20002010).
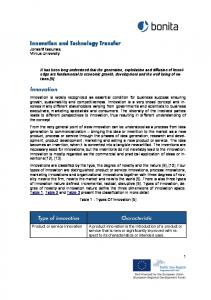
Similarly, the number of researchers in full-time equivalent (FTE) experienced significant growth rates. This indicator has multiplied by two in Argentina, Brazil, Colombia and Costa Rica and by three in Portugal and Venezuela, whereas this growth has been more moderate in the rest of countries (Figure 2). Growth has been accompanied by an improvement in the quality of human resources due to the admission of PhD students and can also be explained by: 1) the increase in the number of doctorate scholarships (in Argentina); 2) the increase in the number of higher education institutions (in Brazil and Mexico); 3) the design of academic careers providing more stability for researchers (in Brazil and, since the introduction of recent changes in policies, in Mexico as well) and 4) repatriation policies designed to attract researchers working abroad (in Mexico). Above 5,000 researchers (FTE) in 2010
Below 1,500 researchers (FTE) in 2010 1,600
100,000 90,000 80,000 70,000 60,000 50,000 40,000 30,000 20,000 10,000 -
1,400 1,200 1,000 800 600 400 200 B
E
P 2000
A
M CH CO
2010
V
U
BO
EC
2000
CR 2010
GU
PA
Higher Education in Ibero-America. 2015 Report. Executive Summary |5 Figure 2. Researchers (FTE) in the HES in some countries of the region (2000-2010).
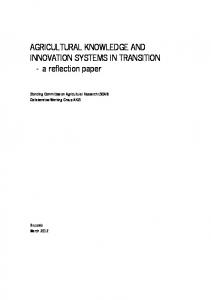
The HESs of Brazil and Spain represent nearly 70% of the total expenditure on R&D performed by the HESs analyzed, as well as 62% of FTE researchers. When adding Mexico, Portugal and Argentina, these percentages would exceed 90% for both indicators and these figures have been reasonably stable throughout the decade 2000-2010 (Figure 3). Shares of R&D expenditure by selected countries as a percentage of total R&D expenditure performed by the HES of Ibero-America (in millions of PPPs)
P 8%
A 7%
Rest of IberoAmerica 4% B 37%
M 12%
Shares of R&D researchers (FTE) by selected countries as a percentage of total researchers (FTE) in the HES of Ibero-America Rest of IberoAmerica 11% M 7%
B 35%
A 9% P 12%
E 32%
E 26%
Figure 3. Shares of R&D expenditure and researchers (FTE) of the HES (2010).
There is, however, a clear gap in the human R&D resources between countries. While Spain and Portugal -mainly the latter- report a number of researchers per 1,000 labor force (FTE) similar to that of developed countries, and Chile maintained the proportion of over one researcher throughout the decade, only Argentina managed to reach this level in 2010 and Brazil came near to this figure. On the contrary, Colombia, Costa Rica, Ecuador, Mexico and Venezuela are far behind, with indicators not reaching one researcher per 3,000 labor force (FTE). Meanwhile, the ratio of professional and support personnel per researcher for those HESs where information is available shows a shortage of R&D support staff. Therefore, researchers are usually forced to accept the huge bureaucratic workload of running R&D activities, undermining the overall system’s efficiency. In several of the HESs analyzed, in particular those from Latin America and the Caribbean (LAC), R&D resources tend to concentrate in a few universities, while the rest of HEIs have hardly any involvement in R&D activities. Furthermore, this concentration usually follows a centralizing trend around large cities (in Argentina, Brazil or Chile), as well as public universities, because private HEIs, with a few exceptions, still focus their offer on teaching (in Mexico). Apart from the differences in size, the Ibero-American HESs are crucial agents within the national SIS, due to the importance of their share both in R&D expenditure and researchers (FTE). Thus, in 2010 they performed around 30% of the R&D expenditure. In Colombia, Costa Rica, Portugal and Uruguay this percentage raised to 40%, and over 90% in Guatemala. Besides, they concentrated the majority of researchers (FTE), except, on one hand, Costa Rica, where its HES gatherer around 15% of all researchers in the SIS, and, on the other hand, Argentina, Spain and Mexico, where their HESs gathered around 35%, and sometimes more, of all researchers. These figures follow the same trend detected in the decade 1997-2007 (Santelices, 2010). In addition, for some of the region’s countries, experts have also pointed that HESs concentrate a high part of the infrastructure and facilities their governments allocate to R&D activities. This leads to two intangible values making HESs essential: they are virtually the only ones responsible for qualifying advanced human capital and, due to the lack of researchers in the private industry of the region’s countries, they support innovation in the private industry far more than HESs in more developed countries.
Higher Education in Ibero-America. 2015 Report. Executive Summary |6
3. THE INSTITUTIONALIZATION OF THE SUPPORT OF KNOWLEDGE AND TECHNOLOGY TRANSFER We have analyzed two aspects concerning the institutionalization of the support of knowledge and technology transfer: infrastructures or interface structures providing this service and the regulations applicable.
3.1. THE TECHNOLOGY TRANSFER OFFICES (TTOs) The interface structures bridging academia and industry have adopted numerous legal and organizational forms in the region’s countries. The most common one, though under different names, is the Technology Transfer Office (TTO), known as Oficinas de Transferencia de Resultados de Investigación (OTRI) in the Iberian Peninsula. This kind of infrastructure has appeared progressively in the region’s HESs. Their appearance sequence has several elements in common; at the beginning, the TTOs generally appear in a few universities to fulfil the need for a “professional manager” to transfer research results. At that moment, their tasks focus on protecting the universities’ research results and on strengthening links with industry. Later, as this “motivation” is shared by other HEIs, there is an increase in the number of TTOs, though often not attached to a strategic plan. When some TTOs settle down, the nature of their work leads to the creation of a national TTO network. In so doing, TTOs aim to take advantage of their limited resources by combining their efforts and sharing experiences in order to foster knowledge transfer. As a result of this process, the TTOs are created when the “third mission of universities becomes more relevant in the region’s HESs” (Figure 4).
E
1990
CH
A-
A+ 2000 B+ P
2001
B-
GAPI
CO M G1 G2
2010
>2011 1998 RedOTRI 1998
RPITC
2003
Red OTT
RedVITEC
2006 FORTEC
Figure 4. Chronology of the TTOs and the national TTO networks in some countries of the region. Notes: The figure places each HES in the approximate decade when the TTOs appear. It is possible that some universities already had a TTO before that. However, we do not reflect this situation as it is not illustrative in the HES. The symbols - / + reflect the appearance of some/many TTOs in the country. The dates in which the TTO networks appear are displayed in the boxes.
It has been difficult to obtain information regarding the interface structures from some HESs both from a quantitative and a descriptive point of view, due to a lack of systematic data (Table 1).
Higher Education in Ibero-America. 2015 Report. Executive Summary |7 Table 1 Interface Structures in Some Countries of the Region Indicators % of universities with TTOs Age of TTOs in years (mean) Number of staff (FTE) of TTOs (mean) Technical staff of TTOs (%) Administrative staff of TTOs (%) % of universities with incubators
B 2012 34.14% n.a. 7 60% 40% 37.96% (1)
(1)
CH 2012 36.70% 4.7 n.a. n.a. n.a. 31.70%
CO 2014 48% 5 3 28% 72% 27.00%
(2)
ES 2011 92% > 15 12.6 75% 25%
M 2012 77.16% 5.6 17.9 57% 43%
P 2010 87.50% 75% 51%-75% 25%-50% 75% 51%-75% 25%-50%