GEOPHYSICAL RESEARCH LETTERS, VOL. 33, L19402, doi:10.1029/2006GL027070, 2006
Land water storage within the Congo Basin inferred from GRACE satellite gravity data John W. Crowley,1 Jerry X. Mitrovica,1 Richard C. Bailey,2 Mark E. Tamisiea,3 and James L. Davis3 Received 31 May 2006; revised 2 August 2006; accepted 5 September 2006; published 3 October 2006.
[1] GRACE satellite gravity data is used to estimate terrestrial (surface plus ground) water storage within the Congo Basin in Africa for the period of April, 2002 – May, 2006. These estimates exhibit significant seasonal (30 ± 6 mm of equivalent water thickness) and long-term trends, the latter yielding a total loss of !280 km3 of water over the 50-month span of data. We also combine GRACE and precipitation data sets (CMAP, TRMM) to explore the relative contributions of the source term to the seasonal hydrological balance within the Congo Basin. We find that the seasonal water storage tends to saturate for anomalies greater than 30– 40 mm of equivalent water thickness. Furthermore, precipitation contributed roughly three times the peak water storage after anomalously rainy seasons, in early 2003 and 2005, implying a !60– 70% loss from runoff and evapotranspiration. Finally, a comparison of residual land water storage (monthly estimates minus best-fitting trends) in the Congo and Amazon Basins shows an anticorrelation, in agreement with the ‘‘see-saw’’ variability inferred by others from runoff data. Citation: Crowley, J. W., J. X. Mitrovica, R. C. Bailey, M. E. Tamisiea, and J. L. Davis (2006), Land water storage within the Congo Basin inferred from GRACE satellite gravity data, Geophys. Res. Lett., 33, L19402, doi:10.1029/2006GL027070.
1. Introduction [2] The recent rise in the Earth’s mean surface temperature, as suggested by a suite of climatological data, should be accompanied by variations in the atmospheric and terrestrial hydrological water balances. Indeed, the connection between climate change and the hydrological cycle has motivated a variety of satellite-based measurements, including the Gravity Recovery and Climate Experiment (GRACE), which has been operational since March, 2002. [3] GRACE has provided maps at approximately one month intervals of the Earth’s gravitational field from which one may infer trends in surface-mass anomalies [Swenson and Wahr, 2002; Tapley et al., 2004; Wahr et al., 2004]. For example, recent analyses of the data set indicate long-term mass loss from the Alaskan glacier system [Tamisiea et al., 2005] equivalent to 0.31 ± 0.09 mm/yr of geographically uniform sea-level rise, in agreement with estimates from an 1 Department of Physics, University of Toronto, Toronto, Ontario, Canada. 2 Departments of Physics and Geology, University of Toronto, Toronto, Ontario, Canada. 3 Harvard-Smithsonian Center for Astrophysics, Cambridge, Massachusetts, USA.
Copyright 2006 by the American Geophysical Union. 0094-8276/06/2006GL027070
earlier altimetry survey [Arendt et al., 2002]. Furthermore, Velicogna and Wahr [2005, 2006] have inferred contributions to sea-level trends of 0.21 ± 0.07 mm/yr and 0.4 ± 0.2 mm/yr from the melting of Greenland and the Antarctic ice, respectively. [4] In addition, GRACE-derived estimates of land water storage have provided constraints on continental hydrology, both globally and regionally [Rodell et al., 2004; Tapley et al., 2004; Wahr et al., 2004]. Not surprisingly, there has been a particular emphasis on the Amazon Basin. Tapley et al. [2004], for example, estimated significant seasonal variations in land water storage over South America, and they were able to resolve the Amazon watershed from smaller systems in the north. The direct connection between gravity and inferred water storage within the Amazon was confirmed by Davis et al. [2004], who showed that radial crustal deformations predicted on the basis of the latter are highly correlated with local GPS measurements. Finally, Syed et al. [2005] combined GRACE and atmospheric water balance estimates to estimate discharge in the Amazon and Mississippi Basins. [5] In this paper we use GRACE gravity data to constrain land water storage within the Congo Basin in Africa. Whereas the Amazon is characterized by the greatest discharge of all basin watersheds on Earth, draining over 7 million square kilometres of land, the Congo River drains a watershed, the Congo Basin, that covers more than 4.1 million square kilometres. This drainage represents !40% of the continent’s total discharge. We begin by estimating total water storage anomalies within the Congo Basin from 2002–2006. This storage ultimately represents a balance between source (precipitation) and sink (runoff, evapotranspiration) terms. Our next step is to combine estimates of water storage and precipitation to estimate the interplay between source and sink terms in the hydrological mass balance. The estimates of precipitation in the Congo Basin are derived from both the CPC Merged Analysis of Precipitation (CMAP) and the Tropical Rainfall Measuring Mission (TRMM) data sets. Finally, we expand our analysis by comparing anomalies in the monthly measurements of land water storage (relative to best-fitting linear, quadratic, semi-annual, and annual trends) in the Congo and Amazon Basins. Eltahir et al. [2004] inferred an anti-correlation in runoff anomalies between these two basins by using TRMM and river flow data, and argued for a climatic ‘‘see-saw oscillation’’ from one side of the Atlantic to the other. We test whether this oscillation is apparent in the land water storage.
2. Results 2.1. Using GRACE to Estimate Land Water Variability [6] Over the period spanning April, 2002, to May, 2006, the GRACE gravity data set comprises 46 gravity field
L19402
1 of 4
L19402
CROWLEY ET AL.: WATER STORAGE IN THE CONGO BASIN
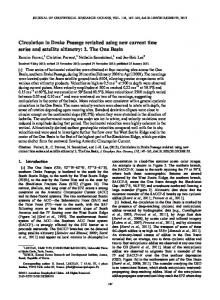
Figure 1. Geographic mask adopted for the Congo Basin analysis. The solid line represents the perimeter of the Congo Basin watershed. The colour contours represent the averaging function, or mask, associated with this zone, after Gaussian smoothing is applied with an averaging kernel halfwidth of 600 km.
solutions (CSR’s RL01 constrained solutions), each represented as a set of spherical harmonic coefficients. While many of the monthly (irregularly spaced, but !30 days) datasets include harmonics up to degree 120, several only include up to degree 70. For consistency, and because harmonics above 70 are subject to increasing and large error, we adopt a maximum truncation at degree and order 70. Due to the large uncertainty in the GRACE derived C20 coefficient, the C20 values in the GRACE solutions are replaced, following Velicogna and Wahr [2005], by those obtained from the analysis of Satellite Laser Ranging (SLR) data from the five geodetic satellites: Lageos-1 and 2, Starlette, Stella and Ajisai [Cheng and Tapley, 2004]. As a first step, we define a geoid anomaly for each monthly data set by subtracting the mean value obtained from all 46 GRACE solutions. Next, we convert these anomalies into equivalent surface mass anomalies using the Love number approach described by Swenson and Wahr [2002]. [7] We compute the average of these surface mass anomalies over a region that encompasses the Congo Basin. Following Eltahir et al. [2004], we adopt a (raw) averaging mask with perimeter shown by the solid line in Figure 1. In practise, Gaussian smoothing is applied to the mask with a half-width chosen to balance consideration of errors and signal amplitude. Specifically, the larger the half-width the smaller the error in the average; however, a smearing of the mask into surrounding regions will also result from a large half-width [Swenson and Wahr, 2002; Tapley et al., 2004]. Figure 1 shows the mask for the case of an averaging kernel half-width of 600 km. [8] To estimate errors in the spherical harmonic coefficients of the GRACE gravity data we performed a least squares fit to the time series for the individual harmonic coefficients using linear, annual, and semi-annual terms. The RMS value for the residuals of the fit for each coefficient was then calculated and used as an estimate for the error. The reduction in the error RMS due to fitting a seasonal cycle to a finite number of random numbers was taken into account and
L19402
corrected for using the approach of Wahr et al. [2006]. The resulting error estimate is likely an upper bound since the RMS residual includes signals from natural processes. Errors for the calculated monthly average equivalent water depth values were computed using the calculated errors in the coefficients and Monte-Carlo techniques. [9] The computed time series of average land water anomalies over the Congo Basin from April, 2002– May, 2006, in units of equivalent water depth, is shown in Figure 2a. A least squares fit to the time series was performed using linear, quadratic, semi-annual and annual terms; the best-fit model, and the inferred long-term (linear plus quadratic) trend, are shown by the solid and dashed blue lines, respectively, in Figure 2a. The best-fitting parameters for the least squares fit are given in Table 1 (600 km half-width for Gaussian smoothing of the mask). Not surprisingly, there is a strong seasonality in the time series, with annual amplitude of 30 ± 6 mm. A significant longer-term drying trend within the Congo Basin is also apparent, with an accumulated reduction of !70 mm over the GRACE time window. This value corresponds to a loss of !280 km3 of water from the basin. We repeated the analysis in Figure 2a using CSR’s RL01 unconstrained solutions (Figure 2b) and found consistent results. Specifically, the total water loss in this case was estimated to be !240 km3. While results for both the constrained and unconstrained solutions reveal a significant drying trend, the four year time window is insufficient to conclude that the estimated trend is secular. [10] To consider the sensitivity of the results on the choice of smoothing applied to the averaging mask, we repeated the calculation for a Gaussian smoothing with half-width of 300 km. The result, summarized in Table 1, indicates that our inference of a drying trend in the Congo Basin is robust relative to this choice. We also repeated our procedure using
Figure 2. (a) Water storage anomalies for April, 2002– May, 2006 estimated from GRACE satellite gravity data (constrained solution) over the Congo basin. The estimates adopt the mask defined by the colour contours in Figure 1. The solid blue line is the best least-squares fit to the values using semi-annual, annual, linear and quadratic terms (Table 1, with 600 km averaging kernel half-width). The long-term (linear plus quadratic) trend is given by the dotted blue line. (b) Same as Figure 2a but with the water storage anomalies derived from the unconstrained GRACE data set.
2 of 4
CROWLEY ET AL.: WATER STORAGE IN THE CONGO BASIN
L19402
L19402
Table 1. Coefficients for Least-Squares Best Fit Gaussian Half-Width
600 km
300 km
Constant Term, mm Linear Term, mm/year Quadratic Term, mm/year2 Annual Amplitude, mm Annual Phase, days Semi-Annual Amplitude, mm Semi-Annual Phase, days
40 ± 13 %17 ± 12 0±2 30 ± 6 39 ± 11 15 ± 5 %10 ± 20
39 ± 14 %16 ± 13 0±3 29 ± 6 38 ± 12 16 ± 6 %10 ± 20
an averaging mask appropriate for the Amazon Basin. For this case, we estimated an accumulated change in water storage close to zero over the GRACE time window. We conclude that the magnitude of the total change in ground and surface water mass in the Congo Basin has far exceeded that of the Amazon Basin over the period sampled by the GRACE satellite gravity mission. 2.2. The Terrestrial Hydrological Cycle and Precipitation [11] While GRACE provides important information regarding ground and surface water storage in the Congo Basin, discriminating the source and sink magnitudes within the terrestrial hydrological cycle requires that further, independent constraints be brought to bear. The terrestrial hydrological water balance is commonly written as dW ðt Þ ¼ Pðt Þ % Rðt Þ % Eðt Þ; dt
ð1Þ
where W is the land water storage, P is the precipitation, R is the runoff, and E is the evapotranspiration. If each component on the RHS of equation (1) is decomposed into constant, linear, and time-variable sinusoidal (annual, semi-annual, etc.) terms, for example Pðt Þ ¼ Po þ P1 t þ P' ðt Þ
ð2Þ
Figure 3. Solid red line with error bars: Monthly land water storage anomalies estimated from GRACE data with the constant, linear and quadratic trends removed (i.e., deviation of the monthly estimates in Figure 2 from the dashed blue line). Blue and green lines: Integrated monthly precipitation anomalies (first term on the RHS of equation (3)) for the CMAP and TRMM data sets, respectively. All calculations used the averaging mask given by the colour contours in Figure 1. both data sets to estimate the first term on the RHS of equation (3) for a period spanning November, 2001, to March, 2006 (i.e., best-fit constant and linear terms were removed from the raw data and the residual was integrated over time). Averages over the Congo Basin were determined using the mask shown in Figure 1. The results from the CMAP and TRMM data sets are shown by the solid blue and green lines, respectively, in Figure 3. [13] A comparison between the time variability evident in both the GRACE-derived land water storage and the integrated precipitation time series estimated from the CMAP and TRMM data shows very good qualitative agreement.
for the precipitation, and similarly for R and E, then integrating and rearranging terms in equation (1) yields 1 W ðt Þ % ðPo % Ro % Eo Þt % ðP1 % R1 % E1 Þt 2 þ C 2 Zt ¼ ½P' ðt 0 Þ % R' ðt 0 Þ % E ' ðt 0 Þ)dt0 ;
ð3Þ
to
where C is a constant of integration. [12] Figure 3 shows the GRACE-derived time series of land water storage (Figure 2) after removal of the constant, linear, and quadratic trends, which represents an estimate of the LHS of equation (3). The equation indicates that this time series is the difference in the integral of the precipitation anomalies (the source) and the runoff and evapotranspiration anomalies (the sinks), all integrated from some reference time t0. Runoff and, in particular, evapotranspiration are difficult to measure accurately; however, global precipitation data sets are available to quantify the source term. Specifically, the CMAP data set includes monthly mean precipitation rates on a global grid with a spatial resolution of 2.5!. The TRMM data set provides a tropical grid with 0.25! resolution. We use
Figure 4. Solid blue line: Residuals from the least-squares best fit to the monthly ground and surface water anomalies in the Congo Basin obtained using the GRACE gravity data set (i.e., solid blue line minus the red ‘‘data’’ in Figure 2). Dotted blue line: Analogous residuals for ground and surface water anomalies in the Amazon Basin.
3 of 4
L19402
CROWLEY ET AL.: WATER STORAGE IN THE CONGO BASIN
Moreover, as expected, the integrated precipitation tends to bound the water storage. We note that over seasonal time scales the basin water storage tends to saturate at !30– 40 mm of equivalent water storage. After anomalously rainy seasons, in early 2003, 2005, and 2006, the integrated precipitation exceeded this storage by a factor of !3, suggesting a !3:2 ratio between the amplitudes of the source and sink (runoff and evapotranspiration) terms. In contrast, more moderate precipitation levels in early 2004 did not exceed the water storage saturation, and in this case the sink terms are less important to the hydrological balance. If runoff data were additionally available for the Congo Basin (and in particular the Congo River), then the full decomposition of the hydrological mass balance given by equation (3) could be completed, and this will be the subject of future work.
3. Further Remarks [14] Eltahir et al. [2004] demonstrated, using river flow anomalies in the Amazon and Congo Basins, a natural seesaw oscillation in the climatic variability across the Atlantic. The anti-correlation is consistent with a model of tropical circulation characterized by contemporaneous upwelling and downwelling flow (and thus flood and drought conditions) on opposite sides of this ocean. In Figure 4 we show residuals between the individual monthly water storage estimates and the best least-squares fit (using constant, linear, quadratic, semi-annual, and annual terms) through these estimates for our analyses of both the Congo (solid blue; see Figure 2) and Amazon (dashed blue) Basins. These residuals are to be interpreted as anomalies about a best-fitting variability in the time series. The correlation coefficient between the two curves (%0.45) is statistically significant at the 90% confidence level. (An analysis performed using the unconstrained GRACE solutions yielded a correlation coefficient of %0.41, which is also significant at the 90% confidence level.) This result supports the climate mode proposed by Eltahir et al. [2004]. We conclude that analyses of this kind, which focus on comparative hydrology and thus global-scale climate variability, should be a target for future GRACE research. [15] Acknowledgments. This research was supported, in part, by NASA grant NNG04GF09G, and NSERC. CMAP precipitation data was
L19402
provided by the NOAA/OAR/ESRL PSD, Boulder, Colorado, USA, from their web site at http://www.cdc.noaa.gov/, and the TRMM data by NASA at their web site http://trmm.gsfc.nasa.gov.
References Arendt, A. A., K. A. Echelmeyer, W. D. Harrison, C. S. Lingle, and B. Valentine (2002), Rapid wastage of Alaska glaciers and their contribution to rising sea level, Science, 297, 382 – 386. Cheng, M., and B. D. Tapley (2004), Variations in the Earth’s oblateness during the past 28 years, J. Geophys. Res., 109, B09402, doi:10.1029/ 2004JB003028. Davis, J. L., P. Elsegui, J. X. Mitrovica, and M. E. Tamisiea (2004), Climatedriven deformation of the solid Earth from GRACE and GPS, Geophys. Res. Lett., 31, L24605, doi:10.1029/2004GL021435. Eltahir, E. A. B., B. Loux, T. K. Yamana, and A. Bomblies (2004), A see-saw oscillation between the Amazon and Congo basins, Geophys. Res. Lett., 31, L23201, doi:10.1029/2004GL021160. Rodell, M., J. S. Famiglietti, J. Chen, S. I. Seneviratne, P. Viterbo, S. Holl, and C. R. Wilson (2004), Basin scale estimates of evapotranspiration using GRACE and other observations, Geophys. Res. Lett., 31, L20504, doi:10.1029/2004GL020873. Swenson, S., and J. Wahr (2002), Estimated effects of the vertical structure of atmospheric mass on the time-variable geoid, J. Geophys. Res., 107(B9), 2194, doi:10.1029/2000JB000024. Syed, T. H., J. S. Famiglietti, J. Chen, M. Rodell, S. I. Seneviratne, P. Viterbo, and C. R. Wilson (2005), Total basin discharge for the Amazon and Mississippi River basins from GRACE and a land-atmosphere water balance, Geophys. Res. Lett., 32, L24404, doi:10.1029/2005GL024851. Tamisiea, M. E., E. W. Leuliette, J. L. Davis, and J. X. Mitrovica (2005), Constraining hydrological and cryospheric mass flux in southeastern Alaska using space-based gravity measurements, Geophys. Res. Lett., 32, L20501, doi:10.1029/2005GL023961. Tapley, B. D., et al. (2004), GRACE measurements of mass variability in the Earth system, Science, 305, 503 – 505. Velicogna, I., and J. Wahr (2005), Greenland mass balance from GRACE, Geophys. Res. Lett., 32, L18505, doi:10.1029/2005GL023955. Velicogna, I., and J. Wahr (2006), Measurements of time-variable gravity show mass loss in Antarctica, Science, 311, 1754 – 1756, doi:10.1126/ science.1123785. Wahr, J., S. Swenson, V. Zlotnicki, and I. Velicogna (2004), Time-variable gravity from GRACE: First results, Geophys. Res. Lett., 31, L11501, doi:10.1029/2004GL019779. Wahr, J., S. Swenson, and I. Velicogna (2006), Accuracy of GRACE mass estimates, Geophys. Res. Lett., 33, L06401, doi:10.1029/2005GL025305.
%%%%%%%%%%%%%%%%%%%%%%
J. L. Davis and M. E. Tamisiea, Harvard-Smithsonian Center for Astrophysics, 60 Garden Street MS 42, Cambridge, MA 02138, USA. R. C. Bailey, J. W. Crowley, and J. X. Mitrovica, Department of Physics, University of Toronto, 60 St. George Street, Toronto, ON, Canada M5S 1A7. (
[email protected])
4 of 4