4164
IEEE TRANSACTIONS ON GEOSCIENCE AND REMOTE SENSING, VOL. 48, NO. 12, DECEMBER 2010
Landslide Susceptibility Mapping by Neuro-Fuzzy Approach in a Landslide-Prone Area (Cameron Highlands, Malaysia) Biswajeet Pradhan, Ebru Akcapinar Sezer, Candan Gokceoglu, and Manfred F. Buchroithner
Abstract—This paper presents the results of the neuro-fuzzy model using remote-sensing data and geographic information system for landslide susceptibility analysis in a part of the Cameron Highlands areas in Malaysia. Landslide locations in the study area were identified by interpreting aerial photographs and satellite images, supported by extensive field surveys. Landsat TM satellite imagery was used to map the vegetation index. Maps of the topography, lineaments, Normalized Difference Vegetation Index (NDVI), and land cover were constructed from the spatial data sets. Eight landslide conditioning factors such as altitude, slope gradient, curvature, distance from the drainage, distance from the road, lithology, distance from the faults, and NDVI were extracted from the spatial database. These factors were analyzed using a neuro-fuzzy model adaptive neuro-fuzzy inference system to produce the landslide susceptibility maps. During the model development works, a total of five landslide susceptibility models were constructed. For verification, the results of the analyses were then compared with the field-verified landslide locations. Additionally, the receiver operating characteristic curves for all landslide susceptibility models were drawn, and the area under curve values were calculated. Landslide locations were used to validate the results of the landslide susceptibility map, and the verification results showed a 97% accuracy for model 5, employing all parameters produced in the present study as the landslide conditioning factors. The validation results showed a sufficient agreement between the obtained susceptibility map and the existing data on the landslide areas. Qualitatively, the model yields reasonable results, which can be used for preliminary land-use planning purposes. Index Terms—Adaptive neuro-fuzzy inference system (ANFIS) model, Cameron Highlands, geographic information system (GIS), landslide susceptibility, Malaysia, neuro-fuzzy, remote sensing.
I. I NTRODUCTION
L
ANDSLIDES are one of the recurrent natural hazard problems throughout most of Malaysia. According to local newspaper reports (The Star 2008 and 2009), in 2006–2008 Manuscript received October 17, 2009; revised February 3, 2010 and April 25, 2010. Date of publication July 1, 2010; date of current version November 24, 2010. B. Pradhan and M. F. Buchroithner are with the Faculty of Forestry, Geosciences and Hydrosciences, Institute for Cartography, Dresden University of Technology, 01062 Dresden, Germany (e-mail: Biswajeet.Pradhan@ mailbox.tu-dresden.de;
[email protected];
[email protected]). E. A. Sezer is with the Department of Computer Engineering, Hacettepe University, Ankara 06800, Turkey. C. Gokceoglu is with the Department of Geological Engineering, Hacettepe University, Ankara 06800, Turkey. Color versions of one or more of the figures in this paper are available online at http://ieeexplore.ieee.org. Digital Object Identifier 10.1109/TGRS.2010.2050328
and also in 2009, heavy rainfalls triggered numerous landslides and mudflows along the east coast highways and Cameron Highlands in Peninsular Malaysia, in Sabah (East Malaysia), and in the island state of Penang. The areas that were hit the hardest were those along the Cameron Highlands (in the mountainous state of Pahang in Peninsular Malaysia). These landslides caused millions of dollars of property loss and even led to loss of lives. The extent of the damages could have been minimized if a long-term early warning system predicting the mass movements in the landslide-prone areas was in place. The landslides that occurred along the New Klang Valley Express Highways region in 2003 have alerted the highway authorities and other governmental organizations toward the seriousness of landslide management and prevention. The October 2002 landslide in Kuala Lumpur which completely destroyed a few houses and killed six members of a family is still in the public’s memory. Landslides in Malaysia are mainly triggered by tropical rainfalls causing failure of the rock surface along fracture, joint, and cleavage planes. The lithological units of the country are quite stable, but continuous uncontrolled urbanization leads to deforestation and erosion of the covering soil layers, thus causing serious threats to the slopes. Earthquakes are the major triggers of landslides in mountainous terrain. However, Malaysia is not a seismically active region. In spite of this situation, Malaysia is surrounded by earthquake-prone areas, and there is always the probability of transmitting mild shocks, as experienced recently in the western parts of Peninsular Malaysia in 2006, 2008, and 2009 (The Star 2006, 2008, and 2009). Landslides in Malaysia are triggered mainly by heavy rainfalls. Recently, the Cameron Highlands has faced numerous landslide and mudflow events, and much damage occurred in these areas. However, only a little effort has been made to assess or predict these events, which resulted in serious damages. Through scientific analyses of these landslides, one can assess and predict the landslide-susceptible areas. Therefore, understanding the landslides and preventing them are two of the serious challenges in Malaysia. To achieve this aim, in this paper, landslide susceptibility analyses have been performed based on the definition of Varnes [1] and have been verified in the study area using the adaptive neurofuzzy inference system (ANFIS), because the ANFIS model has not been previously used for landslide susceptibility mapping purposes, although it is a suitable and powerful inference system. The study includes three main stages such as landslide inventory, analyses, and verification studies.
0196-2892/$26.00 © 2010 IEEE
PRADHAN et al.: LANDSLIDE SUSCEPTIBILITY MAPPING BY NEURO-FUZZY APPROACH
II. P REVIOUS W ORKS There have been many studies carried out on landslide susceptibility evaluation using geographic information system (GIS); for example, Guzzetti et al. (1999) summarized many landslide hazard evaluation studies based on geomorphological relationships between landslide types and pattern and based on the morphological, lithological and structural settings [2]. Recently, there have been studies on landslide susceptibility evaluation using GIS, and many of these studies have applied probabilistic models [3]–[6]. One of the statistical models available, which is logistic regression analysis, has also been applied to landslide susceptibility mapping [6]–[15]. Other conventional methods such as the geotechnical model, the change detection, and the safety factor model have been applied in different areas [16]–[19]. Moreover, landslide prediction has also been carried out using satellite remote-sensing data and geospatial data sets. Chang et al. (2007) applied the multisource data fusion approach for landslide classification using generalized positive Boolean functions [19]. As a new approach to landslide susceptibility evaluation using GIS, expert system, fuzzy logic, and artificial neural network models have been applied [20]–[26]. Lee et al. (2007) have assessed landslide susceptibility analysis at Youngin, Korea using frequency ratio, logistic regression, and the ANN model [26]. In a recent paper, Choi et al. (2009) have applied the neural network model in landslide susceptibility mapping and have validated the model using the existing landslide data [27]. They have applied the neural network model at three study areas in Korea and have cross-applied their weight for landslide susceptibility mapping to achieve a reasonable prediction accuracy (81.36%). In the neural network method, Nefeslioglu et al. (2008) showed that ANNs give a more optimistic evaluation of landslide susceptibility than logistic regression analysis [13], whereas Melchiorre et al. (2008) improved the predictive capability and robustness of ANNs by introducing a cluster analysis [28]. Moreover, Kanungo et al. (2006) showed that the landslide susceptibility map that is derived from combined neural and fuzzy weighting procedure is the best among the other weighting techniques [29]. Ermini et al. (2005) compared two neural architectures (probabilistic neural network and multilayered perceptor), obtaining a better prediction with the latter [30]. Also, the temporal hazard was estimated with ANNs via the translation of the state of activity in recurrence time and, hence, probability of occurrence by [31]. Ermini et al. (2005) and Catani et al. (2005) have used unique condition units for the terrain unit’s definition in ANNs analysis [30], [31]. Chen et al. (2009) used genetic algorithms and neural networks for the interpretation of rainfall-induced landslides in Taiwan [32]. Lui et al. (2006) assessed the landslide hazard using ANNs for a specific landslide typology (debris flow) [33], considering the following triggering factors: frequency of flooding, covariance of monthly precipitation, and days with rainfall higher than the critical threshold. Finally, Muthu and Petrou (2007) applied a rule-based expert system for landslide early warning and alert maps using geological and meteorological data in GIS [34], [35]. Previously, not much work has been done on landslide susceptibility and hazard analysis in Malaysia. Pradhan and
4165
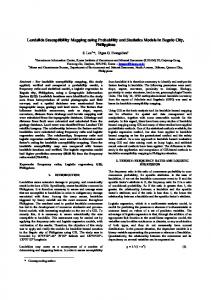
Lee (2007) have performed landslide susceptibility and risk analysis for the Penang Island using a frequency ratio and the logistic regression model [36]. Recently, Pradhan and Lee (2010) have compared three landslide susceptibility maps generated by frequency ratio, multivariate logistic regression, and neural network model for the Penang Island and Selangor area in Malaysia [37]–[42]. In the last few years, landslide susceptibility evaluation using GIS and soft computing techniques such as fuzzy logic, and artificial neural network models have been applied by researchers in different countries [43], [45]. Recently, Pradhan and Lee (2009) have used the ANN model with different training sites for landslide hazard and risk analysis at the Penang Island, Malaysia [46]. The main difference between the present study and the approaches described in the aforementioned publications is that a neuro-fuzzy model was developed and applied for the first time in landslide susceptibility analysis. III. S TUDY A REA In this paper, the Cameron Highlands was selected for the application of landslide susceptibility analysis due to the frequent occurrence of landslides. The study area (Fig. 1) is located in the Cameron Highlands, which is undergoing rapid development, with land clearing for housing estates, hotels, and apartments, resulting in erosion and landslides. The Cameron Highlands is a district in Pahang, which is one of the 13 states of Malaysia. The study area covers an area of 26.7 km2 and is located near the northern central part of Peninsular Malaysia. The district of the Cameron Highlands is located in the eastern flank of the main range, which is composed of granite. However, scattered outliers (roof pendants) of metasediments are also present (Fig. 1). The granite in the Cameron Highlands is classified as megacrystic biotite granite [47], [48]. Cobbing et al. (1992) mentioned that some of the granite and the associated microgranite may contain muscovite and may be mineralized [49]. The metasediments consist of schist, phyllite, slate, and limestone [50]. Minor intercalations of sandstone and volcanics exist as well. The regional geology map of the study area and its surrounding areas are shown in Fig. 1. PostTriassic–Mesozoic granite comprises most of the granite rocks, whereas there are a few patches of metamorphic rocks, mostly composed of Silurian–Ordovician schist, phyllite, limestone, and sandstone. The annual rainfall of the Cameron Highlands, like all tropical hilly regions, is very high, averaging between 2500 and 3000 mm per annum. There are two pronounced wet seasons from September to December and from February to May in each year. The rainfall in the Cameron Highlands peaks between March and May and also from November to December. The highest single-day rainfall that was recorded ranged from 87 to 100 mm. It is during such times that many streams and rivers in the Cameron Highlands may overflow, flooding the surrounding areas, and landslides such as debris flow may occur along the river valleys. The intensity of the rain is another factor that affects the fill slopes, causing severe sheet, rill, and gully erosion. During such times, many of the natural and man-made slopes are marginally stable. The hillslopes are
4166
IEEE TRANSACTIONS ON GEOSCIENCE AND REMOTE SENSING, VOL. 48, NO. 12, DECEMBER 2010
Fig. 1. Location and geological map of the study area and its surroundings (Source: Department of Minerals and Geoscience, Malaysia).
drained by numerous small streams, resulting in deeply incised erosion. Several field observations have been carried out in the month of April/June/September in 2002, 2007, and 2008 for taking ground data and for the verification of the landslide locations and types using GPS survey. IV. DATA P REPARATION A spatial database that is related to landslide susceptibility modeling (Table I) has been acquired for the Cameron Highlands. This database includes maps, images, tabular data, vectors, and rasters from different data custodians. These data were in different formats, scales, accuracies, and geometries and were almost unusable for direct application to this research.
For this reason, these data were converted into appropriate data input for analysis and neuro-fuzzy modeling. Eight landslide conditioning factors were identified based on the previous paper published by Pradhan and Lee (2010). In the studied area, it is also observed that most of the landslides have taken place immediately after a heavy rainfall [51]. Hence, rainfall is considered as the triggering factor. Landslide susceptibility maps only include the preparatory or conditioning factors because these maps show the landslide susceptibility zones. To obtain a landslide hazard map, the return periods of the triggering factors such as heavy rainfall or earthquake should be considered. For this reason, the precipitation map is not considered in this analysis. The GIS and remote-sensing data that were used in the present study were shown in Table I. Remote-sensing methods were used to obtain the historical
PRADHAN et al.: LANDSLIDE SUSCEPTIBILITY MAPPING BY NEURO-FUZZY APPROACH
4167
TABLE I L IST AND S OURCE OF THE DATA U SED IN T HIS S TUDY
TABLE II L IST OF S ATELLITE DATA U SED IN T HIS S TUDY
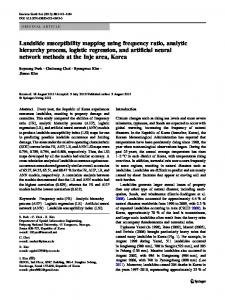
Fig. 2. Landslide inventory map compiled in this paper.
records of the landslides. Archived 1:10 000–1:50 000 aerial photographs, SPOT 5 panchromatic satellite image, IKONOS, RADARSAT, and landslide reports over the past 21 years were used for the visual detection of landslide occurrences in the study area. These aerial photographs were taken during the period of 1981–2002 and were acquired by the Malaysian Center for Remote Sensing. The satellite data that were used in this paper are listed in Table II. In addition, all historical landslide reports, newspaper records, and archived data have been assembled for the period under examination. The source material varies in quality with respect to the precise location of the landslide event. Based on the site description, archived database, and aerial photo interpretation, the locations of the individual landslides were drawn on 1:25 000 maps, and the location was plotted as close as possible. Field observations were used to confirm the fresh landslide locations (scars) and types. In the aerial photographs and high-resolution satellite images, historical landslides could be observed as breaks in the forest canopy, bare soil, or geomorphological features, like head- and side scarps, flow tracks, and soil- and debris deposits below a scar. These landslides were then classified and sorted out based on their modes of occurrence. The landslide inventory map was very helpful in understanding different triggering factors that control different slope movement types. Most of the landslides are shallow rotational, and there are a few translational and flow types. However, during the analyses that were performed in the present study, only the rotational failures are considered, and the other types of failures were eliminated because the occurrence of the other types of failures is rare and ignorable. Also, a few landslides that occurred in slightly inclined areas
were not considered and thus were eliminated in the analysis. Consequently, the susceptibility maps that are produced in this paper are valid for the shallow rotational failures. To assemble a database to assess the surface area and number of landslides in the study area, a total of 70 shallow rotational failures were mapped in the study area having a 0.5091-km2 surface area. The landslide inventory map that was compiled in the present study is shown in Fig. 2. In order to develop a method for the assessment of landslide susceptibility, determination of the conditioning factors for the landslides is crucial [45]. In this paper, there were a total of eight landslide conditioning factors that were considered in the analyses performed. The basic landslide conditioning factors such as altitude, slope gradient, lithology, distance from the drainage, distance from the faults, and plan curvature were employed. As a result of the field observations, it was observed that the landslides have a close relation with the distance from the roads. For this reason, the distance to the road was considered as a landslide conditioning factor for the study area, in addition to the basic landslide conditioning factors. The landuse and/or land-cover parameter has been used generally when producing landslide susceptibility maps. In this paper, the Normalized Difference Vegetation Index (NDVI) was considered as a landslide conditioning parameter in order to characterize the land-cover characteristics of the study area. Particularly, the land-cover characteristics have a crucial importance on the occurrence of the shallow landslides. All of the factors that were employed in this paper were transformed into a vector-type spatial database using the GIS (Fig. 3). For the digital elevation model (DEM) creation, 10-m interval contours and survey base points showing the elevation values were extracted from the 1:25 000-scale topographic maps. This is used to generate the DEM with 10-m pixel size and triangulated irregular network from which the altitude, slope gradient, and plan curvature are derived [Fig. 3(a)–(c)]. In the present study, a substantial
4168
IEEE TRANSACTIONS ON GEOSCIENCE AND REMOTE SENSING, VOL. 48, NO. 12, DECEMBER 2010
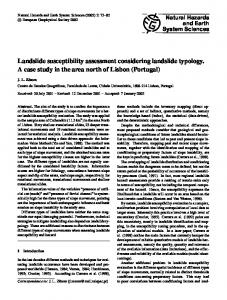
Fig. 3. Maps of the input data layers. (a) Altitude. (b) Slope gradient. (c) Plan curvature. (d) Distance from the drainage. (e) Lithology. (f) Distance from the faults.
attention has been given for slope conditions because there is a physical relation between landslide occurrence and slope gradient. An increase in slope gradient results in an increase
of the driving forces. For this reason, slope configuration and steepness play an important role on the susceptibility of a slope to landsliding. This makes slope as an important factor
PRADHAN et al.: LANDSLIDE SUSCEPTIBILITY MAPPING BY NEURO-FUZZY APPROACH
4169
Fig. 3. (Continued.) Maps of the input data layers. (g) Distance from the road. (h) NDVI.
in preparing the landslide susceptibility map. The slope map was reclassified into four classes, following the standard classification scheme set by the Ministry of Science, Technology and Environment of Malaysia for hill land: 1) < 15◦ ; 2) 16◦ –25◦ ; 3) 26◦ –35◦ ; and 4) > 35◦ [Fig. 3(b)]. Another reason for classifying slope is that this classification categorizes the slope angles greater than 35◦ in a single group, which is an advantage in this particular study area as the studied area has only 3.04% of the total area under the very high slope category. Further breaking up of the slope into smaller classes shows a very minimal area or breaks in the subcategory. Similarly, the very gentle slope category also aggregates the area under the less slope angle of 15◦ . This forms the largest category, with an area of 11.42 km2 , i.e., 42.77% of the total area under study. Furthermore, dividing the slope into smaller categories deprives the significance of the higher elevation on which the very gentle slope is situated. The term curvature is generally defined as the curvature of a line formed by the intersection of a random plane with the terrain surface [52]. The influence of plan curvature on the land degradation processes is the convergence or divergence of water during downhill flow. In addition, this parameter constitutes one of the main factors controlling the geometry of the terrain surface where landslides occur [53]. In the case of the curvature, negative curvatures represent a concave surface, zero curvature represents a flat surface, and positive curvatures represent a convex surface. The plan curvature map was prepared using the avenue routine in ArcView 3.2 [Fig. 3(c)]. Proximity to the drainage pattern was an important factor in the evaluation of landslide susceptibility, as streams could adversely affect the stability by either eroding the toe or saturating the slope or both [14]. However, there is no a consensus on which buffer interval should be used in such kind of studies [13]. For this reason, various authors [10], [13], [14], [29], [45] have considered different approaches. The distance from the drainage was calculated using the topographic database.
The drainage buffer was calculated at 50-m intervals, as shown in Fig. 3(d). The inclusion of the drainage channels in the susceptibility map is useful in delineating probable travel paths down the slope from susceptible initiation areas [54]. It can be found that, as the distance from the drainage lines increases, landslide frequency generally decreases. This can be attributed to the fact that terrain modification caused by gully erosion may influence the initiation of landslides. There are many second-order streams in the studied area, and they discharge directly to the main river, which is in the north eastern part of the Cameron Highlands (not part of the studied area). The buffer settings (50 m) are assigned depending on the distance between the crest of the landslides related with the drainage network [45]. Lithology and structure of the area play a major role in determining the sites of failure. Secondary weaknesses that are observed in these rocks make these more susceptible to sliding because of material weakening, stress accumulation, or tectonic activity in different distances [45]. Lithology is one of the most important factors controlling landslides [55]. The lithology map was prepared from a 1:63 300-scale geological map [Fig. 3(e)], and the distance from the fault was calculated based on the Euclidean distance method in ArcGIS 9.0 [Fig. 3(f)]. Lineaments and faults are zones of weakness, which are prone to instability. Faults form a line or zone of weakness characterized by fractured rocks. Proximity (buffers) to these structures increases the likelihood of the occurrence of landslides. Selective erosion and movement of water along fault lines/planes promote such phenomena. In the study area, the major fault lines are in the NE–SW, NW–SE, and E–W directions, although a slight relationship between the landslide distribution and fault location is observed [Fig. 3(f)]. Roadcuts are usually sites of anthropological instability. A given road segment may act as a barrier, a net source, a net sink, or a corridor for water flow, depending on its location in the area [38]. It usually serves as a source of landslides. The
4170
IEEE TRANSACTIONS ON GEOSCIENCE AND REMOTE SENSING, VOL. 48, NO. 12, DECEMBER 2010
road map is derived from the topography map. From the field observation, it has been noticed that most of the landslides have occurred along the cut-slopes and roads. The distance to the road buffer is selected based on the occurrence of landslides to the proximity of the road. Therefore, a 50-m buffer zone is selected in the studied area [Fig. 3(g)]. The shallow landslides are affected by the land-cover characteristics. However, there is no detailed and reliable vegetation map of the study area. For this reason, the NDVI map was generated from the SPOT 5 scene of the January 2005 (2.5-m spatial resolution) satellite image [Fig. 3(h)] to characterize the vegetation characteristics of the study area. The NDVI value was calculated using the formula N DV I = (IR − R)/(IR + R), where IR is the energy reflected in the infrared portion of the electromagnetic spectrum and R is the energy reflected in the red portion of the electromagnetic spectrum. The NDVI is useful in delineating vegetation. Fig. 4 shows the flowchart for the landslide susceptibility analysis and spatial data flow diagram. All of the landslide conditioning factors were converted to a raster grid with 10 m × 10 m cells with 440 rows by 607 columns for the application of the neuro-fuzzy model. GIS ArcGIS 9.0 version software package was used as the basic analysis tools for spatial management and data manipulation. V. L ANDSLIDE S USCEPTIBILITY M APPING U SING THE N EURO -F UZZY M ODEL Although some soft computing techniques such as fuzzy modeling and artificial neural networks have been used to produce landslide susceptibility maps, the neuro-fuzzy modeling, which is one of the soft computing techniques, has not previously been employed for such purpose. A neurofuzzy system is, in fact, a neural network that is functionally equivalent to the fuzzy inference model. It can be trained to develop IF-THEN fuzzy rules and to determine membership functions for input and output variables of the system [56]. One of the neuro-fuzzy inference systems is ANFIS. The Sugeno model was proposed for a systematic approach in generating fuzzy rules from a given input–output data set [56]. An ANFIS model uses a hybrid learning algorithm that combines the least squares estimator and the gradient descent method. In the ANFIS training algorithm, each epoch is composed of forward and backward passes. In the forward pass, a training set of input patterns is presented to the ANFIS, neuron outputs are calculated on the layer-by-layer basis, and rule consequent parameters are identified by the least squares estimator. In the Sugeno style fuzzy inference, an output y is a linear function [56]. In the present study, a total of five ANFIS models were constructed to determine the landslide susceptibility degrees of each pixel, and the flowchart of the applied methodology is shown in Fig. 4. As shown in Fig. 4, the input data files (altitude, slope gradient, lithology, distance from the drainage, distance from the road, distance from the faults, plan curvature, and NDVI) and the landslide inventory data were extracted from ArcGIS separately. In the second stage, these separate data files were combined, as required by the MATLAB Software for each
Fig. 4. Flowchart showing the landslide susceptibility analyses and spatial data flow.
models. The input parameters of each ANFIS model were given in Table III. Considering these inputs, for each ANFIS model, the data matrices were prepared automatically by using a computer program developed by ANSI C programming language. In this stage, two types of data matrices for each model were prepared. One of them includes all of the inputs and outputs, while the other contains only all of the inputs. The data matrix that includes the output was used for the selection of the train data set, while the data matrix that includes only the inputs was used for model simulation after model train. As shown in Fig. 5, showing the membership function of model 5 after training, the number of membership functions of each input was determined. When determining the number of membership functions, two basic assumptions were considered. The number of membership functions should represent physically each input
PRADHAN et al.: LANDSLIDE SUSCEPTIBILITY MAPPING BY NEURO-FUZZY APPROACH
4171
TABLE III I NPUT PARAMETERS AND THE N UMBER OF M EMBERSHIP F UNCTIONS U SED IN THE ANFIS M ODELS
and minimum. If the number of membership functions is high, the number of “if-then” rules would be very high, and hence, the overlearning may exist. Moreover, the model would loss its calculation efficiency. Another important issue in the training of ANFIS is how to preserve the human-plausible features such as bell-shaped membership functions, completeness or sufficient overlapping between adjacent membership functions, minimal uncertainty, etc. [57]–[59]. As shown in Fig. 5, a minimum of 50% overlapping was employed to minimize uncertainty. Finally, lithology, distance from the drainage, distance from the faults, and plan curvature have two bell-shaped membership functions, while altitude, slope gradient, distance from the road, and NDVI contain three bell-shaped membership functions. Depending on the number of membership functions of each input, the numbers of the “if-then” rules vary between 54 (model 1) and 1296 (model 5). The general structure of ANFIS model 1 was shown in Fig. 6. The study area is formed by 267 074 pixels, while a total of 5091 pixels include landslide. A total of 2500 pixels were selected from the pixels that include landslides, while 2500 pixels were selected from the pixels that are free from landslides. Consequently, a total of 5000 pixels were selected randomly as the train data set. Each train data set includes the pixels having landslides and the pixels without landslides equally. After constructing the Sugeno fuzzy inference models, each model was trained by considering 350 epochs. After the training stage, the second data matrices of each model were employed for simulation
Fig. 5. Membership functions of the inputs.
by using a MATLAB script written in this paper. In this stage, a whole data set was used to simulate the model. The output data that were obtained from MATLAB were converted
4172
IEEE TRANSACTIONS ON GEOSCIENCE AND REMOTE SENSING, VOL. 48, NO. 12, DECEMBER 2010
Fig. 6. General structure of ANFIS model 1 as an example.
to ArcGIS data format automatically using another computer program developed by ANSI C programming language. Finally, the landslide susceptibility maps were produced by employing ArcGIS [Fig. 7(a)–(e)]. VI. VALIDATION OF THE S USCEPTIBILITY M AP A. ROC Plot For the effective comparison of the ANFIS-derived landslide susceptibility maps, all of the five models were evaluated by comparing them separately with the landslide testing data.
Therefore, five landslide susceptibility maps (ANFIS-derived five models) were validated against the existing landslide data set, and they are shown in Fig. 8. Spatial effectiveness of these five susceptibility maps was checked by receiver operating characteristics (ROC). The ROC curve is a useful method of representing the quality of deterministic and probabilistic detection and forecast systems [60]. The area under the ROC curve (AUC) characterizes the quality of a forecast system by describing the system’s ability to anticipate correctly the occurrence or nonoccurrence of predefined “events” [57]. The ROC curve plots the false positive rate on the X-axis and
PRADHAN et al.: LANDSLIDE SUSCEPTIBILITY MAPPING BY NEURO-FUZZY APPROACH
Fig. 7.
4173
Landslide susceptibility maps obtained from the ANFIS modeling. (a) Model 1. (b) Model 2. (c) Model 3. (d) Model 4. (e) Model 5.
1—the false negative rate on the Y -axis. It shows the tradeoff between the two rates [61]. To obtain the relative ranks for each prediction pattern, the calculated index values of all pixels in
the study area were sorted in descending order. If the AUC is close to one, the result of the test is excellent. On the contrary, the closer the AUC is to 0.5, the fairer is the result of the test.
4174
IEEE TRANSACTIONS ON GEOSCIENCE AND REMOTE SENSING, VOL. 48, NO. 12, DECEMBER 2010
Fig. 9. Frequency ratio plots of various landslide zones derived from the ANFIS models.
Fig. 8. ROC plots for the susceptibility maps produced in this paper.
The results of the ROC curve test are shown in Fig. 8. These curves indicate that model 5 (Fig. 8) has a higher prediction performance than the other models. The ROC plot assessment results show that, in the susceptibility map using model 5, the AUC was 0.9765 and that the prediction accuracy was 98%. In the susceptibility map using model 1, the AUC was 0.8208, and the prediction accuracy was 82%. The susceptibility maps produced using models 2 and 3 show 86.68% and 86.71%, respectively. This indicates that the inclusion of the condition factor “distance from the fault” in model 3 did not increase the prediction accuracy of model 2. Similarly, in the case of model 4, the susceptibility map shows a higher prediction accuracy (94%) than models 3, 2, and 1. This shows that the case of models 4–5 is higher than the case of models 1–3. Therefore, from the prediction accuracy graphs (Fig. 8), it is quite evident that the susceptibility map with models 4 and 5 shows a higher prediction accuracy of >93%, whereas the case of model 1 shows a least prediction accuracy of 82%. It is also important to note that the inclusion of the conditioning factor “NDVI” increased the prediction accuracy of model 5 by 4% (97%–93%). Therefore, one can conclude here that the selection of parameters has an impact on the accuracy of the landslide susceptibility analysis, as the results with altitude, slope gradient, plan curvature, distance from the drainage, distance from the road, lithology, plan curvature, and NDVI were the most suitable parameters for landslide susceptibility of the study area. Additionally, it is possible to say that distance from the fault has an ignorable influence on landslide occurrence in the study area, although it has been used commonly for this purpose. B. Comparison of LSI Classification With the Landslide Data The landslide susceptibility values produced from ANFIS model are shown in Fig. 9. The landslide susceptibility maps that were produced due to the application of neuro-fuzzy model were verified and compared with the aid of existing landslide test data set. The range of landslide susceptibility mapping (LSI) values is different in five susceptibility models considered in this paper, so the index value needs to set the same
interval for the comparison. The indexes were classified into five classes (highest 10%, second 10%, third 20%, fourth 20%, and remaining 40%) based on the area for visual and easy interpretation. Relative frequency ratio analysis was performed on the classification results and landslide location data [38]. The landslide test locations were overlaid on the LSI classification obtained from the five models ran in ANFIS. In the overlaid images, the boundary of each existing landslide location encloses a number of pixels allocated to ANFIS-derived landslide susceptibility zones. The total areas and their percentages covered by various landslide susceptibility zones within the boundary of each existing test landslides were determined. Similarly, the total area, with their percentages occupied by various landslide susceptibility zones, in the whole image was also determined. Relative frequencies of areas affected by different landslide susceptibility zones were calculated from the ratio. Ideally, the frequency ratio value should increase from a very low susceptible zone to a very high susceptible zone, since the highest landslide susceptible zones are generally more prone to landslides than other zones. In plotting these frequency ratio values (Fig. 9), it can be seen that there is a gradual and smooth increase in the frequency from the no susceptible zone to the very high susceptible zone in five susceptibility maps computed by ANFIS models, except model 1. As expected, the case of models 2 and 3 gives a similar pattern, whereas the case of model 1 gives an unusual pattern of the susceptibility zones. From the frequency ratio plots, it can be clearly seen that model 5 gives the better separation of zones than model 4. From this observation, we concluded that model 5 performs comparatively better than the other models and that a number of locations having high output values have been mapped more accurately in the very high susceptibility zones. In addition, model 5 distinguished the LSIs more widely than model 4 as expected since the ROC plot shows a higher area under curve than the later by 4%. The higher prediction accuracy in very high susceptibility zones in model 5 is attributed to the contribution of NDVI, which plays an important role during the training of the ANFIS. This means that the landslide probability increases with the presence of all of the eight landside conditioning factors in model 5. Therefore, considering the correct classifications as shown in Fig. 9, the prediction capacity of model 5 is slightly higher than that of the other models. Taking all of the analyses into consideration, it may be concluded that the most appropriate
PRADHAN et al.: LANDSLIDE SUSCEPTIBILITY MAPPING BY NEURO-FUZZY APPROACH
landslide susceptibility map for the study area is obtained by using model 5 [Fig. 7(e)], which has been obtained through the use of eight parameters such as the following: altitude, slope gradient, lithology, distance to the drainage, distance from the road, distance from the faults, plan curvature, and NDVI. VII. C ONCLUSION AND D ISCUSSION In the present study, a regional landslide susceptibility assessment was performed in a landslide-prone area (a part of Cameron Highlands, Malaysia). The study included three main stages such as landslide inventory, susceptibility analyses, and verification. The study area has a frequent landslide problem due to its mountainous character and heavy rainfall. In the first stage of the study, an extensive landslide inventory mapping study was performed because a reliable landslide inventory map is necessary for all indirect landslide susceptibility evaluations. For this purpose, a landslide inventory database that is used to assess the landslide susceptibility of the study area, with a total of 70 landslides, was mapped in the study area. In the second stage, the landslide conditioning factors were determined, and these were prepared for the landslide susceptibility assessment. During the analysis stage, a total of five ANFIS models were constructed. Model 1 included only the altitude, slope gradient, lithology, and distance from the road as the inputs, while model 5 was formed by employing the altitude, slope gradient, plan curvature, distance from the drainage, distance from the road, lithology, distance from the fault, and NDVI as the inputs. Since this study is a methodological attempt, the study area is selected as small as possible. In the selected study area, only two lithologies are cropped out without a simplification. Additionally, all faults, drainage lines, and roads in the study area are considered completely. It is possible to increase the number of membership functions, but this can result in overlearning of the models developed. To cope with this problem, the number of membership functions is considered optimally. In fact, this is not a simplification. Due to the nature of the membership functions, all intervals are considered completely. When considering the AUC values, it is evident that all ANFIS models exhibited high performances because the AUC values of the models varied between 0.8208 (model 1) and 0.9765 (model 5). This was mainly sourced from the very high prediction capacity of the ANFIS modeling. Also, the effects of the parameters used in the models were observed clearly. However, when assessing the performances of the landslide susceptibility maps, considering only the AUC values may not be sufficient because highly conservative maps may give some very high AUC values. For this reason, in addition to the AUC values, a relative frequency ratio analysis was applied on the classification results of the landslide susceptibility maps produced in the present study and landslide location data. The results of the frequency ratio analyses showed that there is a gradual and smooth increase in the frequency from the no susceptible zone to the very high susceptible zone in five susceptibility maps obtained from the ANFIS models constructed in the study. As expected, models 2 and 3 exhibited almost similar pattern, while model 5 yielded the higher separation of the susceptibility zones. When considering this observation, it can
4175
be concluded that model 5 performed comparatively better than the other models and that a number of locations having high output values have been mapped more accurately in the very high susceptibility zones. The higher prediction accuracy in very high susceptibility zones in model 5 is attributed to the contribution of all of the eight factors playing important roles during the training of the ANFIS. In other words, the landslide probability varies depending on the presence of the vegetation index value (NDVI) and shape of the slopes characterized by plan curvature in model 5. As a final conclusion, the results obtained from the study showed that the ANFIS modeling is a very useful and powerful tool for the regional landslide susceptibility assessments. To prevent overlearning, the number of membership functions of the inputs and the number of training epochs should be selected optimally and carefully. Also, when selecting the number of the membership functions of the inputs, the physical meanings of the inputs should be considered by an expert. Therefore, the results that are to be obtained from the ANFIS modeling should be assessed carefully because the overlearning may cause misleading results. As a final recommendation, the results obtained in this paper showed that the methods followed in the present study exhibits a high performance. However, it is not forgotten that the performance of such type maps depends not only on the methodology followed but also on the quality of the available data. For this reason, if the quality of the data increases, the performance of the maps produced by the neurofuzzy approach could increase. ACKNOWLEDGMENT The authors would like to thank the Malaysian Center for Remote Sensing and the National Mapping Agency, Malaysia, for providing the various data sets used in this paper, the two anonymous reviewers for their very helpful reviews, and C. Ruf for the editorial comments. B. Pradhan would like to thank the Alexander von Humboldt Foundation (AvH), Germany, for awarding the Visiting Scientist position at the Dresden University of Technology, Dresden, Germany. R EFERENCES [1] D. J. Varnes, “IAEG Commission on Landslides: Landslide hazard zonation—A review of principles and practice,” UNESCO, Paris, France, 1984. [2] F. Guzzetti, A. Carrarra, M. Cardinali, and P. Reichenbach, “Landslide hazard evaluation: A review of current techniques and their application in a multi-scale study, Central Italy,” Geomorphology, vol. 31, no. 1–4, pp. 181–216, Dec. 1999. [3] S. Lee and M. J. Lee, “Detecting landslide location using KOMPSAT 1 and its application to landslide-susceptibility mapping at the Gangneung area, Korea,” Adv. Space Res., vol. 38, no. 10, pp. 2261–2271, 2006. [4] B. Pradhan, R. P. Singh, and M. F. Buchroithner, “Estimation of stress and its use in evaluation of landslide prone regions using remote sensing data,” Adv. Space Res., vol. 37, no. 4, pp. 698–709, 2006. [5] S. Lee and B. Pradhan, “Probabilistic landslide risk mapping at Penang Island, Malaysia,” J. Earth Syst. Sci., vol. 115, no. 6, pp. 661–672, Dec. 2006. [6] S. Lee and B. Pradhan, “Landslide hazard mapping at Selangor, Malaysia using frequency ratio and logistic regression models,” Landslides, vol. 4, no. 1, pp. 33–41, Mar. 2007. [7] A. Akgün, S. Dag, and F. Bulut, “Landslide susceptibility mapping for a landslide-prone area (Findikli, NE of Turkey) by likelihood-frequency ratio and weighted linear combination models,” Environ. Geol., vol. 54, no. 6, pp. 1127–1143, May 2008.
4176
IEEE TRANSACTIONS ON GEOSCIENCE AND REMOTE SENSING, VOL. 48, NO. 12, DECEMBER 2010
[8] M. C. Tunusluoglu, C. Gokceoglu, H. A. Nefeslioglu, and H. Sonmez, “Extraction of potential debris source areas by logistic regression technique: A case study from Barla, Besparmak and Kapi mountains (NW Taurids, Turkey),” Environ. Geol., vol. 54, no. 1, pp. 9–22, Mar. 2008. [9] T. Can, H. A. Nefeslioglu, C. Gokceoglu, H. Sonmez, and T. Y. Duman, “Susceptibility assessments of shallow earthflows triggered by heavy rainfall at three subcatchments by logistic regression analyses,” Geomorphology, vol. 72, no. 1–4, pp. 250–271, 2005. [10] S. Lee, “Application of logistic regression model and its validation for landslide susceptibility mapping using GIS and remote sensing data,” Int. J. Remote Sens., vol. 26, no. 7, pp. 1477–1491, Apr. 2005. [11] B. Pradhan, S. Lee, S. Mansor, M. F. Buchroithner, N. Jallaluddin, and Z. Khujaimah, “Utilization of optical remote sensing data and geographic information system tools for regional landslide hazard analysis by using binomial logistic regression model,” Appl. Remote Sens., vol. 2, no. 1, pp. 1–11, Oct. 2008. [12] T. Gorum, B. Gonencgil, C. Gokceoglu, and H. A. Nefeslioglu, “Implementation of reconstructed geomorphologic units in landslide susceptibility mapping: The Melen Gorge (NW Turkey),” Nat. Hazards, vol. 46, no. 3, pp. 323–351, Sep. 2008. [13] H. A. Nefeslioglu, C. Gokceoglu, and H. Sonmez, “An assessment on the use of logistic regression and artificial neural networks with different sampling strategies for the preparation of landslide susceptibility maps,” Eng. Geol., vol. 97, no. 3/4, pp. 171–191, Apr. 2008. [14] C. Gokceoglu and H. Aksoy, “Landslide susceptibility mapping of the slopes in the residual soils of the Mengen region (Turkey) by deterministic stability analyses and image processing techniques,” Eng. Geol., vol. 44, no. 1–4, pp. 147–161, Oct. 1996. [15] C. Gokceoglu, H. Sonmez, and M. Ercanoglu, “Discontinuity controlled probabilistic slope failure risk maps of the Altindag (settlement) region in Turkey,” Eng. Geol., vol. 55, no. 4, pp. 277–296, Mar. 2000. [16] G. Zhou, T. Esaki, Y. Mitani, M. Xie, and J. Mori, “Spatial probabilistic modeling of slope failure using an integrated GIS Monte Carlo simulation approach,” Eng. Geol., vol. 68, no. 3/4, pp. 373–386, Mar. 2003. [17] A. M. Youssef, B. Pradhan, A. F. D. Gaber, and M. F. Buchroithner, “Geomorphological hazard analysis along the Egyptian red sea coast between Safaga and Quseir,” Nat. Hazards Earth Syst. Sci., vol. 9, no. 3, pp. 751–766, 2009. [18] C. Tarantino, P. Blonda, and G. Pasquariello, “Application of change detection techniques for monitoring man-induced landslide causal factors,” in Proc. IEEE Int. Geosci. Remote Sens. Symp., 2004, vol. 2, pp. 1103–1106. [19] Y. L. Chang, L. S. Liang, C. C. Han, J. P. Phang, W. I. Liang, and K. S. Chen, “Multisource data fusion for landslide classification using generalized positive Boolean functions,” IEEE Trans. Geosci. Remote Sens., vol. 45, no. 6, pp. 1697–1708, Jun. 2007. [20] M. Ercanoglu and C. Gokceoglu, “Assessment of landslide susceptibility for a landslide-prone area (North of Yenice, NW Turkey) by fuzzy approach,” Environ. Geol., vol. 41, pp. 720–730, 2002. [21] S. Lee, J. H. Ryu, K. Min, and J. S. Won, “Landslide susceptibility analysis using GIS and artificial neural network,” Earth Surface Process. Landforms, vol. 27, pp. 1361–1376, 2003. [22] S. Lee, J. H. Ryu, J. S. Won, and H. J. Park, “Determination and application of the weights for landslide susceptibility mapping using an artificial neural network,” Eng. Geol., vol. 71, no. 3/4, pp. 289–302, Feb. 2004. [23] S. Lee, “Application and verification of fuzzy algebraic operators to landslide susceptibility mapping,” Environ. Geol., vol. 52, no. 4, pp. 615–623, Apr. 2007. [24] B. Pradhan, S. Lee, and M. F. Buchroithner, “Use of geospatial data for the development of fuzzy algebraic operators to landslide hazard mapping: A case study in Malaysia,” Appl. Geomat., vol. 1, pp. 3–15, 2009. [25] Y. Hong, R. F. Adler, and G. Huffman, “An experimental global prediction system for rainfall-triggered landslides using satellite remote sensing and geospatial datasets,” IEEE Trans. Geosci. Remote Sens., vol. 45, no. 6, pp. 1671–1680, Jun. 2007. [26] S. Lee, J. H. Ryu, and I. S. Kim, “Landslide susceptibility analysis and its verification using likelihood ratio, logistic regression, and artificial neural network models: Case study of Youngin, Korea,” Landslides, vol. 4, no. 4, pp. 327–338, Dec. 2007. [27] J. Choi, H. J. Oh, J. S. Won, and S. Lee, “Validation of an artificial neural network model for landslide susceptibility mapping,” Environ. Earth Sci. (Online First), vol. 60, no. 3, pp. 473–483, Apr. 2010. [28] C. Melchiorre, M. Matteucci, A. Azzoni, and A. Zanchi, “Artificial neural networks and cluster analysis in landslide susceptibility zonation,” Geomorphology, vol. 94, no. 3/4, pp. 379–400, Feb. 2008. [29] D. P. Kanungo, M. K. Arora, S. Sarkar, and R. P. Gupta, “A comparative study of conventional, ANN black box, fuzzy and combined
[30] [31] [32]
[33] [34] [35] [36]
[37]
[38]
[39]
[40]
[41]
[42]
[43]
[44] [45] [46] [47] [48]
[49] [50]
neural and fuzzy weighting procedures for landslide susceptibility zonation in Darjeeling Himalayas,” Eng. Geol., vol. 85, no. 3/4, pp. 347–366, Jun. 2006. L. Ermini, F. Catani, and N. Casagli, “Artificial neural networks applied to landslide susceptibility assessment,” Geomorphology, vol. 66, no. 1–4, pp. 327–343, Mar. 2005. F. Catani, N. Casagli, L. Ermini, G. Righini, and G. Menduni, “Landslide hazard and risk mapping at catchment scale in the Arno River basin,” Landslides, vol. 2, no. 4, pp. 329–342, Dec. 2005. Y. R. Chen, J. W. Chen, S. C. Hsieh, and P. N. Ni, “The application of remote sensing technology to the interpretation of land use for rainfallinduced landslides based on genetic algorithms and artificial neural networks,” IEEE J. Sel. Topics Appl. Earth Obs. Remote Sens., vol. 2, no. 2, pp. 87–95, Jun. 2009. Y. Lui, H. C. Guo, R. Zou, and L. J. Wang, “Neural network modelling for regional hazard assessment of debris flow in Lake Qionghai Watershed, China,” Environ. Geol., vol. 49, no. 7, pp. 968–976, Apr. 2006. K. Muthu and M. Petrou, “Landslide-hazard mapping using an expert system and a GIS,” IEEE Trans. Geosci. Remote Sens., vol. 45, no. 2, pp. 522–531, Feb. 2007. K. Muthu, M. Petrou, C. Tarantino, and P. Blonda, “Landslide possibility mapping using fuzzy approaches,” IEEE Trans. Geosci. Remote Sens., vol. 46, no. 4, pp. 1253–1265, Apr. 2008. B. Pradhan and S. Lee, “Utilization of optical remote sensing data and GIS tools for regional landslide hazard analysis by using an artificial neural network model,” Earth Sci. Frontier, vol. 14, no. 6, pp. 143–152, Nov. 2007. B. Pradhan and S. Lee, “Delineation of landslide hazard areas on Penang Island, Malaysia, by using frequency ratio, logistic regression, and artificial neural network models,” Environ. Earth Sci., vol. 60, no. 5, pp. 1037–1054, May 2010. B. Pradhan and S. Lee, “Landslide susceptibility assessment and factor effect analysis: Backpropagation artificial neural networks and their comparison with frequency ratio and bivariate logistic regression modelling,” Environ. Model. Softw., vol. 25, no. 6, pp. 747–759, Jun. 2010. B. Pradhan, “Remote sensing and GIS-based landslide hazard analysis and cross-validation using multivariate logistic regression model on three test areas in Malaysia,” Adv. Space Res., vol. 45, no. 10, pp. 1244–1256, May 2010. B. Pradhan, S. Lee, and M. F. Buchroithner, “A GIS-based backpropagation neural network model and its cross-application and validation for landslide susceptibility analyses,” Comput. Environ. Urban Syst., vol. 34, no. 3, pp. 216–235, May 2010. B. Pradhan, S. Lee, and M. F. Buchroithner, “Remote sensing and GISbased landslide susceptibility analysis and its cross-validation in three test areas using a frequency ratio model,” Photogrammetrie, Fernerkundung, GeoInformation, vol. 1, pp. 17–32, 2010. B. Pradhan and A. M. Youssef, “Manifestation of remote sensing data and GIS for landslide hazard analysis using spatial-based statistical models,” Arab. J. Geosci., 2009, DOI: 10.1007/s12517-009-0089-2, to be published. B. Pradhan, “Manifestation of an advanced fuzzy logic model coupled with geo-information techniques to landslide susceptibility mapping and their comparison with logistic regression modelling,” Environ. Ecol. Stat., 2010, DOI: 10.1007/s10651-010-0147-7, to be published. B. Pradhan, “Landslide susceptibility mapping of a catchment area using frequency ratio, fuzzy logic and multivariate logistic regression approaches,” J. Indian Soc. Remote Sens., vol. 39, pp. 47–66, 2010. M. Ercanoglu and C. Gokceoglu, “Use of fuzzy relations to produce landslide susceptibility map of a landslide prone area (West Black Sea Region, Turkey),” Eng. Geol., vol. 75, no. 3/4, pp. 229–250, Nov. 2004. B. Pradhan and S. Lee, “Landslide risk analysis using artificial neural network model focusing on different training sites,” Int. J. Phys. Sci., vol. 3, no. 11, pp. 1–15, 2009. F. Bignel and G. Snelling, “The geochronology of the main range Batholith: Cameron Highlands road and Gunong Bujang Melaka,” Overseas Geol. Miner. Resour., vol. 47, pp. 3–35, 1977. R. Krahenbuhl, “Magmatism, tin mineralization and tectonic development of Main Range, Malaysian Peninsula: Consequences for plate tectonic model of Southeast Asia based on Rb-Sr, K-Ar and fission track analysis,” Geol. Soc. Malaysia Bull., vol. 29, pp. 12–28, 1991. E. J. Cobbing, P. Pitfield, D. P. E. Darbyshire, and D. I. J. Mallick, “The granites of Southeast Asian tin belt,” Brit. Geol. Survey Oversea Memoir, vol. 10, pp. 1–53, 1992. W. S. Chow, M. Zakaria, A. Ferdaus, and A. Nurzaidi, “Geological terrain mapping. JMG unpublished report,” JMG.SWP.GS, vol. 16, pp. 1–42, 2003.
PRADHAN et al.: LANDSLIDE SUSCEPTIBILITY MAPPING BY NEURO-FUZZY APPROACH
[51] B. Pradhan and S. Lee, “Regional landslide susceptibility analysis using backpropagation neural network model at Cameron Highlands, Malaysia,” Landslides, vol. 7, no. 1, pp. 13–30, Mar. 2010. [52] J. P. Wilson and J. C. Gallant, “Digital terrain analysis,” Soil Sci., vol. 121, pp. 234–241, 2000, pp. 1–27 in eastern Kentucky. [53] I. S. Evans, “What do terrain statistics really mean?” in Landform Monitoring, Modelling and Analysis, S. Lane, K. Richards, and J. Chandler, Eds. London, U.K.: Wiley, 1998, pp. 119–138. [54] J. A. Coe, J. W. Godt, R. L. Baum, R. C. Bucknam, and J. A. Michael, “Landslide susceptibility from topography in Guatemala,” in Landslides: Evaluation and Stabilization, W. A. Lacerda, M. Ehrlich, S. A. B. Fontura, and A. S. F. Sayão, Eds. New York: Taylor & Francis, 2004, pp. 69–78. [55] N. Nikolaou, “Rain and landslide manifestation correlation in Korinthos country, Greece,” in Proc. Int. Symp. Eng. Geol. Environ., Athens, Greece, 1997, vol. 1, pp. 919–924. [56] H. X. Lan, C. H. Zhou, L. J. Wang, H. Y. Zhang, and R. H. Lic, “Landslide hazard spatial analysis and prediction using GIS in the Xiaojiang watershed, Yunnan, China,” Eng. Geol., vol. 76, no. 1/2, pp. 109–128, Dec. 2004. [57] M. Negnevitsky, Artificial Intelligence: A Guide to Intelligent Systems. Harlow, U.K.: Addison-Wesley, 2002. [58] J. S. R. Jang, “ANFIS: Adaptive-network-based fuzzy inference systems,” IEEE Trans. Syst., Man, Cybern., vol. 23, no. 3, pp. 665–685, May/Jun. 1993. [59] C. C. Lee, “Fuzzy logic in control systems: Fuzzy logic controller— Part I,” IEEE Trans. Syst., Man, Cybern., vol. 20, no. 2, pp. 404–418, Mar./Apr. 1990. [60] J. A. Swets, “Measuring the accuracy of diagnostic systems,” Science, vol. 240, no. 4857, pp. 1285–1293, Jun. 1988. [61] B. Biggerstaff, “Comparing diagnostic tests: A simple graphic using likelihood ratios,” Stat. Med., vol. 19, no. 5, pp. 649–663, Mar. 2000.
Biswajeet Pradhan received the B.Sc. degree in geology (with honors) from Berhampur University, Berhampur, India, in 1995, the M.Sc. degree in applied geology from the Indian Institute of Technology (IIT), Bombay, India, in 1998, the M.Tech. degree in civil engineering from the IIT, Kanpur, India, in 2000, and the Ph.D. degree in geographic information system (GIS) and geomatics engineering from the University Putra Malaysia, Serdang, Malaysia, in 2005. He has been an Alexander von Humboldt Research Fellow with the Dresden University of Technology, Dresden, Germany, since August 2008. He specializes in remote sensing, GIS application, and soft computing techniques in natural hazard and environmental problems. He has more than ten years of teaching, research, and industrial experience. He has published over 50 research articles in referred technical journals and books. Dr. Pradhan was the recipient of the German Deutscher Akademischer Austausch Dienst (DAAD) and was a Saxony Scholarship Holder from 1999 to 2002.
4177
Ebru Akcapinar Sezer was born in Ankara, Turkey, on December 25, 1974. She received the B.Sc., M.Sc., and Ph.D. degrees from the Department of Computer Engineering, Hacettepe University, Ankara, Turkey, in 1996, 1999, and 2006, respectively. She is currently an Associate Lecturer with the Department of Computer Engineering, Hacettepe University. Her areas of interest are semantic Web technologies and fuzzy system applications.
Candan Gokceoglu was born in Ardahan, Turkey, on July 25, 1966. He received the B.Sc. degree from the Department of Hydrogeological Engineering and the M.Sc. and Ph.D. degrees from the Department of Geological Engineering, Hacettepe University, Ankara, Turkey, in 1989, 1993, and 1997, respectively. He is currently a Professor with the Applied Geology Division, Department of Geological Engineering, Hacettepe University. He has published over 60 research articles in referred scientific journals. His areas of interest are landslides, rock mechanics, and fuzzy system applications.
Manfred F. Buchroithner received the degree in geology and paleontology from the University of Graz, Graz, Austria, the degree in cartography and remote sensing from the International Institute for Geo-Information Science and Earth Observation, Enschede, The Netherlands, and the Ph.D. degree from the University of Graz in 1977. He is currently a Full Professor of cartography and the Director of the Institute for Cartography, Dresden University of Technology, Dresden, Germany. Out of his more than 290 articles, more than 70 have been published in reviewed journals. He has written three books and has edited three volumes on remote sensing. His major research interests cover geohazard problems, true-3-D geodata visualization, and high-mountain cartography.