Journal of the Faculty of Forestry Istanbul University 2015, 65(1): 30-40
JOURNAL OF THE FACULTY OF FORESTRY ISTANBUL UNIVERSITY İSTANBUL ÜNİVERSİTESİ ORMAN FAKÜLTESİ DERGİSİ ISSN: 0535-8418 Available at http://dergipark.ulakbim.gov.tr/jffiu
e-ISSN: 1309-6257 Research Article
Landslide susceptibility mapping using logistic statistical regression in Babaheydar Watershed, Chaharmahal Va Bakhtiari Province, Iran Ebrahim Karimi Sangchini 1*, Mohammad Reza Nowjavan 2, Abdolhossein Arami 1 1* 2
Gorgan University of Agricultural Sciences and Natural Resources, Iran Islamic Azad University, Maybod Branch, Maybod Professor of Geomorphology, Iran
* Corresponding
author e-mail:
[email protected]
Received: 30 June 2014 - Accepted: 20 August 2014 Abstract: Landslides are amongst the most damaging natural hazards in mountainous regions. Every year, hundreds of people all over the world lose their lives in landslides; furthermore, there are large impacts on the local and global economy from these events. In this study, landslide hazard zonation in Babaheydar watershed using logistic regression was conducted to determine landslide hazard areas. At first, the landslide inventory map was prepared using aerial photograph interpretations and field surveys. The next step, ten landslide conditioning factors such as altitude, slope percentage, slope aspect, lithology, distance from faults, rivers, settlement and roads, land use, and precipitation were chosen as effective factors on landsliding in the study area. Subsequently, landslide susceptibility map was constructed using the logistic regression model in Geographic Information System (GIS). The ROC and Pseudo-R2 indexes were used for model assessment. Results showed that the logistic regression model provided slightly high prediction accuracy of landslide susceptibility maps in the Babaheydar Watershed with ROC equal to 0.876. Furthermore, the results revealed that about 44% of the watershed areas were located in high and very high hazard classes. The resultant landslide susceptibility maps can be useful in appropriate watershed management practices and for sustainable development in the region. Keywords: Landslide zonation, multivariate statistical model, Babaheydar watershed, Chaharmahal Va Bakhtiari province
İran’ın Çaharmahal ve Bahtiyari Bölgesi’nde yer alan Baba Haydar Havzası’nda lojistik regresyon kullanılarak heyelan hassasiyeti haritasının çıkartılması Özet: Toprak kaymaları, dağlık bölgelerdeki en zarar verici doğal felaketler arasında yer almaktadır. Her yıl, dünyanın dört bir yanında yüzlerce insan toprak kayması neticesinde ölüyor. Ayrıca, bu olayların yerel ve global ekonomi üzerinde de büyük etkileri bulunmaktadır. Bu çalışmada, toprak kayması tehlikesine sahip bölgeleri tespit etmek üzere lojistik regresyon kullanılarak Baba Haydar Havzası’nda toprak kayması tehlikesi haritası çıkartılmıştır. İlk olarak, havadan çekilmiş fotoğraf yorumları ve saha incelemeleri kullanılarak toprak kayması envanter haritası hazırlanmıştır. Bir sonraki adımda rakım, eğim yüzdesi, eğim açısı, litoloji, fay hatlarına olan mesafe, nehirler, yerleşim yerleri ve yollar, arazi kullanımı ve yağış miktarı olmak üzere toprak kaymasına neden olabilecek on adet faktör, çalışma bölgesinde toprak kaymasında etkin faktörler olarak seçilmiştir. Ardından, Coğrafi Bilgi Sisteminde (GIS) lojistik regresyon modeli kullanılarak toprak kayması hassasiyeti haritası oluşturulmuştur. Model değerlendirmesi için ROC ve Pseudo-R2 endeksleri kullanılmıştır. Sonuçlar, lojistik regresyon modelinin, 0.876’lık ROC değeri ile birlikte Baba Haydar Havzası’nda toprak kayması hassasiyet haritasının yüksek bir tahmin doğruluğu sağladığını göstermiştir. Ayrıca sonuçlar, havza bölgelerinin yaklaşık %44’ünün yüksek ve son derece tehlikeli sınıflarda yer aldığını ortaya çıkartmıştır. Sonuç olarak elde edilen toprak kayması hassasiyeti haritaları, uygun havza yönetimi uygulamalarında ve bölgenin sürdürülebilir bir şekilde geliştirilmesinde faydalı olabilir. Anahtar Kelimeler: Heyelan bölgelendirme, çok değişkenli istatistiksel model, Baba Haydar havzası, Çaharmahal ve Bahtiyari bölgesi
1. INTRODUCTION Landslides are amongst the most damaging natural disasterin the mountainous terrain. Every year, hundreds of people all over the world lose their lives in landslides; furthermore, there are large impacts on the local, regional and global economy from these events. Over the past 25 years, many governments and international research institutions across the world have invested considerable resources in assessing To cite this article: Sangchini, E.K., Nowjavan, M.R., Arami, A., 2015. Landslide susceptibility mapping using logistic statistical regression in Babaheydar Watershed, Chaharmahal Va Bakhtiari Province, Iran. Journal of the Faculty of Forestry Istanbul University 65(1): 30-40. DOI: 10.17099/jffiu.52751
Journal of the Faculty of Forestry Istanbul University 2015, 65(1): 30-40
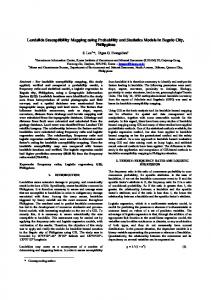
landslide susceptibilities and in attempting to produce maps portraying their spatial distribution (Guzzetti et al., 1999, Yalcin et al., 2011). Landslide susceptibility zonation is one of the ways that we can identify the critical regions and we can use the resulting zoning maps in sustainable development planning with its contribution. Dozens of numerical models were devised for the zoning of the relative risk of the slope instability with weight, rate, computational logic and different scale agents and modified in a variety of conditions based on land evidences (Sakar, 1995). Identification and classification of areas prone to landslide and its hazard zonation is a significant step in the evaluation of environmental hazards and plays an indispensable role in the management of watersheds (Sakar, 1995). There are three main approaches in landslide susceptibility assessment such as qualitative (Hasekiogullari and Ercanoglu, 2012), semi-quantitative (Akgun and Turk, 2010, Pourghasemi et al., 2014) and quantitative (Lee and Jones, 2004). Quantitative methods are based on mathematical logic, the correlation between factors and landslide occurrence that include bivariate regression analysis (Guzzetti et al., 2002, Nandi and Shakoor, 2009; Pradhan and Lee, 2010a, 2010b, Yalcin et al., 2011; Yilmaz et al., 2012, Bijukchhen et al., 2013, Kayastha et al., 2013), multivariate (Suzen and Doyuran, 2004; Nandi and Shakoor, 2009; Pradhan and Youssef, 2010; Pradhan et al., 2011), and logistic regression (Ayalew and Yamagishi, 2005; Duman et al., 2006; Pradhan, 2010a; Akgun, 2012; Pourghasemi et al., 2013b; Eker and Aydın, 2014), fuzzy logic (Tangestani, 2009; Pradhan et al., 2009; Pradhan, 2010b, Pradhan and Lee, 2010a; Pradhan, 2011, 2011b, Pourghasemi et al., 2013, Pourghasemi et al., 2012b), artificial neural network model (Ermini et al., 2005; Pradhan and Lee, 2007; Melchiorre et al., 2008; Caniani et al., 2008; Pradhan and Lee, 2009; Pradhan et al., 2010a; Pouydal et al., 2010c; Pradhan and Buchroithner, 2010; Pradhan and Lee, 2010a; Pradhan and Lee, 2010b; Pradhan et al., 2011a; Pradhan et al., 2010; Pradhan, 2013). In multivariate statistical methods, the simultaneous analysis of several independent variables on space dependent variable is provided and since the phenomena such as landslides are due to simultaneous function and different effects of several variables, therefore the use of multivariate statistical models is suitable (Karimi Sangchini et al., 2011). Many modeling approaches for landslide hazard prediction can be used to produce statistics-based susceptibility maps. Logistic regression and discriminant analysis are the most frequently used models (Brenning, 2005). Logistic regression and statistical models have been developed using the geographic information system (GIS) for landslide susceptibility mapping (Lee et al., 2010). The multivariate logistic regression approach was used by various researchers worldwide (Yesilnacar and Topal 2005; Lee and Pradhan, 2007; Nandi and Shakoor, 2009; Yilmaz, 2010; Oh and Lee, 2010; Felicisimo et al., 2013). In this paper, landslide susceptibility mapping in Babaheydar watershed with a logistic regression multivariate statistical model of quantitative models is to determine landslide susceptibility areas for its landslide hazard management. 2. MATERIALS AND METHODS 2.1 Study area Babaheydar Watershed is located between 32° 13′ 21″ to 32° 24′ 1″ latitude and 50° 22′ 4″ to 50° 32′ 29″ longitude, occupying approximately 181.46 sq. km in the Chaharmahal Va Bakhtiari Province, southwest of Iran (Figure / Şekil 1). This watershed is one of the major sub basins of Karoon River. Altitude in the study area varies between 2,040 to 3,610 m. Based on the Iranian meteorological organization report; the average annual rainfall in the watershed is 672 mm. This watershed is located in the middle of the Zagros Mountains. Subsequent erosion removed softer rocks, such as mudstone (rock formed by consolidated mud) and siltstone (a slightly coarser-grained mudstone) while leaving behind harder rocks exposed, such as limestone (calcium-rich rock consisting of the remains of marine organisms) and dolomite (rocks similar to limestone containing calcium and magnesium). This differential erosion formed the linear ridges of the Zagros Mountains. 69% of this region is covered by rangelands and remaining lands are covered by Residential, agricultural and rocky lands (about 31% from region area).
31
Journal of the Faculty of Forestry Istanbul University 2015, 65(1): 30-40
450000
·
Chaharmahal Va Bakhtiari
3575000
3575000
Iran
Legend Landslide Study area
0 1.5 3
6 Kilometers
450000
Figure 1. Location map of the study area Şekil 1. Çalışma alanının konumu
2.2 Data preparation and landslide inventory The landslide inventory map was prepared using gathering the information related to the landslides or by analyzing the data from remote sensing and GIS techniques. In the current study, a landslide inventory map was prepared using field investigations, information received from inhabitants and aerial photograph interpretation . From literature review and studying conditions of Babaheydar watershed, a total of ten factors such as altitude, slope percentage, slope aspect, lithology, distance from faults, rivers, settlement and roads, land use, and precipitation amount were chosen as effective factors on landsliding. In the next stage, the area and landslide percentage, the density ratio and landslide density percentage in each class of these ten landslide factors were calculated. 2.3 Landslide susceptibility mapping by using logistic regression models For the landslide susceptibility zonation using logistic regression, the landslide density in each class of the ten parameters of landslides was calculated. For this purpose, homogeneous units’ map was prepared by integrating maps of several factors. After matching the map of homogeneous units up with a landslide distribution map, the units of the landslide were determined and to all homogeneous landslide units, the code (1) and to all homogeneous with no landslide units, the code (0) was given. The absence or presence of landslide in homogeneous units as dependent variable and landslide density percent in each class of nine parameters in units as independent variable were entered in the R statistical software. The logistic regression equation is as follows (Ayalew and Yamagish 2005): (1) In this equation, p is the probability of independent variable(Y), p/(1-p) is the so-called odds or the likelihood ratio , C0 is the intercept , C1, C2,….Cn are coefficients (which measure the size and the contribution of independent factors (X1, X2, ... and Xn) in a dependent variable) e) and ei is error term. Using the density of factors as independent variables, and presence or absence of landslides as the dependent variable, attempted to determine the best equation as follows that is meaningful at 0.01 % error level. 32
Journal of the Faculty of Forestry Istanbul University 2015, 65(1): 30-40
(2) (3) (4) Using the resulting model, the landslide susceptibility map was produced and classified in very low, low, medium, high, very high classes. 2.4 Assessment of the landslide susceptibility model 2.4.1 Pseudo-R2 index The Pseudo-R2 index is one of the indicators was used to evaluate the efficiency of logistic regression. This index based on the likelihood ratio principle, tests the goodness of fitting into the logistic regression and is calculated according to the following equation:
(5) Where: Likelihood: the likelihood function amount in a case that the model is fully fitted. L0: the likelihood function amount in a case that all coefficients except for the intercept are zero. Unlike R2 in ordinary regression, Pseudo-R2 does not indicate the proportion of variance explained by the model, but this indicates the dependency rate of the empirical and output data of the regression model, thus, its value is generally much lower than R2. The Pseudo-R2 equivalent to one indicates perfect fit and the Pseudo-R2 equivalent to zero means that there is no significant relationship between independent and dependent variables. In spatial studies, Pseudo-R2 more than 0.2 can be considered as a relatively good fit (Clark and Hosking, 1986). 2.4.2 ROC index The efficiency of the susceptibility model can be evaluated by ROC index (relative operating characteristic). This index is computed from the ROC curve. The ROC curve is a diagram in which the pixel ratio that is correctly predicted the occurrence or nonoccurrence of landslides (True Positive) is plotted against the supplement amount that is the pixel ratio that is wrongly predicted. As already mentioned, the susceptibility model, computes the change in likelihood in each pixel in a continuous range of zero and one. By determining a threshold (e.g. 0.5) the model's output can be converted to a discrete scale of zero and one e.g. the pixels, in which that the change likelihood is more than their threshold, take 1 and pixels in which the change likelihood is less than their threshold takes 0 and the output is presented as a map. By comparing this with the landslide inventory, the pixel ratio can be plotted in ROC diagram.. The ROC index equals to the area under the curve (Pontius and Schneider, 2001).
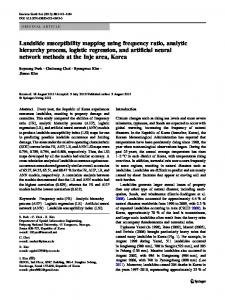
3. RESULTS The landslide inventory map showed that there are 46 distributed landslides in the whole area. Affected total area by landslide is 1103.97 ha (6.1% of the watershed area). The area and landslide percentage, the landslide density percentage in each class of ten landslide factors were calculated (Table / Tablo 1 and Figure / Şekil 2-3).
33
Journal of the Faculty of Forestry Istanbul University 2015, 65(1): 30-40
Table 1. Calculation of the final susceptibility value of each identified land unit Tablo 1. Tanımlanan her alan için hassasiyet değerinin hesaplanması Data layers
Aspect
Rainfall (mm)
Elevation (m)
Distance from fault (m)
Land use
Distance from stream (m)
Distance from road (m)
Slope (%)
Distance from settlement (m)
N NE E SE S SW W NW 520-600 600-650 650-700 700-750 750-800 800-860 2040-2200 2200-2400 2400-2600 2600-2800 2800-3000 3000-3200 3200-3400 3400-3610 0-500 500-1300 1300-2300 2300-3500 >3500 Rocky land Rainfed agriculture Irrigated agriculture Good range Medium range Poor range Residential 0-50 50-100 100-150 150-200 200-300 300-450 >450 0-75 75-150 150-225 225-300 300-500 >500 0-5 6-15 16-25 26-35 36-45 >45 0-50 50-100 100-200 200-300 300-500 >500
Total area (ha)
% of total area
Area of landslide
274.43 6804.61 1786.22 1155.3 2967.75 3658.39 882.07 675.14 3110.39 4069.86 5085.55 3044.14 1975.51 861.34 2324.89 3476.85 5473.35 3300.00 1872.17 943.96 481.76 271.79 2131.41 3404.55 3322.64 3129.73 6157.68 497.88 3141.95 1681.33 4248.07 5929.01 2360.84 286.95 4866.35 6098.56 1744.57 2256.92 1842.41 1337.21 4866.35 1501.19 1391.97 1249.77 1115.01 2421.83 10466.26 806.21 3188.02 4205.63 2514.79 503.99 6927.41 15.67 47.08 188.41 300.65 817.10 16777.11
1.5 37.5 9.84 6.04 16.37 20.16 4.86 3.72 17.14 22.43 28.02 16.78 10.89 4.75 12.81 19.16 30.16 18.19 10.32 5.20 2.66 1.50 11.75 18.76 18.31 17.25 33.93 2.74 17.31 9.27 23.41 32.67 13.01 1.58 26.82 33.61 9.61 12.44 10.15 7.37 26.82 8.27 7.67 6.89 6.14 13.35 57.68 4.44 17.57 23.18 13.86 2.78 38.18 0.09 0.26 1.04 1.66 4.50 92.46
6.07 230.67 64.54 53.11 245.07 258.70 124.21 121.50 76.52 290.95 433.04 220.90 79.70 0.00 32.49 248.68 444.82 247.23 104.75 23.14 0.00 0.00 238.98 264.49 227.56 274.00 96.08 0.00 287.17 73.87 209.53 302.13 228.42 0.00 249.53 348.35 106.48 161.00 162.64 73.12 249.53 141.30 123.95 99.97 83.59 141.46 510.85 8.22 70.12 353.74 182.72 30.02 456.29 3.13 9.73 37.12 47.72 93.41 910.00
34
Landslide density percentage 4.44 4.96 2.92 4.77 16.57 13.44 28.26 24.63 8.36 24.30 28.95 24.67 13.72 0.00 4.34 22.20 25.23 23.26 17.37 7.61 0.00 0.00 31.02 21.49 18.95 24.22 4.32 0.00 27.50 13.22 14.84 15.33 29.11 0.00 13.36 14.89 15.91 18.59 23.00 14.25 13.36 21.13 19.99 17.96 16.83 13.12 10.96 3.24 7.00 26.75 23.11 18.95 20.95 21.48 22.20 21.16 17.05 12.28 5.83
Journal of the Faculty of Forestry Istanbul University 2015, 65(1): 30-40
Table / Tablo 1.Continued - Devam ediyor Total area (ha)
Data layers Qft2 (Low level piedmont fan and valley terrace deposit) Klsol (Grey , thick - bedded to massive orbitolina limestone)
Geology units
E (Undivided Eocene rock) Kbgp (Undivided Bangestan Group , mainly limestone and shale) KEpd-gu (Pabdeh and Gorpei formations) Plc (Polymictic conglomerate and sandstone) OMas (jointed limestone with intercalations of shale (Asmari FM))
6640.38 1106.60 6323.79 421.80 1185.62 1093.43 1374.40
% of total area 36.59 6.10 34.85 2.32 6.53 6.03 7.57
Area of landslide 422.48 95.33 398.53 4.00 88.02 73.21 19.54
Landslide density percentage 16.85 22.81 16.69 2.51 19.66 17.73 3.76
Figure 2. Landslide conditioning parameter; a aspect, b rainfall, c elevation, d lithology, e distance from fault, f land use Şekil 2. Alan verileri; a bakı, b yağış, c yükseklik, d anakaya, e faydan uzaklık, f alan kullanımı 35
Journal of the Faculty of Forestry Istanbul University 2015, 65(1): 30-40
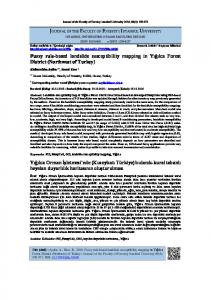
Figure 3. Landslide conditioning parameter; g distance from stream, h distance from road, i slope percentage, j distance from settlement Şekil 3. Alan verileri; g sulu dereden uzaklık, h yoldan uzaklık, i eğim yüzdesi, j yerleşimden uzaklık
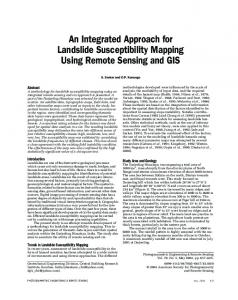
Using the resulting Logistic regression model, the landslide susceptibility map was produced and classified in very low, low, medium, high, very high classes (Table / Tablo 2 and Figure / Şekil 4). In this study, we evaluated the accuracy of logistic regression using Pseudo-R2 index. The Pseudo-R2 amount was calculated to be equal to 0.48, thus we can consider this model's fitting is relatively good. The ROC index amount was 0.876 for logistic regression that its proximity indicates the model high potential of zoning and determining areas prone to landslide susceptibility in Babaheydar Watershed. Results showed that the logistic regression model is selected as suitable model Babaheydar Watershed (Figure / Şekil 5). Table 2 The distribution of area in different landslide susceptibility classes Tablo 2. Farklı heyelan Susceptibility class Area (ha) % Area Very low 1455.20 8.02 Low 3643.74 20.08 Medium 4977.72 27.43 High 4822.66 26.58 Very high 3246.76 17.89 Total 18146.01 100
36
Journal of the Faculty of Forestry Istanbul University 2015, 65(1): 30-40
Figure 4 Landslide susceptibility map based on Logistic regression model in Babaheydar Watershed Şekil 4. Lojistik regresyon modeli ile üretilen Babahaydar havzası heyelan hassasiyeti haritası
Figure 5. ROC curves for logistic regression model Şekil 5. Lojistik regresyon modeli için ROC eğrisi
4. DISCUSSION AND CONCLUSION This study tried to perform susceptibility zonation using logistic regression in Babaheydar Watershed. In the logistic regression as one of the multivariate statistical methods, the simultaneous analysis of several independent variables on the spatial dependent variable is provided and since the phenomena such as landslides, are caused by the simultaneous performance and different effects of several variable, so it's use is suitable. Yesilnacar and Topal (2005), Ayalew and Yamagishi (2005) Lee and Pradhan (2007), Nandi and Shakoor (2009), Akgun (2012); Pourghasemi et al. (2013b) used logistic regression in landslide susceptibility zonation. Their aim in watershed studies was to choose the best effective factors on landslide susceptibility. The logistic regression model was chosen as the suitable model for Babaheydar watershed with ROC equal to 0.876. The Babaheydar watershed’s conditions such as geology, roughness, geomorphology and tectonic conditions as well as human pressure factors such as land use and rural roads' changes has 37
Journal of the Faculty of Forestry Istanbul University 2015, 65(1): 30-40
created a proper background for the landslide that its occurrence is about 46 cases with an approximate extent of 1103.97 hectares in watershed basin. After the zonation using logistic regression model in Babaheydar watershed, about 44% of the watershed area are located in high and very high susceptibility classes which it is showing high susceptibility to landslide for watershed basin that should be considered in Susceptibility management, landslide losses and land use planning. Converting the rangeland to rain fed farming and road building is performed sharply in the Babaheydar watershed during recent years and led to presenting high role of human factors on landslide in comparing other factors. REFERENCES (KAYNAKLAR) Akgun, A., Turk, N., 2010. Landslide susceptibility mapping for Ayvalik (Western Turkey) and its vicinity by multicriteria decision analysis. Environmental Earth Science 61: 595–611. Akgun, A., 2012. A comparison of landslide susceptibility maps produced by logistic regression, multi-criteria decision, and likelihood ratio methods: a case study at İzmir, Turkey. Landslides 9: 93–106 Ayalew, L., Yamagishi, H., 2005. The application of GIS-based logistic regression for landslide susceptibility mapping in the Kakuda-Yahiko Mountains, Central Japan. Geomorphology 65: 15–31. Brenning, A., 2005: Spatial prediction models for landslide hazards: review, comparison and evaluation. Natural Hazards Earth Systems Science 5(6): 853–862, doi:10.5194/nhess-5-853-2005. Bijukchhen, S.M., Kayastha, P., Dhital. M.R., 2013. A comparative evaluation of heuristic and bivariate statistical modeling for landslide susceptibility mappings in Ghurmi-Dhad Khola, east Nepal. Arabian Journal of Geosciences 6(8): 2727-2743. Caniani, D. Pascale, S. Sdao, F., Sole, A., 2008. Neural networks and landslide susceptibility: a case study of the urban area of Potenza. Natural Hazards 45: 55–72. Clark, W.A.V., Hosking, P.L., 1986. Statistical methods for geographers. Mathematics, 518p. Duman, T.Y., Can, T., Gokceoglu, C., Nefeslioglu, H.A., Sonmez, H., 2006. Application of logistic regression for landslide susceptibility zoning of Cekmece Area, Istanbul, Turkey. Environmental Geology 51:241–256. Eker, R., Aydın, A., 2014. Assessment of forest road conditions in terms of landslide susceptibility: a case study in Yığılca Forest Directorate (Turkey). Turkish Journal of Agricultural Forestry 38(2): 281-290. Ermini, L., Catani, F., Casagli, N., 2005. Artificial neural networks applied to landslide susceptibility assessment. Geomorphology 66:327–343. Guzzetti, F., Carrara, A., Cardinalli, M., Reichenbach, P., 1999. Landslide hazard evaluation: a review of current techniques and their application in a multi-scale study, Central Italy. Geomorphology 31: 181–216. Guzzetti, F., 2002. Landslide hazard assessment and risk evaluation: overview, limits and prospective. Proceedings 3rd MITCH Workshop Floods, Droughts and Landslides Who Plans, Who Pays, page 24–26. Felicisimo, A., Cuartero, A., Remondo, J., Quiros, E., 2013. Mapping landslide susceptibility with logistic regression, multiple adaptive regression splines, classification and regression trees, and maximum entropy methods: a comparative study. Landslides 10(2): 175-189, doi:10.1007/s10346-012-0320-1 Hasekiogullari, G.D., Ercanoglu, M.A., 2012. New approach to use AHP in landslide susceptibility mapping: a case study at Yenice (Karabuk, NW Turkey). Natural Hazards 63(2): 1157-1179, doi:10.1007/s11069-012-0218-1 Karimi Sangchini, E., Ownegh, M., Sadoddin, A., Mashayekhan, A., 2011. Probabilistic landslide risk analysis and mapping (Case Study: Chehel-Chai watershed, Golestan Province, Iran). Journal of Rangeland Science 2(1): 425436. Kayastha P., Dhital MR, De Smedt, F., 2013. Evaluation and comparison of GIS based landslide susceptibility mapping procedures in Kulekhani watershed, Nepal. Journal of the Geological Society of India 81:219-231 Lee, S., Pradhan, B., 2007. Landslide hazard mapping at Selangor, Malaysia using frequency ratio and logistic regression models. Landslides 4: 33–41.
38
Journal of the Faculty of Forestry Istanbul University 2015, 65(1): 30-40
Lee, S.T., Yu, T.T., Peng, W.F., Wang, C.L., 2010. incorporating the effects of topographic amplification in the analysis of earthquake-induced landslide hazards using logistic regression. Natural Hazards and Earth System Sciences 10: 2475-2488, doi:10.5194/nhess-10-2475-2010. Lee, E.M., Jones, D.K.C., 2004. Landslide risk assessment. Thomas Telford, London, p 454. Melchiorre, C., Matteucci, M., Azzoni, A., Zanchi, A., 2008. Artificial neural networks and cluster analysis in landslide susceptibility zonation. Geomorphology 94: 379–400. Nandi, A., Shakoor, A.A., 2009. GIS-based landslide susceptibility evaluation using bivariate and multivariate statistical analyses. Engineering Geology 110: 11–20. Oh, H.J., Lee, S., 2010. Cross-validation of logistic regression model for landslide susceptibility mapping at Geneoung areas, Korea. Disaster Advances 3(2): 44–55. Pontius, R.J., Schneider, L.C., 2001. Land-cover change model validation by an ROC method for the Ipswich watershed, Massachusetts, USA. Agriculture, Ecosystems and Environment 85: 239–248. Pourghasemi, H.R., Pradhan, B., Gokceoglu, C., 2012a. Application of fuzzy logic and analytical hierarchy process (AHP) to landslide susceptibility mapping at Haraz watershed, Iran. Natural Hazards 63: 965–996. doi:10.1007/s11069-012-0217-2. Pourghasemi, H.R., Pradhan, B., Gokceoglu, C., Mohammadi, M., Moradi, H.R., 2013a. Application of weights-ofevidence and certainty factor models and their comparison in landslide susceptibility mapping at Haraz watershed, Iran. Arabian Journal of Geoscience 6(7): 2351-2365, doi: 10.1007/s12517-012-0532-7. Pourghasemi, H.R., Moradi, H.R., Fatemi Aghda, S.M., 2013b. Landslide susceptibility mapping by binary logistic regression, analytical hierarchy process, and statistical index models and assessment of their performances. Natural Hazards 69(1): 749-779, doi: 10.1007/s11069-013-0728-5. Pourghasemi, H.R., Moradi, H.R., Fatemi Aghda, S.M., Gokceoglu, C., Pradhan, B., 2014. GIS-based landslide susceptibility mapping with probabilistic likelihood ratio and spatial multi-criteria evaluation models (North of Tehran, Iran). Arabian Journal of Geoscience 7(5): 1857-1878, doi: 10.1007/s12517-012-0825-x Pouydal C.P., Chang, C., Oh, H.J., Lee, S., 2010. Landslide susceptibility maps comparing frequency ratio and artificial neural networks: a case study from the Nepal Himalaya. Environmental Earth Science 61: 1049–1064. Pradhan, B., 2010a. Remote sensing and GIS-based landslide hazard analysis and cross-validation using multivariate logistic regression model on three test areas in Malaysia. Advances Space Research 45: 1244–1256. Pradhan, B., 2011a. Use of GIS-based fuzzy logic relations and its cross application to produce landslide susceptibility maps in three test areas in Malaysia. Environmental Earth Science 63(2): 329-349, doi:10.1007/s12665010-0705-1 Pradhan, B., 2011b. Manifestation of an advanced fuzzy logic model coupled with geoinformation techniques for landslide susceptibility analysis. Environmental and Ecological Statistics 18(3):471–493, doi:10.1007/s10651-0100147-7 Pradhan, B., 2011c. Use of GIS-based fuzzy logic relations and its cross application to produce landslide susceptibility maps in three test areas in Malaysia. Environmental Earth Science 63(2):329–349. Pradhan, B., 2013. A comparative study on the predictive ability of the decision tree, support vector machine and neuro-fuzzy models in landslide susceptibility mapping using GIS. Computer and Geoscience 51: 350-365, doi:10.1016/j.cageo.2012.08.023 Pradhan, B. Buchroithner, M.F., 2010. Comparison and validation of landslide susceptibility maps using an artificial neural network model for three test areas in Malaysia. Environmental Engineering Geoscience 16(2): 107–126, doi:10.2113/gseegeosci.16.2.107 Pradhan, B., Lee, S., 2007. Utilization of optical remote sensing data and GIS tools for regional landslide hazard analysis by using an artificial neural network model. Earth Science Frontiers 14(6):143–152. Pradhan, B., Lee, S., 2009. Landslide risk analysis using artificial neural network model focusing on different training sites. International Journal of Physical Science 3(11):1–15. 39
Journal of the Faculty of Forestry Istanbul University 2015, 65(1): 30-40
Pradhan, B., Lee, S., 2010a. Delineation of landslide hazard areas on Penang Island, Malaysia, by using frequency ratio, logistic regression, and artificial neural network models. Environmental Earth Science 60: 1037–1054. Pradhan, B., Lee, S., 2010b. Landslide susceptibility assessment and factor effect analysis: back-propagation artificial neural networks and their comparison with frequency ratio and bivariate logistic regression modeling. Environmental Modelling and Software 25(6):747–759. Pradhan, B., Youssef, A.M., 2010. Manifestation of remote sensing data and GIS on landslide hazard analysis using spatial-based statistical models. Arabian Journal of Geoscience 3(3): 319–326. Pradhan, B., Lee, S., Buchroithner, M.F., 2009. Use of geospatial data for the development of fuzzy algebraic operators to landslide hazard mapping: a case study in Malaysia. Applied Geomatics 1: 3–15. Pradhan, B., Lee, S., Buchroithner, M.F., 2010a. A GIS-based back-propagation neural network model and its crossapplication and validation for landslide susceptibility analyses. Computers Environment and Urban Systems 34(3): 216–235. Pradhan, B., Sezer, E.A., Gokceoglu, C., Buchroithner, M.F., 2010b. Landslide susceptibility mapping by neuro fuzzy approach in a landslide prone area (Cameron Highland, Malaysia). IEEE Transactions on Geoscience and Remote Sensing 48(12): 4164–4177. Pradhan, B., Youssef, A.M., Varathrajoo, R., 2010c. Approaches for delineating landslide hazard areas using different training sites in an advanced artificial neural network model. Geo-Spatial Information Science 13(2): 93– 102. doi:10.1007/s11806-010-0236-7. Pradhan, B., Mansor, S., Pirasteh, S., Buchroithner, M., 2011. Landslide hazard and risk analyses at a landslide prone catchment area using statistical based geospatial model. International Journal of Remote Sensing 32(14): 4075–4087, doi:10.1080/01431161.2010.484433 Sakar, S., Kanungo, D.P., 1995. Mehrotar, G.S. Landslide zonation: A case study Garhwal Hymalia, India. Mountain Research and Development 15(4): 301-30. Suzen, M.L., Doyuran, V.A., 2004. comparison of the GIS based landslide susceptibility assessment methods: multivariate versus bivariate. Environmental Geology 45: 665–679. Tangestani, M.H., 2009. A comparative study of Demster-Shafer and fuzzy models for landslide susceptibility mapping using a GIS: an experience from Zagros Mountains, SW Iran. Journal of Asian Earth Science 35: 66–73. Yalcin, A., Reis, S., Aydinoglu, A.C., Yomralioglu, T., 2011. A GIS-based comparative study of frequency ratio, analytical hierarchy process, bivariate statistics and logistics regression methods for landslide susceptibility mapping in Trabzon, NE Turkey. Catena 85: 274–287. Yesilnacar, E., Topal, T., 2005. Landslide susceptibility mapping: a comparison of logistic regression and neural networks methods in a medium scale study, Hendek region (Turkey). Engineering Geology 79: 251–266. Yilmaz, I., 2010. Comparison of landslide susceptibility mapping methodologies for Koyulhisar, Turkey: conditional probability logistic regression, artificial neural networks, and support vector machine. Environmental Earth Science 61: 821–836. Yilmaz, C., Topal, T., Suzen, M.L., 2012. GIS-based landslide susceptibility mapping using bivariate statistical analysis in Devrek (Zonguldak-Turkey). Environmental Earth Science 65: 2161–2178.
40