APPLIED PHYSICS LETTERS 92, 182506 共2008兲
Large magnetocaloric effect in Sm0.52Sr0.48MnO3 in low magnetic field P. Sarkar,1,2 P. Mandal,2,a兲 and P. Choudhury3 1
Department of Physics, Serampore College, Serampore 712 201, India Saha Institute of Nuclear Physics, 1/AF Bidhannagar, Calcutta 700 064, India 3 Central Glass and Ceramic Research Institute, 196 Raja S. C. Mullick Road, Calcutta 700 032, India 2
共Received 8 December 2007; accepted 12 April 2008; published online 8 May 2008兲 This letter reports on the magnetocaloric properties of Sm0.52Sr0.48MnO3 single crystal. A magnetic field of only 1 T yields a change in the magnetic entropy by 5.9 J / 共kg K兲 at TC 共=124 K兲, which is higher than those observed in several other perovskite manganites and rare earth alloys of comparable TC. This change originates from a sharp magnetization jump, associated with a first-order metamagnetic transition. Such a large change in entropy at a low magnetic field makes this material useful for magnetic refrigeration. © 2008 American Institute of Physics. 关DOI: 10.1063/1.2919732兴 Magnetic refrigeration, based on the magnetocaloric effect 共MCE兲, has attracted much research interest due to its potential advantage of environmental friendliness over gas refrigeration. Mostly, rare earth materials and their alloys show excellent magnetocaloric properties because of their large magnetic moment.1–4 However, in recent years MCE has also been extensively studied in perovskite-type manganese oxides due to their low cost of preparation, higher chemical stability, high electrical resistivity that reduces the eddy current heating and, obviously, the large magnetic entropy change with applied magnetic field. Furthermore, the wide range of magnetic transition temperatures 共100 K ⬍ TC ⬍ 375 K兲 of manganites would be useful for magnetic refrigeration at various temperatures.1,5 Large MCE has been reported in several ferromagnetic 共FM兲 manganites such as La0.7Ca0.3MnO3, La0.62Gd0.05Ca0.33MnO3, La0.87Sr0.13MnO3, etc.1,5–7 However, these materials show large MCE at intermediate or high magnetic field only. Therefore, the challenge remains to find out new materials that exhibit a large MCE at low magnetic field. The guideline for the choice of an appropriate material having large MCE is that it should have a sharp FM to paramagnetic 共PM兲 phase transition. Manganites with large quenched disorder show metamagnetic transition and hence may be suitable candidates for MCE. It is already reported that Sm1−xSrxMnO3 shows a sharp firstorder magnetic transition slightly below x = 0.5.8 In view of this, the magnetization and heat capacity of Sm1−xSrxMnO3 共x = 0.48兲 single crystal have been measured as functions of temperature and magnetic field in order to estimate the MCE. Indeed, our results show that this system displays a large MCE at a low applied field. Single crystals of Sm0.52Sr0.48MnO3 were grown using a two-mirror optical floating zone furnace in oxygen atmosphere at a growth rate of 10 mm/ h.9,10 Both electron dispersive x-ray analysis and x-ray diffraction data show that the crystal is pure and stoichiometrically correct. The magnetization measurements were carried out on a parallelepiped crystal with dimensions of 2 ⫻ 4 ⫻ 0.5 mm3 using a superconducting quantum interference device magnetometer 共magnetic property measurement system, Quantum Design兲 over a wide range of temperature 共5 – 210 K兲 and magnetic a兲
Electronic mail:
[email protected].
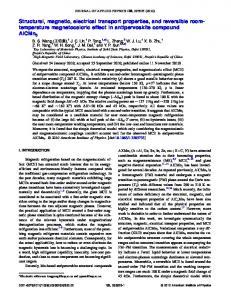
field 共H = 0 – 5 T兲 using five-scan averaging. Magnetic field was applied only along the longest direction of the sample which is the 共111兲 crystallographic direction. Heat capacity measurements were performed by semiadiabatic technique for H = 0 and 1 T. Figure 1 shows a set of isothermal magnetization 共M兲 curves as a function of magnetic field for a few selected temperatures in the vicinity of Curie temperature 共TC = 113 K at H = 0兲. Isothermal magnetization measurements were done at a temperature interval of 1 K between 105 and 135 K. Above 135 K, measurements were done at a 5 K interval. Just above TC, M exhibits a two-step behavior. This behavior indicates that both FM and PM phases coexist in the vicinity of TC. With increasing T, the two-step behavior disappears and only the sharp metamagnetic transition survives. The S-shaped magnetization curve is the signature of a first-order metamagnetic transition. For further support, we have plotted H / M versus M 2 isotherms in the inset of Fig. 1. According to the Banerjee criterion, the slope of H / M versus M 2 plot should be negative for a first-order magnetic transition.11 In the present case, the negative slope of H / M versus M 2 plot 共excluding the initial part兲 is the indication of first-order metamagnetic transition.
FIG. 1. Magnetization 共M兲 of Sm0.52Sr0.48MnO3 single crystal as a function of magnetic field 共H兲 between 110 K 共top兲 and 120 K 共bottom兲 in 2 K interval. Inset: H / M vs M 2 plot of those isotherms.
0003-6951/2008/92共18兲/182506/3/$23.00 92, 182506-1 © 2008 American Institute of Physics Downloaded 09 May 2008 to 202.56.207.57. Redistribution subject to AIP license or copyright; see http://apl.aip.org/apl/copyright.jsp
182506-2
Sarkar, Mandal, and Choudhury
Appl. Phys. Lett. 92, 182506 共2008兲
FIG. 2. Temperature dependence of magnetization 共M兲 of Sm0.52Sr0.48MnO3 single crystal for different magnetic fields. Inset: TC vs H phase diagram.
Figure 2 displays the temperature dependence of magnetization of Sm0.52Sr0.48MnO3 single crystal for different magnetic fields. In contrast to a gradual FM-PM transition, M shows a steplike jump at TC for magnetic fields below 4 T. TC linearly increases at the rate of 11.3 K / T. In this context, it is useful to compare the magnetization behavior of this sample with that of MnAs, a well known magnetic refrigerant.4 In MnAs, the magnetic transition is sharp even up to a field of 5 T and TC increases with H at the rate of 3.4 K / T. Therefore, the qualitative nature of MCE of the present sample is expected to be similar to that of MnAs. In order to calculate the MCE, one needs to study the magnetic entropy change under a magnetic field. Magnetic entropy change ⌬S M 共T , H兲 can be calculated either by using the Maxwell relation ⌬S M 共T , H兲 = 兰H 0 共 M / T兲HdH or by using the heat capacity 共C p兲 data3 ⌬S M 共T,H兲 =
冕
T
0
C p共H兲 − C p共0兲 dT. T
Figure 3共a兲 presents 兩⌬SM 兩 as a function of temperature for a field change of 0 – 1 T. 兩⌬S M 兩 obtained from the heat capacity data exhibits a flat plateau with a height of ⬃5.9 J / kg K and a width of ⬃9 K. On the other hand, 兩⌬S M 兩 derived from the Maxwell relation shows a peak of ⬃9.3 J / kg K in the temperature region of two-step behavior in M共H兲 curve 共Fig. 1兲. Similar discrepancy is also observed in La0.7Pr0.3Fe11.5Si1.5 and the origin of the large peak in 兩⌬SM 兩 obtained from magnetization measurements has been attributed to the coexistence of FM and PM phases near TC.12 For a first-order magnetic transition, it is possible to calculate ⌬S M from the Maxwell relation if only the contribution from the metamagnetic transition is taken into account.12 The peak value of 兩⌬S M 兩 in La0.7Pr0.3Fe11.5Si1.5 drops from ⬃99 to ⬃ 22 J / kg K when only the contribution from the metamagnetic transition is considered. Following this prescription, we have recalculated 兩⌬S M 兩 and the result is shown in the same figure. As expected, the peak in 兩⌬SM 兩 disappears and the agreement between 兩⌬SM 兩 calculated from magnetic and heat capacity data becomes quite satisfactory. As both the methods yield the same result, there is no unaccounted systematic error. Liu et al. suggested that for a first-order phase transition the Clausius–Clapeyron equation is equivalent to the Maxwell relation.12 To verify this, we use the Clausius– Clapeyron equation 关兩⌬S M 兩 = ⌬M / 共dTC / dH兲兴 to estimate
FIG. 3. 共a兲 Temperature dependence of magnetic entropy change 兩⌬S M 兩 of Sm0.52Sr0.48MnO3 single crystal at H = 1 T calculated from the magnetic data using the Maxwell relation 共open circles兲 and the heat capacity 共open square兲. The peak value drops from ⬃9.8 to ⬃ 5.8 J / kg K if only the contribution from metamagnetic transition is considered 共closed circle兲. 共b兲 Temperature dependence of 兩⌬SM 兩 for different H calculated from the magnetic data by noting the contribution from the metamagnetic transition only. Inset: RCP as a function of magnetic field.
兩⌬SM 兩 at TC for H = 1 T; ⌬M = M FM − M PM = 67 emu/ g is calculated from the magnetization jump in M共H兲.13 The calculation yields 兩⌬S M 兩 = 5.92 J / kg K at H = 1 T. Thus, the values of 兩⌬S M 兩 obtained by using the Maxwell relation, the Clausius–Clapeyron equation and the heat capacity data are in good agreement. Figure 3共b兲 shows the thermal distribution of 兩⌬S M 兩 for different H, calculated using the Maxwell relation by only taking into account the contribution from the metamagnetic transition. The maximum entropy change 共兩⌬Smax M 兩兲, increases with field and attains a value of 5.8 J / kg K at H = 1 T. Such a large magnetic entropy change is mainly due to the sharp change in magnetization near TC, which might have been enhanced because of the strong spinlattice coupling.7,14 For H ⬎ 1 T, the height of 兩⌬S M 兩 is insensitive to magnetic field change, whereas the peak width increases with field. This kind of plateaulike behavior of 兩⌬S M 兩 is a typical characteristic of the first-order phase transition.15 Some small spikes are observed in 兩⌬S M 兩 versus T curves, which are probably artifacts of the procedure of the calculation and are also observed in MnAs.4 Apart from large 兩⌬Smax M 兩, the relative cooling power 共RCP兲 and the adiabatic temperature change 共⌬Tad兲 are also important parameters to determine the efficiency of magnetic cooling. RCP is defined as 兩⌬Smax M 兩␦TFWHM, where ␦TFWHM is the full width at half maximum of 兩⌬S M 兩 versus T curve.1,16 The RCP values of Sm0.52Sr0.48MnO3 for different H are shown in the inset of Fig. 3共b兲. The value of RCP is 346 mJ/ cm3 for H = 1 T, which is large compared to other manganites in the low-field regime and is about 37% of that of pure Gd.2,5 ⌬Tad at a
Downloaded 09 May 2008 to 202.56.207.57. Redistribution subject to AIP license or copyright; see http://apl.aip.org/apl/copyright.jsp
182506-3
Appl. Phys. Lett. 92, 182506 共2008兲
Sarkar, Mandal, and Choudhury
cooling efficiency. We believe that all these excellent magnetocaloric properties make Sm0.52Sr0.48MnO3 single crystal an important low-temperature magnetocaloric material. To summarize, Sm0.52Sr0.48MnO3 single crystal exhibits large MCE, mainly due to the field-induced metamagnetic transition. A large magnetic entropy change 共⌬Smax M = 5.9 J / kg K兲 has been observed at a relatively low magnetic field 共1 T兲. Besides the large values of ⌬Smax M , RCP, and ⌬Tad, high chemical stability, high electrical resistivity, and low cost of production indicate a great potential of Sm0.52Sr0.48MnO3 as a magnetic refrigerant. The authors would like to thank T. Samanta, D. Bhattacharyya, and K. Pal for enlightening discussions and A. Pal for technical assistance. FIG. 4. Temperature dependence of the adiabatic temperature change 共⌬Tad兲 of Sm0.52Sr0.48MnO3 single crystal for H = 1 T. Inset: zero-field heat capacity 共C p兲 as a function of temperature.
given field H is calculated from the heat capacity data by noting the isentropic difference between the entropy curves S共0 , T兲 and S共H , T兲.3,17 Figure 4 shows the temperature dependence of ⌬Tad for H = 1 T. The maximum value of ⌬Tad at H = 1 T is 2.56 K, which is large compared to that for several other manganites and is about 61% of pure Gd.2,5 To assess the applicability of Sm0.52Sr0.48MnO3 as a magnetic refrigerant 兩⌬Smax M 兩, determined in the present study, is compared in Table I with that reported in literature for several other magnetic refrigerants with TC in the range of 100– 200 K. As is evident from the table, Sm0.52Sr0.48MnO3 shows quite large 兩⌬Smax M 兩 among the listed manganites and rare earth alloys in the low-field region. Moreover, the respectable values of RCP and ⌬Tad in a relatively low-field range 共⬃1 T兲 are important for achieving high magnetic TABLE I. Maximum entropy change 兩⌬Smax M 兩 occurring at the Curie temperature TC at low magnetic field H for several magnetic refrigerants. Composition
H共T兲
TC 共K兲
兩⌬Smax M 兩 共J/kg K兲
Reference
La0.87Sr0.13MnO3 La0.7Cd0.3MnO3 La0.9Pb0.1MnO3 La0.8Ca0.2MnO3 La0.65Ca0.35Ti0.1Mn0.9O3 Pr0.9Pb0.1MnO3 Nd0.25Pr0.25Sr0.5MnO3 La1.6Ca1.4Mn2O7 DyCo2 GdCoAl TbAl2 LaFe11.375Al1.625 Sm0.52Sr0.48MnO3a
1.50 1.35 1.50 1.00 3.00 1.35 1.35 1.50 1.00 2.00 2.00 1.00 1.00
196.5 150 160 176 103 150 170 168 142 100 105 145 124
2.90 2.88 0.53 2.75 1.30 3.91 1.65 3.80 5.80 4.88 7.50 3.90 5.90
7 18 19 6 14 20 21 22 1 23 24 25 This work
a
Value is calculated by considering the phase coexistence effect.
1
K. A. Gschneidner, Jr., V. K. Pecharsky, and A. O. Tsokol, Rep. Prog. Phys. 68, 1479 共2005兲, and references herein. 2 S. Yu. Dankov, A. M. Tishin, V. K. Pecharsky, and K. A. Gschneidner, Jr., Phys. Rev. B 57, 3478 共1998兲. 3 V. K. Pecharsky and K. A. Gschneidner, Jr., Phys. Rev. Lett. 78, 4494 共1997兲. 4 H. Wada and Y. Tanabe, Appl. Phys. Lett. 79, 3302 共2001兲. 5 M. H. Phan and S. C. Yu, J. Magn. Magn. Mater. 308, 325 共2007兲, and references herein. 6 A. N. Ulyanov, J. S. Kim, G. M. Shin, Y. M. Kang, and S. I. Yoo, J. Phys. D 40, 123 共2007兲. 7 A. Szewczyk, H. Szymczak, A. Wisniewski, K. Piotrowski, R. Kartaszynski, B. Dabrowski, S. Kolesnik, and Z. Bukowski, Appl. Phys. Lett. 77, 1026 共2000兲. 8 Y. Tomioka, H. Kuwahara, A. Asamitsu, M. Kasai, and Y. Tokura, Appl. Phys. Lett. 70, 3609 共1997兲. 9 P. Mandal, B. Bandyopadhyay, and B. Ghosh, Phys. Rev. B 64, 180405 共2001兲. 10 P. Sarkar and P. Mandal, Appl. Phys. Lett. 92, 052501 共2008兲. 11 S. K. Banerjee, Phys. Lett. 12, 16 共1964兲. 12 G. J. Liu, J. R. Sun, J. Shen, B. Gao, H. W. Zhang, F. X. Hu, and B. G. Shen, Appl. Phys. Lett. 90, 032507 共2007兲. 13 D. Kim, B. Revaz, B. L. Zink, F. Hellman, J. J. Rhyne, and J. F. Mitchell, Phys. Rev. Lett. 89, 227202 共2002兲. 14 X. Bohigas, J. Tejada, E. del Barco, X. X. Zhang, and M. Sales, Appl. Phys. Lett. 73, 390 共1998兲. 15 V. K. Pecharsky, K. A. Gschneidner, Jr., A. O. Pecharsky, and A. M. Tishin, Phys. Rev. B 64, 144406 共2001兲. 16 K. A. Gschneidner, Jr., and V. K. Pecharsky, Annu. Rev. Mater. Sci. 30, 387 共2000兲. 17 V. K. Pecharsky and K. A. Gschneidner, Jr., J. Appl. Phys. 86, 565 共1999兲. 18 N. H. Luong, D. T. Hanh, N. Chau, N. D. Tho, and T. D. Hiep, J. Magn. Magn. Mater. 290, 690 共2005兲. 19 S. G. Min, K. S. Kim, S. C. Yu, H. S. Suh, and S. W. Lee, IEEE Trans. Magn. 41, 2760 共2005兲. 20 M. H. Phan, H. X. Peng, S. C. Yu, D. T. Hanh, N. D. Tho, and N. Chau, J. Appl. Phys. 99, 08Q108 共2006兲. 21 N. Chau, D. H. Cuong, N. D. Tho, H. N. Nhat, N. H. Luong, and B. T. Cong, J. Magn. Magn. Mater. 272, 1292 共2004兲. 22 T. J. Zhou, Z. Yu, W. Zhong, X. N. Xu, H. H. Zhang, and Y. W. Du, J. Appl. Phys. 85, 7975 共1999兲. 23 X. X. Zhang, F. W. Wang, and G. H. Wen, J. Phys.: Condens. Matter 13, L747 共2001兲. 24 F. W. Wang, X. X. Zhang, and F. X. Hu, Appl. Phys. Lett. 77, 1360 共2000兲. 25 F. X. Hu, X. L. Qian, G. J. Wang, J. Wang, J. R. Sun, X. X. Zhang, Z. H. Cheng, and B. G. Shen, J. Phys.: Condens. Matter 15, 3299 共2003兲.
Downloaded 09 May 2008 to 202.56.207.57. Redistribution subject to AIP license or copyright; see http://apl.aip.org/apl/copyright.jsp