Laser heterodyne interferometric signal processing method based on rising edge locking with high frequency clock signal Enzheng Zhang,1 Benyong Chen,2,* Liping Yan,2 Tao Yang,2 Qun Hao,1 Wenjun Dong,2 and Chaorong Li2 2
1 School of Optoelectronics, Beijing Institute of Technology, Beijing 100081, China Nanometer Measurement Laboratory, Zhejiang Sci-Tech University, Hangzhou 310018, China *
[email protected]
Abstract: A novel phase measurement method composed of the rising-edge locked signal processing and the digital frequency mixing is proposed for laser heterodyne interferometer. The rising-edge locked signal processing, which employs a high frequency clock signal to lock the rising-edges of the reference and measurement signals, not only can improve the steepness of the rising-edge, but also can eliminate the error counting caused by multi-rising-edge phenomenon in fringe counting. The digital frequency mixing is realized by mixing the digital interference signal with a digital base signal that is different from conventional frequency mixing with analogue signals. These signal processing can improve the measurement accuracy and enhance anti-interference and measurement stability. The principle and implementation of the method are described in detail. An experimental setup was constructed and a series of experiments verified the feasibility of the method in large displacement measurement with high speed and nanometer resolution. © 2013 Optical Society of America OCIS codes: (120.0120) Instrumentation, measurement, and metrology; (120.3180) Interferometry; (120.5050) Phase measurement; (250.0250) Optoelectronics.
References and links 1.
T. Schuldt, M. Gohlke, D. Weise, U. Johann, and C. Braxmaier, “A high-precision dilatometer based on sub-nm heterodyne interferometry,” in International Symposium on Optomechatronic Technologies (Institute of Electrical and Electronics Engineers, New York, 2009), pp. 146–151. 2. S. Jacob, C. Johansson, M. Ulfendahl, and A. Fridberger, “A digital heterodyne laser interferometer for studying cochlear mechanics,” J. Neurosci. Methods 179(2), 271–277 (2009). 3. K. H. Chen, W. Y. Chang, and J. H. Chen, “Measurement of the pretilt angle and the cell gap of nematic liquid crystal cells by heterodyne interferometry,” Opt. Express 17(16), 14143–14149 (2009). 4. B. Y. Chen, E. Z. Zhang, L. P. Yan, C. R. Li, W. H. Tang, and Q. B. Feng, “A laser interferometer for measuring straightness and its position based on heterodyne interferometry,” Rev. Sci. Instrum. 80(11), 115113 (2009). 5. G. de Vine, D. S. Rabeling, B. J. J. Slagmolen, T. T. Lam, S. Chua, D. M. Wuchenich, D. E. McClelland, and D. A. Shaddock, “Picometer level displacement metrology with digitally enhanced heterodyne interferometry,” Opt. Express 17(2), 828–837 (2009). 6. S. F. Wang, W. Lai, J. S. Chiu, R. H. Yeh, H. C. Tseng, and W. C. Chen, “Method for measuring the twist angle of an optically compensation bend by using the heterodyne interferometry,” in International Instrumentation and Measurement Technology Conference (Institute of Electrical and Electronics Engineers, New York, 2010), pp. 296–299. 7. N. M. Oldham, J. A. Kramar, P. S. Hetrick, and E. C. Teague, “Electronic limitations in phase meters for heterodyne interferometry,” Precis. Eng. 15(3), 173–179 (1993). 8. M. S. Kim and S. W. Kim, “Two-Longitudinal-Mode He-Ne laser for Heterodyne Interferometers to Measure Displacement,” Appl. Opt. 41(28), 5938–5942 (2002). 9. S. Yokoyama, T. Yokoyama, and T. Araki, “High-speed subnanometre interferometry using an improved three-mode heterodyne interferometer,” Meas. Sci. Technol. 16(9), 1841–1847 (2005). 10. P. Köchert, J. Flügge, C. Weichert, R. Köning, and E. Manske, “Phase measurement of various commercial heterodyne He–Ne-laser interferometers with stability in the picometer regime,” Meas. Sci. Technol. 23(7),
#181630 - $15.00 USD
(C) 2013 OSA
Received 12 Dec 2012; revised 4 Feb 2013; accepted 7 Feb 2013; published 15 Feb 2013
25 February 2013 / Vol. 21, No. 4 / OPTICS EXPRESS 4638
074005 (2012). 11. T. B. Eom, J. A. Kim, C. S. Kang, B. C. Park, and J. W. Kim, “A simple phase-encoding electronics for reducing the nonlinearity error of a heterodyne interferometer,” Meas. Sci. Technol. 19(7), 075302 (2008). 12. N. B. Yim, C. I. Eom, and S. W. Kim, “Dual mode phase measurement for optical heterodyne interferometry,” Meas. Sci. Technol. 11(8), 1131–1137 (2000). 13. M.-S. Kim and S.-W. Kim, “Two-way frequency-conversion phase measurement for high-speed and high-resolution heterodyne interferometry,” Meas. Sci. Technol. 15(11), 2341–2348 (2004).
1. Introduction Heterodyne laser interferometers are widely used in high-precision displacement measurement and ultra-precise fabrications for its outstanding characteristics, which are high measurement speed and accuracy, high anti-interference, direct traceability to the primary standard of length and low sensitivity to the intensity of lasers, etc [1–7]. High speed and fine resolution of displacement measurement is the ultimate goal in the field of heterodyne interferometry. A range of signal processing methods of heterodyne interferometry have been researched during the past few decades, which can be mainly divided into two types: one is the frequency demodulation that is to directly count the Doppler-shift frequency to measure displacement with high speed characteristics; The other is the phase demodulation that is to measure the phase difference between the reference and measurement signals with high resolution characteristics. For example, Kim M.-S. et al proposed a configuration for a high-resolution heterodyne interferometer that employs a two-longitudinal-mode He-Ne laser to measure displacement with a resolution of 0.1nm [8]. Yokoyama S. et al presented a high-speed subnanometre interferometry using an improved three-mode heterodyne interferometer to extend the measurable target speed without increasing the heterodyne beat frequency of light source [9]. Köchert P. et al adopted a commercial FPGA-based ADC card with VME-bus interface to implement a phase-evaluation method to resolve displacements of a picometer [10]. Eom T. B. et al described a phase-encoding electronics including the phase demodulating electronics and the nonlinearity compensating electronics [11]. These techniques, however, demand a trade-off between the maximum measurable velocity and the displacement resolution [12]. To address the conflict of high-speed and high-resolution measurements, Yim N. B. et al presented a dual mode phase measurement for heterodyne interferometry whose main idea is combining the high bandwidth frequency counter and the high resolution phase meter with mutually complementary characteristics. Kim M.-S. et al proposed a two-way frequency-conversion phase measurement which employs frequency-mixing to improve resolution and detect dual-direction Doppler-shifts to solve the measurement speed decreasing problem [13]. In a lock-in amplifier (i.e., mixing the measurement signal down to DC), the measurement signal is mixed with two phase-quadrature signals of the reference signal. The phase can be obtained by taking the arctangent of the ratio of two DC components with phase information of the measurement and reference signals. In a real system, the two DC components become much more distorted by the unequal gain and offset of the electronic circuit and lack of quadrature of 90° phase shifter [11]. The frequency mixing approach is to mix interference signal down to an intermediate frequency in order to improve resolution. The phase is achieved by filling pulses on the basis of zero-crossings. In order to realize high-speed and high-resolution displacement measurement with higher anti-interference and measurement stability, a novel phase measurement method including rising-edge locked signal processing and digital frequency-mixing is proposed for laser heterodyne interferometry in this paper. The signal processing realization of the method is described in detail and several experiments were performed to demonstrate its feasibility. 2. Principle of heterodyne interferometer Figure 1 shows the schematic of a laser heterodyne interferometer displacement measurement system. A stabilized He-Ne laser emits an orthogonally linearly polarized beam with different frequencies of ƒ1 and ƒ2. The laser beam is split into two parts by a beam-splitter (BS). One
#181630 - $15.00 USD
(C) 2013 OSA
Received 12 Dec 2012; revised 4 Feb 2013; accepted 7 Feb 2013; published 15 Feb 2013
25 February 2013 / Vol. 21, No. 4 / OPTICS EXPRESS 4639
passes through an analyzer (A1) and projects onto the first high-speed photodetector (D1), then generates the reference signal whose frequency is ƒ1- ƒ2. Another passes through BS and then is split into two beams by a polarizing beam-splitter (PBS), the two beams are sent to the fixed reflector and the moving reflector separately and finally recombined at the second high-speed photodetector (D2) after passing another analyzer (A2), generating the measurement signal with the frequency of ƒ1-ƒ2 ± Δƒ2. Δƒ2 is the Doppler-shift frequency induced by the movement of the moving reflector with the speed of ν. The reference and measurement signals are transmitted to the phase measurement unit to execute signal processing. According to the Doppler Effect, the velocity of the moving reflector can be expressed by
ν (t ) =
Δf 2 (t ) ∗ λ2 2n
(1)
where λ2 is the wavelength of laser source, n is the refractive index of air along the path of light propagation. From Eq. (1), the displacement of the moving reflector can be derived by L (t ) =
λ2
2n
t
0
Δf 2dt = (N + ε )
λ2
(2)
2n
where N is the integer fringe number of λ2/2 and ε is the fraction fringe number of λ2/2. Fixed Reflector
ƒ1
BS
ƒ1ƒ2 Laser
D2 A1 D1
ƒ2
ν
A2
ƒ1 ƒ'2
ƒ1 ƒ2
PBS
ƒ'2
Moving Reflector
Phase measurement
Fig. 1. Schematic of laser heterodyne interferometer displacement measurement system.
3. Interference signal processing method The phase measurement method is shown in Fig. 2. It is mainly composed of the high-speed and high-resolution signal processing modes. During actual displacement measurement, the high-speed mode (HSM) is employed to implement integer fringe counting. A velocity threshold value is set. When the moving reflector’s velocity is lower than the velocity threshold value, the high-resolution mode (HRM) will be activated to carry out high-resolution displacement measurement. The reference and measurement signals detected by high-speed photodetectors (D1, D2) are converted into square wave signals and then transmitted to the processing board through differential transmission wires that have high anti-disturbance. After split by the power splitters separately, each of the signals reaches to HSM and HRM. HSM includes the signal conditioning module, the rising-edge locked module and the integer fringe counting module. HRM consists of the frequency mixing module, the signal preprocess module, the rising-edge locked module, the fraction fringe counting module and the velocity detection module. Note that the mixing input signals are digital signals different from traditional mixing method with analogue signals. The rising-edge locked module, the integer fringe counting module, the fraction fringe counting module and the velocity detection module are completed by using a #181630 - $15.00 USD
(C) 2013 OSA
Received 12 Dec 2012; revised 4 Feb 2013; accepted 7 Feb 2013; published 15 Feb 2013
25 February 2013 / Vol. 21, No. 4 / OPTICS EXPRESS 4640
FPGA chip. The processing data of HSM and HRM are transmitted to the computer through the serial interface to give out the measurement result. High-speed mode (HSM) Processing Board
Ref.Signal
Power splitter
D1 ƒ1 - ƒ2
Signal conditioning
Rising edge locked
Differential Transmission
Mea.Signal
Rising edge locked
Signal Preprocess
Digital oscillator Power splitter
D2 ƒ1- ƒ2±Δƒ2
Integer counting
FPGA
Fraction
Serial Trans
· counting ·
Computer
Velocity detection Frequency mixing module
High-resolution mode (HRM) Fig. 2. The block diagram of the phase measurement processing.
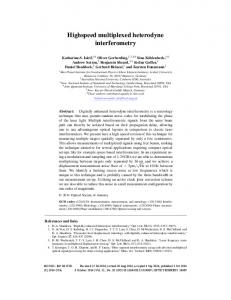
The approaches mentioned above, that is, differential signal transmission, digital frequency mixing and rising-edge locked, constitute the heterodyne interferometric signal processing that can improve the measurement accuracy and enhance anti-interference and measurement stability. 3.1 Rising-edge locked signal processing The rising-edge locked signal processing method is shown in Fig. 3. The square wave of the reference signal or the measurement signal is shown as the Sig.Original. When observing the Sig.Original magnified by an oscilloscope, its rising-edge is not ideal: one is the low steepness of the rising-edge as shown in Fig. 3(a). This will result in inaccurate signal measurement trigger point, which will affect the accuracy of the fraction phase measurement. In other hand, there is multi-rising-edge phenomenon due to burr, harmonic interference as shown in Fig. 3(b). This will cause integer fringe counting error. To address these problems, we present a rising-edge locked signal processing method in order to improve the quality of the Sig.Original. The detailed realization of the method is that the rising-edge of the Sig.Original is locked with a high frequency clock signal (Clk), that is, at the trigger moment of the rising-edge, the Sig.Original is modulated into a fixed-width (τ) high level narrow pulse signal shown as Sig.Locked.
Sig.Original …
…
(a)
…
(b)
Low steepness
Multi-rising-edge
Clk …
Sig.Locked
…
…
τ …
…
…
Fig. 3. Schematic of rising-edge locked signal processing
#181630 - $15.00 USD
(C) 2013 OSA
Received 12 Dec 2012; revised 4 Feb 2013; accepted 7 Feb 2013; published 15 Feb 2013
25 February 2013 / Vol. 21, No. 4 / OPTICS EXPRESS 4641
This method not only can improve the steepness of the rising-edge, but also can remove the error triggers caused by noises in fringe counting. In addition, this method neither changes signal’s period nor induces time delay of the rising-edge. So it does not affect the subsequent phase measurement and then can guarantee the accuracy and stability of integer and fraction fringe counting. 3.2 Digital frequency mixing processing Traditional frequency mixing for heterodyne interference signal is to deal with two analogue sinusoidal signals. One, heterodyne interference signal, is the beat frequency signal detected by photodetector. The other is the mixing base signal derived from an external oscillator. In this analogue frequency mixing approach, a shortcoming is that using analogue signal transmission of the beat frequency signal often induces a nonstandard sinusoidal signal containing higher harmonic wave stemming from laser source and noises from transmission path. To overcome this shortcoming, we present a digital frequency mixing method. Firstly, the interference signal detected by photodetector is converted into square wave signal by comparator. And then the signal is transmitted into a frequency mixing chip by using differential mode. Such differential signal transmission can effectively reduce the external noise in signal transmission. Secondly, the mixing base signal is provided by FPGA. This base signal is not only stable but also can be precisely synchronous with the internal clock of FPGA. Therefore, the digital frequency mixing method has the merits of high anti-interference and fine stability. The theoretical analysis of this digital frequency mixing method is as follows. According that a square wave signal can be expressed with series of cosine harmonic wave signals by Fourier Series Expansion, the interference signal transmitted into the digital frequency mixing module is given by nπ ) cos(n ∗ 2π f t ) 2 n =1 (3) 2E 1 1 1 [cos(2π f t ) − cos(3 ∗ 2π f t ) + cos(5 ∗ 2π f t ) − cos(7 ∗ 2π f t ) + ...] = π 3 5 7
f (t ) =
2E
π
∞
1
n sin(
where f is the beat frequency of laser source, E is the amplitude of the beat frequency signal. The mixing base signal generated from FPGA is set to have a frequency difference of 10 KHz with the interference signal. It is expressed by f ′(t ) =
2E
π
∞
1
n sin( n =1
nπ ) cos[n *2π (f − 10k)t ] 2
2E 1 1 cos[2π (f − 10k)t ] − cos[3*2π (f − 10k)t ] + cos[5*2π (f − 10k)t ] (4) π 3 5 1 − cos[7*2π (f − 10k)t ] + ... 7 The signal output from the digital frequency mixing module can be expressed by =
f ′′( t ) = f ( t ) ∗ f ′( t ) = F- [....] + F+ [....]
= F [ f (10k), f (2 f + 10k), f (4 f + 10k), f (6 f + 10k),...,
(5)
f ( −2 f + 30k), f (30k), f (2 f + 30k), f (4 f + 30k), f (6 f + 30k),..., f ( −4 f + 50k), f ( −2 f + 50k), f (50k), f (2 f + 50k), f (4 f + 50k),...] + F+ [....]
#181630 - $15.00 USD
(C) 2013 OSA
Received 12 Dec 2012; revised 4 Feb 2013; accepted 7 Feb 2013; published 15 Feb 2013
25 February 2013 / Vol. 21, No. 4 / OPTICS EXPRESS 4642
where F-[….] is the subtracted frequency component set and F+[….] is the added frequency component set. The frequency component of 10 KHz in Eq. (5) can be obtained by low-pass filtering of the signal output from the digital frequency mixing module. It is the expected frequency-reduced signal that is used to realize high-resolution phase measurement in HRM. 4. Implementation of the interference signal processing The implementation of the proposed phase measurement method includes three parts: one is the high-speed signal processing module that is corresponding to integer fringe counting, the second is the high-resolution signal processing module that is corresponding to fraction fringe counting, and the third is combination of the integer and fraction fringe counting. The method is mainly implemented with a FPGA chip (EP2C20Q240C8, Altera Co.), which internal clock frequency is up to 400MHz. In the high-resolution signal processing module, a double balanced-mixer (NE602, Philips Semiconductors) is applied to realize digital frequency mixing. 4.1 Implementation of integer fringe counting The integer fringe counting method is shown in Fig. 4(a). It is realized by subtracting the counting numbers of the reference and measurement signal pulses. Two high speed counters are used to simultaneously count the numbers (denoted as NRef, NMea) of two input signals (Ref.Signal and Mea.Signal) after rising-edge locked processing, respectively. The difference of NRef-NMea represents the measured integer fringe number. Ref.Signal
…
…
Mea.Signal NRef =1 NMea=1
2 2
3 3
…
k n
k+1 n+2
…
k+2 n+4
(a) Schematic of integer fringe counting method
Ref.Signal
50MHz ×8 oscillator Mea.Signal
Rising-edge locked module Counting offset 400MHz
Rising-edge locked module
Hispeed Counter1
overflow compensating module Hispeed Counter2
NRef Synchronous (C1-C2)*NMax
subtracting
ΔN
module NMea
(b) Implement of integer fringe counting
Fig. 4. Schematic of the high-speed signal processing module.
The implement of the integer fringe counting method with FPGA is shown in Fig. 4(b). The PLL IP-core in FPGA generates a 400MHz high frequency internal clock by multiplying the 50MHz external active oscillator by a factor of 8 and the input 50MHz signal is synchronized by the PLL with the FPGA. This internal clock is used to lock the rising edges of Ref.Signal and #181630 - $15.00 USD
(C) 2013 OSA
Received 12 Dec 2012; revised 4 Feb 2013; accepted 7 Feb 2013; published 15 Feb 2013
25 February 2013 / Vol. 21, No. 4 / OPTICS EXPRESS 4643
Mea.Signal and the narrowest width of the locked high level pulse is up to 1.25ns. Counter1 and Counter2 are 32-bit high speed counters and separately count the pulse numbers (NRef, NMea) of the reference and measurement signals. The maximum counting value is Nmax = 232. When the counting number NRef ≤ Nmax or NMea ≤ Nmax, the counting number directly reaches to the synchronous subtracting module. If the counting number NRef > Nmax or NMea > Nmax, the overflow pulse will be generated and reaches to the overflow compensating module. Ci (i = 1, 2) is the counting number of overflow pulse with respect to Counter1 and Counter2, respectively. The measured displacement corresponding to the integer fringes can be expressed by
λ
λ
= [ N Ref − N Mea + (C 1 − C 2) ∗ N Max ] ∗ (6) 2n 2n Suppose that the beat frequency of the interference signal is 2.26MHz, the overflow time of 32-bit counter is NMax/2260000/60 ≈31.67 minutes, the related overflow time of the overflow compensating module is 31.67/60*28 ≈135 hours,about 5 days. Moreover, we adopt a counting offset function between C1 and C2 in the overflow compensating module in order to eliminate counting overflow. The reference signal pulse is chosen as the trigger signal of the synchronous-subtracting module. This solves the problem of one integer counting error that results from using other trigger signals. In HSM, when the laser wavelength is 632.99nm and a single-pass interferometer setup is used, considering the original beat frequency is 2.26 MHz, so the limited measurable velocity for the negative Doppler-shift is 0.7153 m/s, and the maximum measurable velocity for the positive Doppler-shift is depending on the bandwidth of photodetector with a frequency response up to 10 MHz. Then, the maximum frequency bandwidth of positive Doppler-shift induced by the measured object is 7.74 MHz, which corresponds to the maximum measurable velocity of 2.4m/s. L = ΔN ∗
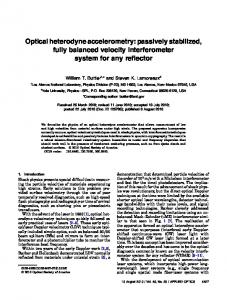
4.2 Implementation of fraction fringe counting The fraction fringe counting method is shown in Fig. 5. It is realized by filling pulse counting approach. When the rising edge of Ref.Signal arrives, a 16-bit high speed counter starts counting the high frequency clock (CLK.400MHz) until the adjacent rising edge of Mea.Signal reaches. The counted value is denoted as nPhase. Meanwhile, the filling pulse numbers denoted as nRef and nMea in one period of Ref.Signal or Mea.Signal are also measured by two 16-bit high speed counters, respectively. Then, the phase difference between the reference and measurement signals in stationary state is given by n Phase ∗ 360 (7) n Ref In practice, the 400 MHz high frequency clock from the FPGA is used to fill pulse phase measurement. For the 10 KHz signal output from the digital frequency mixing module, the maximum filling number is up to 40000. As a result, this can achieve a phase resolution of 0.009° that corresponds to the displacement resolution of 0.0079nm. Thus, the fraction fringe counting method can realize high resolution displacement measurement. In addition, the velocity of the measured object can be derived by Δϕ =
v (t ) =
λ f CLK f CLK ( − ) 2n n Mea n Ref
(8)
where fCLK is 400 MHz. In HRM, because the frequency of the signal obtained by frequency mixing is 10 KHz, this corresponds to the limited target speed of 3.2 mm/s. Therefore, the velocity threshold value
#181630 - $15.00 USD
(C) 2013 OSA
Received 12 Dec 2012; revised 4 Feb 2013; accepted 7 Feb 2013; published 15 Feb 2013
25 February 2013 / Vol. 21, No. 4 / OPTICS EXPRESS 4644
(Vth) used to control the status of HRM should satisfy Vth < 3.2 mm/s to guarantee the correctness of measurement result in low speed motion displacement measurement. Clk.400M
… Ref.Signal
…
…
…
…
Mea.Signal
NPhase
NRef
(a) Schematic of the fraction fringe counting method
Ref.Signal
Frequency mixing
Base signal
Mea.Signal
Frequency mixing
Rising edge locked
Ref.Signal’s Period detecting
Frequency reduction
Rising edge locked
NRef
400MHz clock
Phase difference detecting Mea.Signal’s Period detecting
NPhase
NMea
(b) Implement of the fraction fringe counting
Fig. 5. Schematic of the high-resolution signal processing module
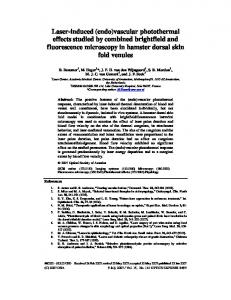
4.3 Combination of the integer and fraction fringe counting For HSM and HRM described above, when the velocity of the measured object is lower than the Vth, the signal processing of the two modes are both in working state. Thus, it is essential to combine the integer and fraction fringe counting to realize large displacement measurement with high resolution. The combination of the integer and fraction fringe counting is shown in Fig. 6. As shown in Fig. 6(a), HSM.Ref and HSM.Mea represent the signal waves used in HSM, HRM.Ref and HRM.Mea represent the signal waves used in HRM. Incrementing of the integer fringe counting should occur theoretically in the coincident position of the rising edges of HSM.Ref and HSM.Mea, which are the positions of N = 1, 2,…, n. However, the position of incrementing is delayed a phase of Δϕd caused by different signals transmission and processing circuits of the two modes. The positions are actually in those of N′ = 1, 2,…, n.
#181630 - $15.00 USD
(C) 2013 OSA
Received 12 Dec 2012; revised 4 Feb 2013; accepted 7 Feb 2013; published 15 Feb 2013
25 February 2013 / Vol. 21, No. 4 / OPTICS EXPRESS 4645
The compensation of integer fringe counting is shown in Fig. 6(b). According to Eq. (7), Δϕ is the phase difference between the reference and measurement signals. When 0 Δϕd , the integer number N should be added 1 in order to use Eq. (10) correctly. The key to implement phase compensation is to obtain Δϕd that can be calculated by a large number of statistical measurement experiments. And the experimental results have verified the feasibility of the compensation method given in the combination of integer and fraction displacement measurement experiments in section 5.2.2. HSM.Ref
… HSM.Mea
…
N=2
N=1 HRM.Ref
N=n
N=n-1
…
HRM.Mea
… Δφd
N′=1
Δφd
N′=2
Δφd
N′=n-1
Δφd
N′=n
(a) Phase delay between integer and fraction fringe counting 0°
Δφd
90°
180°
I
II
N′=N
N′=N-1
270°
360°
(b) Compensation of integer fringe counting
Fig. 6. Schematic of the combination of integer and fraction fringe counting
5. Experiments and results 5.1 Resolution and speed tests A function generator with a bandwidth of 100MHz and resolution of 0.01° (AFG3102, Tektronix, USA) is used to verify the resolution and maximum measurement speed of the phase measurement method proposed above. For the resolution test, the function generator outputs two square wave signals with same frequency of 10KHz to simulate the reference and measurement signals in HRM. The developed phase measurement unit determines the phase difference between the two square wave signals with the sample time of 5s. The experimental
#181630 - $15.00 USD
(C) 2013 OSA
Received 12 Dec 2012; revised 4 Feb 2013; accepted 7 Feb 2013; published 15 Feb 2013
25 February 2013 / Vol. 21, No. 4 / OPTICS EXPRESS 4646
result is shown in Fig. 7. The result shows that the phase difference fluctuates with 0.009° that corresponds to a displacement resolution of 0.008nm in a single-pass interferometer. For the speed test, firstly, the function generator outputs two sine signals with same frequency of 2.2078MHz to simulate the reference and measurement interference signals. Then, we change the frequency of one sine signal to imitate the Doppler-shift. The developed phase measurement unit determines the counting number of Nref and Nmea in HRM and HSM. According to the Eq. (8), the velocity can be calculated as shown in Table 1. This result shows that the maximum measurable velocity can reached up to 2.4m/s in correspondence to a single-pass interferometer. measurement data
Phase difference (°)
0.099
0.096
0.093
0.090
0
200
400
600
800
1000
Sample Time (s)
Fig. 7. Resolution test result Table 1. Speed test result Mea. Signal (MHz)
Ref. Signal (MHz)
Doppler-shift (MHz)
Velocity (m/s)
2.2078
2.2078
0.000
0.0000000
2.2088
2.2078
0.001
0.0003153
2.2098
2.2078
0.002
0.0006325
2.2108
2.2078
0.003
0.0009524
2.2118
2.2078
0.004
0.0012670
2.2128
2.2078
0.005
0.0015850
2.2138
2.2078
0.006
0.0018983
2.2148
2.2078
0.007
0.0022171
2.2158
2.2078
0.008
0.0025278
2.2168
2.2078
0.009
0.0028466
2.2178
2.2078
0.010
0.0031611
3.2078
2.2078
1.000
0.3161301
4.2078
2.2078
2.000
0.6331755
5.2078
2.2078
3.000
0.9498097
9.2078
2.2078
7.000
2.2147080
9.8078
2.2078
7.600
2.4044690
#181630 - $15.00 USD
(C) 2013 OSA
Received 12 Dec 2012; revised 4 Feb 2013; accepted 7 Feb 2013; published 15 Feb 2013
25 February 2013 / Vol. 21, No. 4 / OPTICS EXPRESS 4647
5.2 Displacement test experiments To verify the proposed phase measurement method in displacement measurement, an experimental setup is shown in Fig. 8. The configuration of laser heterodyne interferometer is composed of two cube corner prisms, a quarter waveplate and a reflecting plane mirror (M). The laser source is a dual-frequency stabilized He-Ne laser (5517B, Agilent Co., USA) which emits a pair of beams with the vacuum wavelength of λ = 632.991372nm and the frequency difference is 2.26MHz. The refractive index of air n was detected by using an air sensor (10751C, Agilent Co., USA) to compensate the laser wavelength. Two high-speed photodetectors (PT-1303C, Beijing Pretios Co., China) are used to receive the reference and measurement signals and their maximum response frequency are 10MHz. R1 BS He-Ne Laser A1 D1 ƒ1, ƒ2
v
PBS
D2 A2
M
Stage
λ/4 R2
Controller
ƒ1 ƒ2
Phase measurement unit
Computer
BS: beam splitter, PBS: polarizing beam splitter, D1, D2: photodetector R1, R2: cube corner prism, M: plane mirror, A1, A2: analyser
Fig. 8. The experimental setup
5.2.1 Stability test As the experiment begins, M was moved to the quarter waveplate as nearly as possible to shorten the optical path exposed in the air. The stage was in static status. And the power of the stage driver and controller was shut down to reduce the interference. Then the phase measurement unit started to work to detect the phase difference between the reference and measurement signals in real time. The experimental results are shown in Fig. 9. From Fig. 9, within 1.3 hour, the integer fringe counting value keeps zero and the fraction displacement value has small changes with peak-peak error of 5.2nm. The reasons for the small changes are the influences of the environment disturbance, surrounding vibration and the unstable frequency difference of laser source. The results show that the developed phase measurement unit can sensitively detect these small changes.
#181630 - $15.00 USD
(C) 2013 OSA
Received 12 Dec 2012; revised 4 Feb 2013; accepted 7 Feb 2013; published 15 Feb 2013
25 February 2013 / Vol. 21, No. 4 / OPTICS EXPRESS 4648
3
Experiment Data
Experiment Data 2
) m n (
1
Measurement Displacement
0.5
0.0
-0.5
0
-1
-2
-3
-1.0 0.0
0.2
0.4
0.6
0.8
1.0
1.2
1.4
-0.2
0.0
0.2
Sample Time (hour)
(a). Integer counting number
0.4
0.6
0.8
Sample Time (hour)
1.0
1.2
1.
(b). Fraction displacement
Fig. 9. Stability experimental results
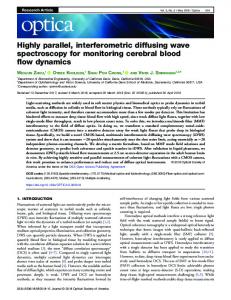
5.2.2 Experiment of combination of integer and fraction counting In this experiment, the used stage is a nano-positioning stage (P-752.1CD, Physik Instrument Co., Germany) whose movement range is 15μm with a resolution of 0.1nm. During the measurement, M was moved a travel of 2.5μm with the velocity of 0.01μm/s by the P-752.1CD stage, and the developed phase measurement unit measured the phase difference between the reference and measurement signals and recorded the integer and fraction fringe numbers in real time. The experimental results are shown in Fig. 10. Figure 10(a) shows the result of the integer counting number in HSM. The integer number is incrementing regularly with the increasing of the measured displacement and one step change is corresponding to 1/4 wavelength displacement. Figure 10(b) shows the result of fraction displacement in HRM. As was mentioned in section 4.3, there is a phase delay between the two signal processing modes. This caused that the measured displacement is discontinuous as shown in Fig. 10(c). Therefore, the compensation method proposed above is used to solve this problem. The compensated result is shown in Fig. 10(d). It shows that the measured displacement is continuous and correct. This verifies the effectiveness of the compensation method in combination of the integer and fraction fringe counting.
#181630 - $15.00 USD
(C) 2013 OSA
Received 12 Dec 2012; revised 4 Feb 2013; accepted 7 Feb 2013; published 15 Feb 2013
25 February 2013 / Vol. 21, No. 4 / OPTICS EXPRESS 4649
0.18
Measurement data
12
Fraction displacement (μm)
Integer counting number
16
8
4
0
0
20
40
60
80
100
Measurement data
0.12
0.06
0.00
0
120
20
Measurement displacement (μ )
Measurement data 2.0
1.5
1.0
0.5
0.0
0
20
40
60
80
100
120
Measurement displacement compensated (μ )
m 2.5
m
40
60
80
100
120
Sample time (s) (b) Fraction displacement
Sample time (s) (a) Integer fringe counting value 2.5
Measurement data
2.0
1.5
1.0
0.5
0.0
0
20
40
60
80
100
120
Sample time (s)
Sample time (s) (c) Displacement measurement result
(d) Compensated displacement
Fig. 10. Experimental results of combination of integer and fraction fringe counting
5.2.3 Displacement measurement experiments The first experiment is millimeter displacement test. The used stage is a linear stage (M-521.DD, Physik Instrument Co., Germany) whose movement range is 200mm with a resolution of 0.1μm. In this experiment, M was moved a travel about 200mm with the velocity of 5mm/s and the step increment of 1mm. The experimental result is shown in Fig. 11 and summarized in Table 2. The second experiment is micrometer displacement test. M was moved a travel about 15μm with the velocity of 2μm/s and the step increment of 1μm provided by the P-752.1CD stage. The experimental result is shown in Fig. 12 and summarized in Table 3. The third experiment is nanometer displacement test. M was moved a travel about 500nm with the velocity of 10nm/s and the step increment of 5nm provided by the P-752.1CD stage. The experimental result is shown in Fig. 13 and summarized in Table 4. The fourth experiment is repeated displacement measurement test. M was moved a travel of 15μm with an increment of 1μm provided by the P-752.1CD stage. The positions at 15 fixed points were measured 20 times. The experiment result is shown in Fig. 14. The dot represents the standard deviation of the position error at each point. The Maximum deviation is 5.42nm, the Minimum deviation is 0.75nm, and the average deviation is 3.02nm. Table 2. Experimental result of millimeter displacement measurement Parameter Result
#181630 - $15.00 USD
(C) 2013 OSA
Peak-peak error (μm) 2.68
Maximum error (μm) 1.41
Minimum error (μm) −1.27
Average error (μm) −0.004
Standard deviation (μm) 0.48
Received 12 Dec 2012; revised 4 Feb 2013; accepted 7 Feb 2013; published 15 Feb 2013
25 February 2013 / Vol. 21, No. 4 / OPTICS EXPRESS 4650
Experimental data Linear fit of the data Deviations
200
2
Deviation of displacements (μm)
Measurement displacement (mm)
250
150 0 100
50 -2 0
0
50
100
150
200
250
Displacement of the M-521.DD stage (mm)
Fig. 11. Experimental result of millimeter displacement measurement. Table 3. Experimental result of micrometer displacement measurement
Measurement displacement (μm)
16
Minimum error (nm) −3.01
Average error (nm) 0.09
Standard deviation (nm) 1.72 10
Experimental data Linear fit of the data Deviations
5m
12
n
8
0
4 -5
Deviation of displacements (
Result
Maximum error (nm) 3.08
)
Peak-peak error (nm) 6.09
Parameter
0 0
4
8
12
-10 16
Displacement of the P-752.1CD stage (μm)
Fig. 12. Experimental result of micrometer displacement measurement. Table 4. Experimental result of nanometer displacement measurement Parameter Result
#181630 - $15.00 USD
(C) 2013 OSA
Peak-peak error (nm) 6.07
Maximum error (nm) 3.80
Minimum error (nm) −2.27
Average error (nm) 0.34
Standard deviation (nm) 1.43
Received 12 Dec 2012; revised 4 Feb 2013; accepted 7 Feb 2013; published 15 Feb 2013
25 February 2013 / Vol. 21, No. 4 / OPTICS EXPRESS 4651
500
m n 5
400
300
0
200 -5
100
)
10
Experimental data Linear fit of the data Deviations
Deviation of displacements (
Measurement displacement (
m n
)
600
0 100
200
300
400
m n
0
Displacement of the P-752.1CD stage (
-10 600
500
)
Fig. 13. Experimental result of nanometer displacement measurement.
Standard Deviation (nm)
6
4
2
0
0
2
4
6
8
10
12
14
16
Displacement of the P-752.1CD stage (μm)
Fig. 14. Experimental result of repeated displacement measurement.
6. Conclusion A laser heterodyne interferometric signal processing method based on rising edge locking with high frequency clock signal is proposed in this paper. The principle and implementation of the method are presented in detail and an experiment setup of laser heterodyne interferometer was constructed to verify the method for displacement measurement. The resolution and speed tests show that the method can realize a displacement measurement resolution up to 0.008nm in a single-pass interferometer and the maximum measurement velocity is up to 2.4m/s. The stability experiment shows that the method can measure displacement steadily and work long hours. The integer and fraction displacement measurement experiment shows the feasibility of the compensation method in the combination of the integer and fraction fringe counting. The millimeter, micrometer, nanometer and repeatability displacement experiments show that the method can be used to realize a large displacement measurement with nanometer accuracy. All these indicate that the proposed method can be applied in heterodyne interfereometry to realize precision displacement measurement with high-speed and high-resolution. Acknowledgment This work was supported by the National Natural Science Foundation of China (NSFC) under grants No. 90923026 and No. 51205365, the Zhejiang Provincial Natural Science Foundation of China (ZJNSF) under grant No. Y1110495 and the Research Foundation of the Education Department of Zhejiang Province, China under grants No. ZD2007004 and No. Y201019094. We would like to acknowledge the reviewers for their helpful suggestions in revising our manuscript. We would especially like to acknowledge one of them, Reviewer 1, for his carefully reviewing this manuscript and giving us so much informative advice about implementation of our method and experimental design.
#181630 - $15.00 USD
(C) 2013 OSA
Received 12 Dec 2012; revised 4 Feb 2013; accepted 7 Feb 2013; published 15 Feb 2013
25 February 2013 / Vol. 21, No. 4 / OPTICS EXPRESS 4652