Laser vibrometer based on optical- feedback-induced frequency modulation of a
single-mode laser diode. P. A. Roos, M. Stephens, and C. E. Wieman.
Laser vibrometer based on opticalfeedback-induced frequency modulation of a single-mode laser diode P. A. Roos, M. Stephens, and C. E. Wieman
We describe a sensitive and inexpensive vibrometer based on optical feedback by diffuse scattering to a single-mode diode laser. Fluctuations in the diode laser’s operating frequency that are due to scattered light from a vibrating surface are used to detect the amplitude and frequency of surface vibrations. An additional physical vibration of the laser provides an absolute amplitude calibration. The fundamental bandwidth is determined by the laser response time of roughly 1029 s. A noise floor of 0.23 nmyHz1y2 at 30 kHz with 5 3 1025 of the incident light returning is demonstrated. This instrument provides an inexpensive and sensitive method of noncontact measurement in solid materials with low or uneven reflectivity. It can be used as a vibration or velocity sensor. Key words: Vibrometer, optical sensor, noncontact measurement, surface displacement.
1. Introduction
The laser vibrometer described in this paper is made from a $20 laser diode; less than 0.005% of the incident light is required to return to the laser. A sensitivity of 0.23 nmyHz1y2 at 30 kHz has been measured with this small amount of light. Current nondestructive optical methods, such as those applied to quality assurance, predictive maintenance, and acoustic research,1– 6 are limited by the need for moderately to highly reflective surfaces,7,8 constraints on the distance to the measurement surface,9 and expensive components such as Bragg modulators or frequency stabilized lasers.10 This vibrometer provides an inexpensive, sensitive alternative to displacement detection and requires extremely low feedback power. In this device the signal arises from the phase relationship between the light leaving the laser and the light returning from the surface of interest, which is similar to other laser vibrometer measurement techniques.8,10 –13 By using induced frequency changes as a signal, this sensor takes advantage of
P. A. Roos and C. E. Wieman are with the Department of Physics and Joint Institute for Laboratory Astrophysics, University of Colorado, Boulder, Colorado 80309. M. Stephens is with the National Institute of Standards and Technology, Boulder, Colorado 80303. Received 5 February 1996; revised manuscript received 12 April 1996 6754
APPLIED OPTICS y Vol. 35, No. 34 y 1 December 1996
the extreme sensitivity of the lasing frequency of single-mode laser diodes to optical feedback.14 Near-infrared light from a laser diode is directed onto a vibrating object. The object scatters a small fraction of light back into the laser diode cavity. The optical feedback alters the frequency of the emitted laser light. A small portion of the light is diverted to a Fabry–Perot ~FP! cavity, where changes in the laser operating frequency ~LOF! are analyzed. The LOF changes provide information about the amplitude and frequency of the surface vibrations. Also, they can be used to determine the velocity of the test object. The effects of optical feedback on the LOF depend not only on the motion of the object but also on the backscattered power and the distance to the object. Therefore a calibration mechanism was developed to isolate the effects of surface motion on the LOF. This was done by mounting the laser diode onto a bimorph piezoelectric transducer ~PZT! and translating it back and forth with a calibrated amplitude and frequency. This calibration mechanism is uniquely applicable to a laser diode because the laser is so small. The vibrometer described here provides an inexpensive, noncontact method for measuring vibrations in solid materials with low reflectance. Its sensitivity is higher than that of sensors that use laser-diodefeedback interferometry,12 and, while not as good as some commercial laser Doppler vibrometers, it is less
expensive and operates reliably with one tenth the scattered light.
vt, then
S
Dv 5 A sin
2. Theory of Operation
D
4pvt 1g , l
(5)
Owing to their high-gain active medium, low-Q optical cavity, and extraordinarily small size, semiconductor lasers are extremely sensitive to optical feedback. When an object is placed in the beam path, causing external feedback, an external cavity is formed between the object and the back facet of the laser, altering the gain of the system. This results in a slight frequency shift of the emitted light. In the case of weak optical feedback ~the operating condition of this sensor! the external feedback can be considered a small perturbation to the laser gain. The effects of weak optical feedback on the LOF are described by the Lang–Kobayashi equations,14 which result in the relation
where g 5 4pL0yl is a constant phase. The velocity can be extracted by measurement of the modulation frequency of the LOF. For example, with a laser wavelength of 830 nm, an object moving at 1 mys would produce a 2.4-MHz modulation in the laser frequency. This modulation, and hence the velocity, can be accurately determined with a simple counter. This technique measures only the magnitude of the velocity normal to the laser and not the sign of the motion. Detecting small vibrations is somewhat more complicated. For a surface vibrating at a frequency vf and amplitude b ,, L,
Dvtext 5 2C sin@f 1 v0text 1 Dvtext#,
L 5 L0 1 b sin~vft!,
(1)
where v0 is the LOF in the absence of optical feedback, Dv is the resulting change in LOF, text is the round-trip time for photons returning from the external surface, and f 5 tan21 a; here a is the linewidth enhancement factor,15 a constant with typical values16 ranging from 6 to 10. C is given by
where L0 is the initial distance to the surface. If 4pbyl ,, 1, Eq. ~4! can be written as 4pb sin~vf t! l
Dv 5 A
F G S DF S D S D G S DF S D S D G S D S DS D
5 A sin
4pL0 4pb 1 sin~vf t! l l
where R is the laser facet reflectance ~typically 3% for a commercial, antireflection-coated laser or 30% for an uncoated laser!, tL is the round-trip time for photons in the diode laser cavity ~typically 10211 s!, and fext is the fraction of power reflected back into the laser cavity; fext will depend on the reflectance of and the distance to the test surface. Expanding Eq. ~1! for small Dv yields
5 A sin
4pL0 l
C Dv < 2 cos~f 1 v0text!. text
5 A sin
SD
1 2 R fext C5 tL R
1y2
~1 1 a2!1y2text,
(2)
(3)
The round-trip photon time text between the laser and the test surface and the LOF v0 can be written as text 5 2Lyc and v0 5 2pcyl, where c is the speed of light, L is the distance between the laser and the test surface, and l is the unperturbed wavelength of the laser diode. Since f is a constant-phase factor it can be set to 2py2 for simplicity, and Eq. 3 can be written
F G
4pL Dv > A sin , l
(4)
where A 5 2~cy2L! C. If L is large relative to its variation, then the amplitude A is approximately constant, and the laser frequency is modulated sinusoidally with changes in L. This modulation can be used to measure velocity or detect small vibrations. For a simple velocity measurement, when the external surface moves with velocity v, the frequency of the change in LOF determines the velocity. For example, if L 5 L0 1
(6)
4pb 4pb 1 2J2 cos~2vf t! l l
J0
4pb 4pb 2J1 sin~vf t! l l
1 . . . 1 A cos 1 2J3
4pb sin~3vf t! 1 . . . l
4pL0 4pL0 1 cos l l
4pb sin~vf t!. l
(7)
Here Jn is the nth-order Bessel function and the approximation J1 ~x! ' xy2 has been used. Since L0 is constant, Dv varies sinusoidally in time with angular frequency vf and amplitude
S D
4pL0 4pb . cos l l
A9 5 A
(8)
Note that the approximation leading to Eqs. ~7! and ~8! requires that b ,, ly4p. For small vibration amplitudes the signal is linear with b, as predicted by Eq. ~7!; for larger amplitudes the signal appears sinusoidal. Inspection of Eq. ~4! with L0 set to nly8 for simplicity ~n a positive integer! shows that the signal is maximized for b 5 ly8, or for the peak-topeak vibration amplitude equal to ly4. Largeramplitude vibrations result in a sinusoidally varying signal. While in principle the vibration of the external surface could be measured using only Eq. ~8!, in practice there are two difficulties with this simplified view. 1 December 1996 y Vol. 35, No. 34 y APPLIED OPTICS
6755
First, the amplitude of the LOF modulation given by Eq. ~8! depends on the distance L0. If 4pL0yl ; npy2, where n 5 1, 3, 5 . . . , the LOF modulation will be small. On the other hand, if 4pL0yl ; np ~n 5 1, 2, 3 . . . !, the signal will be maximized. Therefore if the distance L0 drifts by more than ly2, the signal can vary from its maximum value to zero. Second, the LOF modulation amplitude A9 depends on both the amplitude of vibration and the amount of light returning to the diode laser. The signal from an object with a small vibration amplitude but with large feedback power is indistinguishable from that of an object with a large vibration amplitude but small feedback power. A calibration mechanism was devised to determine the vibration amplitude independently of the feedback power and drifts in L0. Physical vibration of the laser, with a known amplitude and frequency of motion, was used to produce a calibration LOF modulation. The response of the LOF to a vibrating external object relative to the stationary laser is identical to the response when the laser vibrates relative to a stationary external object. Hence the laser vibration causes an LOF modulation with an amplitude determined by the feedback power, the region of modulation on the LOF curve, and a known amplitude of laser vibration. If the object vibrates simultaneously with but at a different frequency than the calibration motion of the laser, then a LOF modulation corresponding to the same feedback power and distance L0 but a different and unknown vibration amplitude will be produced. The relative amplitudes of the two sine waves therefore depend only on their corresponding vibration amplitudes. Because the signal at the calibration frequency ~the frequency at which the laser is being vibrated! corresponds to a known vibration amplitude, the ratio of the amplitudes can be used to determine the vibration amplitude of the object. Both amplitudes will vary according to the amount of feedback power and with the drift of L0, but their ratio will remain constant. If the laser is vibrated with frequency vs and amplitude n so that L0 5 Lc 1 n sin~vst!,
(9)
then by inserting Eq. ~9! into Eq. ~7! and letting 4pnyl ,, 1, we find
S D S D S DF G S DS D S D
Dv 5 sin 1
4pLc 4pn 4pLc J0 1 cos l l l
4pb 4pLc sin~vf t! 2 sin l l
4pn sin~vst! l 2
4p 1 bn l 2
3 $cos@~vf 2 vs!t# 2 cos@(vf 1 vs!t]%
S D S D
1 sin
4pLc 4pn 2J2 cos~2vs! 1 . . . . l l
(10)
The calibration signal is necessary only for object vibration amplitudes smaller than ly2. Larger am6756
APPLIED OPTICS y Vol. 35, No. 34 y 1 December 1996
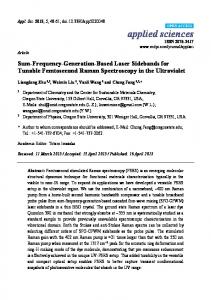
Fig. 1. Diagram of vibrometer. The laser diode and collimation lens were mounted in a closed box for temperature stability. The beam exited the box and was directed onto a calibrated PZT test surface. A small portion of the beam was sent to a FP cavity that was used as a frequency discriminator. The intensity of light reaching the test surface was controlled by a half-wave plate and polarizing beam splitter. A small portion of the light was sent to a p-i-n photodiode to monitor the intensity of light reaching the test surface.
plitudes correspond to more than one period of the sine wave; in that case the amplitude of the motion can be extracted simply by counting fringes ~and fractions of a fringe!. The following section describes the realization of the sensor. The research focused on measurement of small vibrations. 3. Apparatus
The vibration sensor is shown in Fig. 1. The light from a 5-mW laser diode was directed onto a bimorph PZT that was used as the test object. The PZT was 0.8 m from the laser diode. The PZT surface was a diffusive silver color that scattered light but gave no specular reflection. The amplitude of the PZT motion relative to the applied drive voltage was independently calibrated as a function of frequency in a Michelson interferometer. Approximately 4% of the initial laser beam was diverted by a glass slide and directed into a confocal FP cavity that was used as the LOF discriminator. The FP cavity had a 7.5GHz free spectral range and a finesse of 100. An adjustable ly2 plate and polarizing beam splitter were placed in the beam path to regulate the power reaching the test object and therefore the power returning to the laser. A second glass slide placed after the beam splitter diverted a small portion of laser light onto a p-i-n photodiode. This signal was used to monitor the light reaching the test surface and was used to estimate the backscattered power returning to the laser. The laser beam was collimated but was not focused onto the measurement surface. ~The beam could have been focused onto the surface to increase the sensitivity, but it was not necessary.! Figure 2 is a diagram of the mechanism that vibrated the laser. A 6-mm hole was drilled in the center of a PZT disk with a carbide bit. Lightweight wires were soldered to each side of the PZT. A nonconductive washer and a transistor jack were epoxied
Fig. 3. Slow laser-frequency servo. Frequency fluctuations were detected with a photodiode located behind the FP cavity. Corrections were made with small changes to the laser diode injection current.
Fig. 2. Calibration mechanism. The whole laser was mounted on a PZT to allow physical vibration of the laser.
to the outer surface of the PZT with the leads of the transistor jack protruding through the hole and out the back of the PZT. This setup was epoxied to a laser mounting block at four isolated points to allow the PZT to flex. The injection current wires soldered to the transistor jack were insulated to ensure no electrical conduction with the PZT. The laser diode was then fitted into the compatible transistor jack. This system was placed in an aluminum box to reduce temperature-induced changes in the LOF. A hole, sealed with a microscope slide, was drilled at a 20° angle to the normal of the side of the box to allow light to exit the box while minimizing the effects of optical feedback from the slide. The spectral properties of the laser light were verified with an optical spectrum analyzer. The laser was operating with the desired single-longitudinal mode at ;775 nm with 85 mA of injection current. Frequency discrimination was achieved with the FP interferometer. The central value of the laser frequency was held constant by locking it to the side of the FP resonance and monitoring the unservoed, high-frequency modulations. The error signal was derived from the light transmitted through the FP cavity. The photodiode signal from the transmitted light was filtered and fed back to the laser diode injection current as shown in Fig. 3. The reference voltage of the servo was set so that at low frequencies the transmitted light power was held constant at half of the FP cavity’s peak transmittance. LOF modulations resulting from the test object’s vibration were then easily detected as fast modulations ~above the servo bandwidth! in the light transmitted through the FP cavity. The subsequent voltage modulations were observed on an oscilloscope and a spectrum analyzer. The amplitudes of the peaks produced on
the spectrum analyzer were proportional to the LOF modulation amplitude. To calibrate the motion of the bimorph PZT for an applied drive voltage, a very small mirror was glued to the front surface of the PZT and was used as one mirror in a Michelson interferometer. The PZT response as a function of driving frequency was measured. PZT limitations restricted measurements to frequencies below 50 kHz. The PZT that vibrated the laser was calibrated similarly. To ensure a proper calibration signal from the vibration of the laser, it was important to minimize the effects of optical feedback from surfaces other than the test PZT. The collimation lens was epoxied to the front of the laser so that the two objects moved together. All optical components were thoroughly cleaned. Attenuators and slight misalignment of the FP cavity were used to reduce unwanted optical feedback from the FP cavity to a negligible level. An optical isolator between the FP cavity and the laser diode would be a better, but more expensive, solution to this problem. Alternatively, the light could be coupled into an off-axis mode of the cavity. 4. Results
The three factors that influence the signal amplitude are distance to the object, feedback power, and surface-vibration amplitude. The effects of each were compared with the expected behavior outlined in Section 2. The measured relationship between the vibration amplitude of the test surface ~PZT! and the resultant sensor signal, as measured on the spectrum analyzer, is shown in Fig. 4. The test PZT was vibrated at 35 kHz. The vibration amplitude was varied while the feedback power and L0 were held constant. As expected from Eq. ~4!, the sensor signal was maximized for peak-to-peak vibration amplitudes of 1y4 wavelength ~195 nm!. The Dv measured at the vibration frequency with our test surface at a distance of 0.8 m and a vibration amplitude of 195 nm was approximately 10 MHz. Motions with amplitudes greater than ly4 were observed but were not analyzed quantitatively ~see Fig. 5!. A fringe-counting technique would be necessary for such measurements. 1 December 1996 y Vol. 35, No. 34 y APPLIED OPTICS
6757
Fig. 4. Sensor signal as a function of peak-to-peak object vibration amplitude for constant L0 and feedback power. The filled circles represent data points; their size represents the measurement uncertainty. The roll-off at larger amplitudes is expected because of the sinusoidal dependence of the signal on vibration amplitude. The dashed curve is a normalized plot of Eq. ~4! with A 5 49.6, l 5 775 nm; L is one half of the peak-to-peak object vibration amplitude. Note that the approximation that led to Eq. ~7! is not valid for vibration amplitudes for which b .. ly4p.
The dependence of the sensor signal on feedback power is shown in Fig. 6. The light returning to the laser diode was estimated to be 0.005% of the light incident upon the PZT by measurement of the fractional power of scattered light at a p-i-n photodiode 0.2 m from the object and multiplication of that value by the estimated ratio of the solid angle of the diode laser to the solid angle of the p-i-n photodiode. The adjustable ly2 plate and a polarizing beam splitter were then used to change the feedback power below this level. A glass slide diverted a small portion of the incident beam onto a p-i-n diode to monitor the attenuation ~see Fig. 1!. The PZT vibration amplitude was fixed at 97 nm, and the distance between the laser and the PZT was held constant by manual
Fig. 5. Oscilloscope signal obtained while the test object is vibrated with an amplitude greater than ly2. The top trace is the ramp signal sent to the test PZT. The bottom trace is the sensor signal. The signal is sinusoidal, as expected. 6758
APPLIED OPTICS y Vol. 35, No. 34 y 1 December 1996
Fig. 6. Sensor signal as a function of feedback power for constant L0 and object-vibration amplitude. The dashed curve is a normalized plot of Eq. ~2! with C equal to 4870 3 fext1y2. The filled circles represent the data points; their size represents the measurement uncertainty. The data fit the predicted fext1y2 dependence well. The maximum feedback power was 0.005% of the incident light.
adjustment of the dc voltage to the PZT ~to compensate for slow, temperature-induced drifts in L0!. In the next set of measurements the diode laser was vibrated as described in Section 2 to eliminate sensitivity to such drifts as well as any change in feedback power. Figure 7 shows a typical spectrumanalyzer signal with a 3.3-kHz calibration-vibration frequency. The peaks at vf 2 vs and at 2vs predicted by Eq. ~10! are barely visible above the noise. The previous measurements were repeated, and they agreed with predictions without any need to compensate for thermally induced drift in the value of L0. The calibration frequency was chosen arbitrarily to be 6.4 kHz and the object-vibration frequency used was 19.4 kHz. The test surface’s vibration amplitude was measured by comparison of the magnitude of the vibration signal at 19.4 kHz with the magnitude of the calibration signal at 6.4 kHz ~which corresponded to a known vibration am-
Fig. 7. Photograph of the calibration and object peaks on the spectrum analyzer. The laser was vibrated at 6.4 kHz with an amplitude of 97 nm, and the object was vibrated at 19.4 kHz with the same amplitude.
Table 1. Values of Calibration Peak, Test Surface Peak, and Ratio of the Peaks as a Function of Intensity Returning to the Laser Diode for Constant Test-Surface and Calibration-Vibration Amplitudesa
Normalized Intensity
Calibration Peak Amplitude for 6.4 kHz ~mV!
Test Surface Peak Amplitude for 19.4 kHz ~mV!
Test Surfacey Calibration
1.0 0.78 0.57 0.29
4.52 3.69 2.79 1.70
4.88 3.75 2.80 1.76
1.08 1.02 1.00 1.04
a Magnitudes of the peaks are measured on a spectrum analyzer at the appropriate frequency. Thermal drifts of L0 were permitted so the magnitudes of the peaks will not necessarily follow the fext1y2 dependence predicted by Eq. ~2!. Note that, although the magnitudes of the signals vary by a factor of 3 over the intensity range, the ratio of the signals varies by less than 5%.
plitude!. Table 1 shows a set of data taken over different values of fext. An attenuator was used to change the fraction of light returning to the laser. Note that, although the amplitudes of the individual peaks changed by more than a factor of three, the ratio of the peaks changed by less than 5%. Repeatability of the calibration ratios was examined while vibration amplitude, feedback power, and distance to the laser were separately varied. When the vibration amplitude or feedback power was varied, the standard deviation of the ratios decreased as the inverse square root of the number of averages, as expected from random noise fluctuations. However, variations beyond those expected from random noise were obtained for different values of L0. A closer analysis revealed that the noise of the sensor changed when drifts in L0 were larger than ly2. This systematic effect appears to be connected with spurious optical feedback from the FP cavity. While a further analysis of this systematic effect is warranted, we expect that an optical isolator, better attenuation of the light reflected from the cavity, or coupling into the cavity off-axis will solve the problem. The noise floor of the instrument is shown in Fig. 8. It includes noise due to changes in FP cavity mirror
Fig. 8. Noise floor of the sensor as a function of frequency. 1 mVyHz1y2 5 0.015 nmyHz1y2.
spacing caused by thermal variations and seismic vibrations ~dominant at low frequencies! as well as intrinsic noise from the laser and electronics noise. The displacement noise at 35 kHz is 0.23 nmyHz1y2. 5. Discussion
The results show that this instrument can be used to measure small vibrations in solid materials with extremely low feedback while maintaining high sensitivity. This section discusses further modifications and fundamental limits for frequency range and dynamic range. Flexibility with respect to the returning light power needed for measurement makes this method of vibrometry unique. Movements as small as a few tenths of a nanometer were detected with less than 0.005% of the incident power returning to the laser. This means that it is possible to measure small vibrations of objects that have extremely low reflectance. Alternatively, the diode sensor can be positioned far from the object being measured. The minimum feedback power needed will depend on the vibration amplitude to be measured. The fundamental limit to any vibration measurement will be the intrinsic laser-frequency noise. The power spectrum of the intrinsic noise increases with decreasing frequency17 to ;10 MHz. Therefore, the ultimate sensitivity of a sensor limited by the laserfrequency noise will be higher at high frequencies away from the relaxation oscillations ~near 2 GHz!. The vibrometer’s inherent bandwidth is very large. The range will be limited at low frequencies by the servo bandwidth. While the bandwidth of the servo implemented here was about 3 kHz, this limit was not optimized and should be lowered to less than 100 Hz ~the trade-off here is low-frequency sensitivity of the sensor versus robustness of the lock to the FP cavity resonance; a more robust locking method such as that described by Ha¨nsch and Coullaud could be used18!. The upper limit of vibration frequency in this demonstration was ;50 kHz and was completely limited by the response of the bimorph PZT used as the test object and the electronics used to drive it. A diode laser’s response to optical feedback is much faster ~of the order of 1 ns!17,18 and is the fundamental limiting factor for high-frequency measurements. The analysis of the signal at frequencies greater than the FP cavity linewidth will be complicated by the change in the response of the cavity, since the cavity will act as a phase, rather than a frequency, discriminator. An increase in signal can be obtained by increasing the feedback power. At high feedback power the LOF fluctuations can no longer be approximated by the Lang–Kobayashi equations. Within this limit, however, there are several ways to increase the feedback power and therefore increase the signal. The beam can be focused onto the measurement surface to increase feedback power dramatically. Surfaces with higher reflectance and surfaces that are closer to the laser will also increase the signal. The properties ~finesse and free-spectral range! of 1 December 1996 y Vol. 35, No. 34 y APPLIED OPTICS
6759
the FP cavity used will also affect the sensitivity. No attempt was made to optimize these properties. Using a dielectric coating to adjust the reflectance of the front facet of the diode laser could also improve the sensitivity14 @this can be seen from Eqs. ~1! and ~2!#. No careful measurements of the working range of the vibrometer were made. In all the measurements described here, the test surface was 0.8 m from the diode. The range will depend on the reflectivity of the test object. ~Of course, this sensor will be subject to the same problems as normal interferometers; i.e., air currents will become an important source of noise.! Vibration amplitudes as high as 550 nm were observed, but the upper limit of detectable vibration amplitudes was not investigated. This vibrometer takes advantage of a different aspect of the same physical phenomenon as sensors employing laser-diode-feedback interferometry.7,11,12 However, it measures vibrations by looking at frequency rather than intensity changes in the laser diode’s emitted light. The frequency is a more sensitive discriminator. The vibrometer therefore requires far less ~approximately a factor of 1000! backscattered light to operate. The displacement sensors described in Ref. 9 measure changes in frequency caused by optical feedback, but because the light sources used are not single-mode diode lasers, the sensitivity to optical feedback is greatly reduced and the sensors required that 25% of the incident light be returned to the laser to achieve a comparable sensitivity. This sensor requires far less scattered light than other optical noncontacting methods of vibrometry, such as Michelson interferometry10,19 and laserDoppler vibrometry.2,3 It is also less costly, because it uses inexpensive diode lasers and does not require equipment such as Bragg modulators. Its sensitivity is comparable to Michelson interferometry but is not as good as laser-Doppler vibrometry. The sensitivity of relatively inexpensive nonoptical systems such as capacitive or inductive sensors is comparable with or ~at low frequencies! better than the sensor described here. The major advantage of this ~and most optical sensors! over nonoptical systems is the increased range of the sensor. The diode can be placed more than 1 m away from the test object, while capacitive and inductive sensors typically have bulky packages that need to be placed within a few millimeters of the test object. 6. Conclusion
The effects of very small amounts of optical feedback on a laser diode’s operating frequency can be used to measure small amplitude vibrations. The effects of the feedback on the LD operating frequency match the predictions. A calibration mechanism to differentiate between large vibrations with small amounts of optical feedback and small vibrations with large amounts of optical feedback was demonstrated. There are many possible applications for this vi6760
APPLIED OPTICS y Vol. 35, No. 34 y 1 December 1996
brometer. The vibrometer’s unique measurement technique allows for measurement of physically inaccessible vibrating surfaces that have small mass and very low reflectance. The vibration measurement is not the only application of optical feedback-induced frequency modulation in laser diodes. The sensor can also be used as a velocimeter. The method described in this work will require substantially lower returning light power than other forms of vibrometry, maintain excellent sensitivity characteristics, and provide flexibility in terms of vibration amplitude and frequency as well as the distance to the measurement surface, all at a very low cost. We thank Eric Cornell for suggesting the calibration mechanism. This work was funded by the Office of Naval Research and the National Institute of Standards and Technology. References 1. S. G. Anderson, “Complex tests exploit laser technology,” Laser Focus World 71–78 ~July 1994!. 2. J. P. Nokes and G. L. Cloud, “The Application of Three Interferometric Techniques to the NDE of Composite Materials,” in Interferometry VI: Applications, R. J. Pryputniewicz, G. M. Brown, and W. P. Jueptner, eds., Proc. SPIE 2004, 18 –26 ~1993!. 3. P. Sriram, J. I. Craig, and S. Hanagud, “Scanning laser Doppler techniques for vibration testing,” Exp. Tech. Phys., 21–26 ~Nov.yDec. 1992!. 4. M. Samuels, S. Patterson, J. Eppstein, and R. Fowler, “Low cost, handheld lidar system for automotive speed detection and law, in Laser Radar VII: Advanced Technology for Applications, R. J. Becherer, ed., Proc. SPIE 1633, 147–159 (1992). 5. A. R. Duggal, C. P. Yakymyshyn, D. F. Fobare, and D. C. Hurley, “Optical detection of ultrasound with a microchip laser,” Opt. Lett. 19, 755–757 ~1994!. 6. D. J. Anderson, J. D. Valera, and J. D. C. Jones, “Electronic speckle pattern interferometry using diode laser stroboscopic illumination,” Meas. Sci. Technol. 4, 982–987 ~1993!. 7. P. J. de Groot, G. M. Gallatin, and S. H. Macomber, “Ranging and velocimetry signal generation in a backscatter-modulated laser diode,” Appl. Opt. 27, 4475– 4480 ~1988!. 8. D. A. Oursler and J. W. Wagner, “Full-field vibrometry using a Fabry–Perot e´talon interferometer,” Appl. Opt. 31, 7301–7308 ~1992!. 9. K.-L. Deng and J. Wang, “Nanometer-resolution distance measurement with a noninterferometric method,” Appl. Opt. 33, 113–116 ~1994!. 10. Sun Yusheng, Zhang ZiDong, and Cai Kanze, “Improvements in a laser heterodyne vibrometer,” Rev. Sci. Instrum. 63, 2974 –2976 ~1992!. 11. J. Kato, N. Kikuchi, I. Yamaguchi, and S. Ozono, “Optical feedback displacement sensor using a laser diode and its performance improvement,” Meas. Sci. Technol. 6, 45–52 ~1995!. 12. S. Donati, G. Giuliani, and S. Merlo, “Laser diode feedback interferometer for measurement of displacements without ambiguity,” IEEE J. Quantum Electron. 31, 113–119 ~1995!. 13. E. T. Shimizu, “Directional discrimination in the self-mixing type laser Doppler velocimeter,” Appl. Opt. 26, 4541– 4544 ~1987!. 14. R. Lang and K. Kobayashi, “External optical feedback effects on semiconductor injection laser properties,” IEEE J. Quantum Electron. QE-16, 347–355 ~1980!.
15. D. Lenstra and J. S. Cohen, “Feedback noise in single-mode semiconductor lasers,” in Laser Noise, R. Roy, ed., Proc. SPIE 1376, 245–258 ~1990!. 16. M. Osinski and J. Buus, “Linewidth broadening factor in semiconductor lasers—An Overview,” IEEE J. Quantum Electron. QE-23, 9 –29 ~1987!. 17. C. E. Wieman and L. Hollberg, “Using diode lasers for atomic
physics,” Rev. Sci. Instrum. 62, 1–20 ~1991!. 18. T. W. Ha¨nsch and B. Coullaud, “Laser frequency stabilization by polarization spectroscopy of a reflecting reference cavity,” Opt. Commun. 35, 441– 444 ~1980!. 19. M. Imai and K. Kawakita, “Optical-heterodyne displacement measurement using a frequency-ramped laser diode,” Opt. Commun. 78, 113–117 ~1990!.
1 December 1996 y Vol. 35, No. 34 y APPLIED OPTICS
6761