Characterization of Two Soybean (Glycine max L.) LEA IV Proteins by Circular Dichroism and Fourier Transform Infrared Spectrometry 1Institute
of Plant and Microbial Biology, Academia Sinica, Taipei, Taiwan, ROC of Plant Biology, National Taiwan University, Taipei, Taiwan, ROC 3Laboratory of Plant Physiology, Wageningen University, PO Box 658, NL-6700 AR Wageningen, The Netherlands ∗Corresponding authors: Yue-ie C. Hsing, E-mail,
[email protected]; Fax, +886-2-27827954; Folkert A. Hoekstra, E-mail,
[email protected]; Fax, +31-317-484740 (Received November 15, 2009; Accepted January 4, 2010) 2Institute
Late embryogenesis-abundant (LEA) proteins, accumulating to a high level during the late stages of seed development, may play a role as osmoprotectants. However, the functions and mechanisms of LEA proteins remained to be elucidated. Five major groups of LEA proteins have been described. In the present study, we report on the characterization of two members of soybean LEA IV proteins, basic GmPM1 and acidic GmPM28, by circular dichroism and Fourier transform infrared spectroscopy. The spectra of both proteins revealed limited defined secondary structures in the fully hydrated state. Thus, the soybean LEA IV proteins are members of ‘natively unfolded proteins’. GmPM1 or GmPM28 proteins showed a conformational change under hydrophobic or dry conditions. After fast or slow drying, the two proteins showed slightly increased proportions of defined secondary structures (α-helix and β-sheet), from 30 to 49% and from 34 to 42% for GmPM1 and GmPm28, respectively. In the dehydrated state, GmPM1 and GmPM28 interact with non-reducing sugars to improve the transition temperature of cellular glass, with poly-L-lysine to prevent dehydrationinduced aggregation and with phospholipids to maintain the liquid crystal phase over a wide temperature range. Our work suggests that soybean LEA IV proteins are functional in the dry state. They are one of the important components in cellular glasses and may stabilize desiccation-sensitive proteins and plasma membranes during dehydration. Keywords: Circular dichroism • Fourier transform infrared • LEA protein • Molecular chaperone • Natively unfolded proteins • Protein secondary structure. Abbreviations: CD, circular dichroism; DOPG, 1,2-dioleoylphosphatidylglycerol; FTIR, Fourier transform infrared spectroscopy; LEA, late embryogenesis-abundant; POPC, 1-palmitoyl-2-oleoyl-3-sn-phosphatidylcholine; RH, relative
humidity; TFE, trifluoroethanol; temperature coefficient.
WTC,
wavenumber–
Regular Paper
Ming-der Shih1, Tzung-yang Hsieh1, Tsai-piao Lin2, Yue-ie C. Hsing1,∗ and Folkert A. Hoekstra3,∗
Introduction Late embryogenesis-abundant (LEA) proteins accumulate in seeds and pollen during maturation; in vegetative tissues in response to drought, salinity or temperature stresses; or with exogenously applied ABA (Dure et al. 1989, Bray et al. 1994, Ingram and Bartels 1996, Cuming et al. 1999). LEA proteins have been isolated from all biological kingdoms, including plants, bacteria, fungi and animals (Tunnacliffe and Wise 2007, Battaglia et al. 2008, Shih et al. 2008). They are classified into at least five groups on the basis of amino acid sequences and conserved motifs (Dure et al. 1989, Bray et al. 1994, Cuming, 1999, Shih et al. 2008), at least four major groups on the basis of protein or oligonucleotide probability profile (POPP) analysis which determines the similarity between peptide compositions (Wise 2002, Wise 2003), or 7–10 groups on the basis of distinctive motifs (Bies-Ethève et al. 2008). Most LEA proteins remain soluble after boiling, and are highly hydrophilic; rich in specific amino acid residues such as glycine, alanine and glutamate; and poor in others such as cysteine and tryptophan (Dure 1993b, Shih et al. 2008). The involvement of LEA proteins in the protection of plant cells against dehydration stress has been proposed on the basis of accumulation pattern, localization analysis, transgenic plant studies and protein characterization (e.g. Dure et al. 1989, Kazuoka and Oeda 1994, Imai et al. 1996, Xu et al. 1996, Nylander et al. 2001). Structural studies of LEA proteins might provide opportunities for further examination of the mechanisms of the protein functions. Although the fine structures of LEA proteins have yet to be determined, the secondary structures of several LEA proteins have been analyzed by
Plant Cell Physiol. 51(3): 395–407 (2010) doi:10.1093/pcp/pcq005, available online at www.pcp.oxfordjournals.org © The Author 2010. Published by Oxford University Press on behalf of Japanese Society of Plant Physiologists. This is an Open Access article distributed under the terms of the Creative Commons Attribution Non-Commercial License (http://creativecommons.org/licenses/by-nc/2.5), which permits unrestricted non-commercial use distribution, and reproduction in any medium, provided the original work is properly cited.
Plant Cell Physiol. 51(3): 395–407 (2010) doi:10.1093/pcp/pcq005 © The Author 2010.
395
M. Shih et al.
circular dichroism (CD), nuclear magnetic resonance (NMR) or Fourier transform infrared (FTIR) spectroscopy. Although computational prediction showed that LEA proteins might form defined secondary structures (e.g. Dure 1993a), the results of these spectrographs revealed that hydrophilic LEA proteins adopt a high degree of disordered conformations under aqueous conditions, which suggests that hydrophilic LEA proteins belonged to the ‘natively unfolded proteins’ (see review in Shih et al. 2008, and references therein). Some proteins can change their conformations in the presence of α-helix-promoting co-solvents or after dehydration (Wolkers et al. 2001, Goyal et al. 2003, Shih et al. 2004, Boudet et al. 2006), whereas others show little or no conformational change under hydrophobic conditions (Lisse et al. 1996, Ismail et al. 1999, Soulages et al. 2002, Koag et al. 2003, Soulages et al. 2003). The LEA IV proteins are a group of hydrophilic and heatsoluble proteins of low molecular weight and contain large proportions of small amino acid residues such as glycine or alanine, and charged residues such as aspartate, glycine, lysine or arginine (Dure 1993b). The genes of LEA IV proteins have been cloned from several plant species (Baker et al. 1988, Cohen et al. 1991, Almoguera et al. 1992, Chen et al. 1992, Shih et al. 2004) and shown to be expressed in seeds during the late stages of development and in plants responding to ABA treatment or water deficit (Cohen et al. 1991, Almoguera et al. 1992, Shih et al. 2004). The accumulation of LEA IV proteins (tomato Le25) in yeast enhanced the growth of cells in high salt media, which suggests that these proteins play a protective role under dehydration stress (Imai et al. 1996). Results of our previous study of the secondary structures of the soybean LEA IV protein GmPM16 showed that the protein adopted largely α-helical structures in the presence of α-helix-promoting co-solvents and in the dehydrated state. In addition, GmPM16 proteins appeared to interact with non-reducing sugars and form dense sugar–protein glasses (Shih et al. 2004). In the current report, we describe our characterization of two other soybean LEA IV proteins—a basic protein GmPM1 (Chen et al. 1992) and an acidic protein GmPM28—by CD and FTIR spectroscopy. We discuss the possible functions of LEA IV proteins.
Results
396
residues, 9.5 kDa and pI 4.5. Few or no cysteine, tryptophan or phenylalanine residues are present in either protein. The hydrophilic, charged and hydroxyl amino acid residues represent 53.2 and 59.5% of the total residues in the two proteins, respectively. However, the small amino acid residues as a whole represented 30.6 and 18.0% of the total residues, respectively, for GmPM1 and GmPM28, which indicates their difference. Homology scans by use of BLAST algorithms showed that the best alignments of GmPM1 were with soybean GmPM9 (accession No. X63565) (Lee et al. 1992). The AtPAP51 (X91915) from Arabidopsis (Parcy et al. 1994) and Ds11 from sunflower (Almoguera et al. 1992) were the best intergenus orthologs, with approximately 60% identity. Moreover, the best alignment of GmPM28 was its Arabidopsis ortholog At3g12960, with approximately 59% identity.
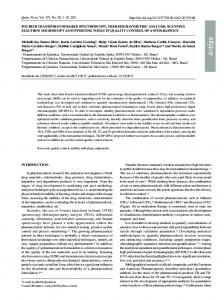
CD analysis of protein secondary structures The recombinant GmPM1 and GmPM28 proteins were purified from Escherichia coli harboring pETGmPM1 and pETGmPM28 plasmids, respectively. The secondary structures of these proteins in phosphate buffer at various temperatures were analyzed by far-UV CD spectroscopy. The spectra of GmPM1 or GmPM28 proteins at a range of temperatures from 10 to 90°C showed a strong negative band at approximately 200 nm, which is indicative of highly disordered structures (Fig. 1A, B). The appearance of a negative shoulder at around 220 nm suggests that the proteins still contain partially defined secondary structures. The observation of isodichroic points near 209 nm in the spectra of both proteins indicates the existence of two-state equilibrium. This was confirmed from the difference of ellipticity values at 200 or 220 nm (Fig. 1A, B inserts). The decrease in intensity of the 200 nm band and the increase in intensity of the band near 220 nm show temperature-induced protein refolding. The refolding process was reversible, because the far-UV spectra of the two proteins, after cooling from 90 to 20°C, completely overlap the spectra of the original protein solution at 20°C (data not shown). The CD difference spectra (i.e. 10°C – 90°C) of the two proteins are shown in Fig. 1C. Both spectra contain a deep, negative 197 nm band and a positive band above the isodichroic points, which suggests that GmPM1 and GmPM28 contain small amounts of left-handed extended helical structures, termed poly(L-Pro)-type II (PPII)-like structures, at low temperatures.
Sequence characteristics of LEA IV GmPM1 and GmPM28 proteins
Intrinsic conformational change of GmPM1 and GmPM28 proteins
GmPM1 (accession No. M80666) and GmPM28 (accession No. AF117724) clones were isolated from a soybean 4 d pod-dried (PD) seed cDNA library (Hsing and Wu 1992). They contained 836 and 500 bp inserts, respectively. DNA hybridization analysis of soybean genomic DNA under high stringency conditions revealed that both genes belonged to small gene families (data not shown). The putative open reading frame of GmPM1 encodes a polypeptide of 173 amino acid residues, 17.6 kDa and pI 10.4, and that of GmPM28 a polypeptide of 89 amino acid
The addition of specific reagents such as SDS or trifluoroethanol (TFE) provides an opportunity to investigate the intrinsic ability of the proteins to adopt α-helical structures. Therefore, the far-UV CD spectra of GmPM1 and GmPM28 in the presence of 4% SDS or 50% TFE and their CD difference spectra were determined (Fig. 2). Recombinant GmPM1 protein showed two negative bands at around 208 and 225 nm and one positive band at 190 nm, which indicates that the protein adopted a significant α-helical structure in the presence of
Plant Cell Physiol. 51(3): 395–407 (2010) doi:10.1093/pcp/pcq005 © The Author 2010.
Characterization of two soybean seed LEA proteins
Fig. 1 Far-UV CD spectra of GmPM1 (A) and GmPM28 (B) to analyze the effect of increasing temperature on the protein secondary structures. The spectra were measured in 10°C increments in 10 mM potasium phosphate buffer, pH 7.0, from 10 to 90°C. The inserts show the temperature-induced refolding of both proteins by using the difference of spectra at 220 and 200 nm. (C) Difference spectra obtained after subtracting the spectra of both proteins from spectra obtained at 10 and 90°C.
Plant Cell Physiol. 51(3): 395–407 (2010) doi:10.1093/pcp/pcq005 © The Author 2010.
397
M. Shih et al.
Fig. 2 Far-UV CD analyses of GmPM1 (A) and GmPM28 (B) with 4% SDS or 50% TFE solvents. The inset shows the difference spectra obtained after subtracting spectra of both proteins in buffer from spectra obtained with either SDS or TFE.
each α-helix-promoting co-solvent (Fig. 2A). However, the spectra of the GmPM28 protein differed under the same conditions. In the presence of 4% SDS, the spectra showed a major negative band at around 206 nm, a broad shoulder near 225 nm and one weak positive band at 190 nm (Fig. 2B, red line), whereas, in the presence of 50% TFE, it showed two negative bands at around 208 and 225 nm and one positive band at 190 nm (Fig. 2B, blue line). These results indicate that the conformational change was less likely in the GmPM28 protein than in the GmPM1 protein. The difference spectra provided more detail (Fig. 2, inserts). The spectral results suggest that GmPM1 protein has more intrinsic ability to adopt α-helical structures than does GmPM28.
398
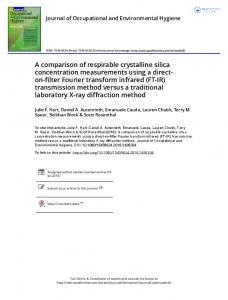
FTIR analysis of protein secondary structures The FTIR technique was used to analyze protein secondary structures further in fully hydrated or dehydrated conditions. GmPM1 and GmPM28 proteins were dissolved in D2O to avoid interference of the H–O–H scissoring vibration, or were dropped onto a film for either slow or fast air drying before spectroscopy (see Materials and Methods), giving the amide-I and -II bands between 1,700 and 1,500 cm−1. The maximum absorption bands in the amide-I region were at around 1,652 cm−1, defined as α-helical and/or turn structures. The differences in spectra between fully hydrated and dehydrated proteins appeared at band 1,638 cm−1 in the amide-I region and from 1,530 to 1,570 cm−1 in the amide-II region. The spectra
Plant Cell Physiol. 51(3): 395–407 (2010) doi:10.1093/pcp/pcq005 © The Author 2010.
Characterization of two soybean seed LEA proteins
Fig. 3 FTIR absorption and second-derivative spectra in the amide regions of GmPM1 (A, B) and GmPM28 (C, D). These panels display the spectra of proteins in D2O (black), and after fast drying (red) and slow drying (blue). The oblongs in A and D show the α-helix bands (pink) in the amide-I and -II regions, or random coil bands (dark pink) in the amide-I region. The band positions of second-derivative spectra are basically accounted for by the spectra of slow drying, except the band at 1,658 cm−1 (B) and at 1,563 cm−1 (B, D) which are determined by the spectra of GmPM1 proteins after fast drying and in D2O.
of both hydrated LEA IV proteins contained a visible shoulder and band at around 1,638–1,645 cm−1, which suggests random coil conformations. In contrast, the maximum absorption bands in the amide-II region of the dehydrated proteins were at around 1,544 cm−1 and there were weak bands of fully hydrated proteins at around 1,565 cm−1 (Fig. 3A, C). The bands at around 1,548 (from 1,538 to 1,555) cm−1 or 1,517 (from 1,515 to 1,525) cm−1 had been assigned as a parallel (A type) or perpendicular (E1 type) α-helix (Nevskay and Chirgadze 1976, Marsh et al. 2000). In addition, the decrease at around 1,550 cm−1 in hydrated conditions could be attributed to a high ratio of H/D exchange, which describes the increment of accessibility of the core amide bond to water. The second derivative spectra were then calculated to reveal more clearly the possible components of the amide-I and -II
bands (Fig. 3B, D). Spectra of both fully hydrated proteins show similar profiles: two major bands at 1,638 and 1,651 cm−1, and four minor bands at 1,628, 1,670, 1,680 and 1,694 cm−1 in the amide-I region, as well as two significant bands at 1,545 and 1,563 cm−1 in the amide-II region. In contrast, the spectra of both dried proteins showed one major band at around 1,652 cm−1, and those of fast-dried GmPM1 proteins contained an additional band at 1,658 cm−1 and five minor bands at 1,628, 1,639/1,640, 1,669/1,670, 1,680 and 1,693/1,694 cm−1 in the amide-I regions. Both slow-dried GmPM1 and fast- or slow-dried GmPM28 proteins showed three bands at around 1,524, 1,544 and 1,554 cm−1 in the amide-II regions. However, the spectra of fast-dried GmPM1 proteins showed a band only at 1,554 cm−1 and two shoulders at around 1,517 and 1,548 cm−1. The bands at 1,638, 1,665 and 1,682 cm−1 were defined as
Plant Cell Physiol. 51(3): 395–407 (2010) doi:10.1093/pcp/pcq005 © The Author 2010.
399
M. Shih et al.
Table 1 Band positions and individual contributions by various secondary structures of GmPM1 and GmPM28 proteins in D2O (hydrated state), as well as after fast and slow drying, determined by curve fitting of the composite amide-I band of FTIR spectra Condition Hydrated (in D2O)
Fast drying
Slow drying
GmPM1
GmPM28
Structures
Amide-I (cm−1)
Area (%)
Amide-I (cm−1)
Area (%)
Assignment
% (PM1/PM28)
1,627
11.7
1,628
1,638
21.4
1,638
14.2
Extended β-sheet
Unstructured
16.6
Random coil
70/66.1a
1,651
30.0
1,651
35.4
Turn + α-helix
α-Helix
1,665
23.4
1,666
20.6
Turn
15/17.7a
1,678
10.2
1,679
11.2
β-Turn
Extended β-sheet
1,689
3.3
1,690
2.0
Extended β-sheet
15.0/16.2
1,630
9.8
1,628
6.7
Extended β-sheet
Unstructured
1,642
17.4
1,641
20.8
Random coil
51.2/57.9
1,655
26.5
1,655
24.9
α-Helix
α-Helix
1,668
19.5
1,668
20.7
Turn
26.5/24.9
1.680
14.3
1.680
16.4
β-Turn
Extended β-sheet
1.691
12.5
1.693
10.5
Extended β-sheet
22.3/17.2
1,628
8.2
1,628
9.1
Extended β-sheet
Unstructured
1,640
17.8
1,640
18.7
Random coil
50.9/57.6
1,654
36.0
1,653
25.9
α-Helix
α-Helix
1,667
23.4
1,668
25.2
Turn
36.0/25.9
1,679
9.7
1,682
13.7
1,689
4.8
1,690
7.3
β-Turn
Extended β-sheet
Extended β-sheet
13.0/16.4
aThe bands at 1,651 cm−1 for both proteins in solution could be contributed by a turn or α-helix. See text for details. Assignment of structures was according to Nevskaya and Chirgadze (1976), Byler and Susi (1986), Krimm and Bandekar (1986) and Marsh et al. (2000).
random coil and turn/β-turn structures, whereas the bands at 1,628 and 1,693/1,694 cm−1 were distributed as an extended β-sheet. The bands at around 1,651 cm−1 were difficult to determine because of the absorption overlap between the β-turn and α-helical conformations in solution (Byler and Susi 1986). Considering the amide-II bands at around 1,548 cm−1 and the results of CD analysis, the bands at around 1,651 cm−1 in the spectra of fully hydrated LEA IV proteins may be accounted for by the absorption of turns and α-helix. Table 1 shows the curve-fitting results of the amide-I region of both proteins in the hydrated and dehydrated states. If the turn and α-helical structures contributed equally to the band at 1,651 cm−1 in the hydrated state, then both proteins have 65–70% disordered conformation, 15–17.4% α-helix and 15–16.2% β-sheet. In addition, both proteins adopt 42% (GmPM28) to 49% (GmPM1) defined secondary structures with fast or slow drying. These results also support GmPM1 proteins showing more plasticity than GmPM28 proteins on CD analysis. However, the ratio of α-helix to β-sheet for the GmPM1 proteins was 26.5% to 22.3%, respectively, after fast drying but 36% to 13% after slow drying. In contrast, the ratios for the GmPM28 protein in the same conditions were 24.9% to 17.2% and 25.9% to 16.4%. These results suggest that the drying rate may affect the intramolecular rearrangement of some LEA proteins such as GmPM1 proteins but have no effect
400
on the conformational changes of GmPM28 proteins. The FTIR spectra of GmPM1 and GmPM28 after rehydration in D2O were similar to those of the original proteins in the fully hydrated condition, which indicates that the conformational change with drying was entirely reversible.
Interaction between LEA IV proteins and sugars We first examined by CD spectroscopy the mixture of nonreducing sugars such as sucrose, raffinose, stachyose or trehalose with LEA IV protein (10 : 1; w/w) in solution. The spectra, containing strong negative bands at around 200 nm, indicate random coil conformations, similar to the conformation of the protein without the addition of sugar (Fig. 4). This result suggests that LEA IV proteins in solution fail to interact with sugars. To study the possible interaction of LEA proteins and sugars in the dehydrated condition, we examined FTIR spectra of rGmPM1 and rGmPM28 embedded in non-reducing sugars. After both fast and slow drying, all these sugar–protein mixtures showed spectra with similar amide-I patterns (i.e. absorbance maximum at around 1,657 cm−1), designated as α-helical structures. The temperature-dependent shifts of the absorption maximum of the OH stretching band in the 3,360 cm−1 region were recorded for determining the glass transition temperature (Tg) and wavenumber–temperature coefficient (WTC) values (Wolkers et al. 1998b) of the glasses
Plant Cell Physiol. 51(3): 395–407 (2010) doi:10.1093/pcp/pcq005 © The Author 2010.
Characterization of two soybean seed LEA proteins
Table 2 Tg and WTC of GmPM1 and GmPM28 proteins interacting with different oligosaccharides Sugars
GmPM1
GmPM28
Tga
WTCb
Tg
WTC
Sucrose
83
0.12
85
0.12
Raffinose
124
0.09
120
0.10
Stachyose
120
0.12
122
0.13
Trehalose
128
0.09
134
0.15
aT
g is defined as the point of intersection of the regression lines in both the solid-like and liquid regions (Wolkers et al. 1998b). bWTC is defined as the rate of change of the vibrational energy with temperature (cm−1 °C−1); this value provides information on the molecular packing density of the glass (Wolkers et al. 1998b).
Fig. 4 Far-UV CD analyses of GmPM1 (A) and GmPM28 (B) with various oligosaccharides, including sucrose (black lines), raffinose (red lines), trehalose (blue lines) and stachyose (brown lines).
formed (Table 2). For rGmPM1 protein, analysis of the data for sucrose, raffinose, trehalose and stachylose mixtures gave Tg values of 83, 124, 120 and 128°C, respectively. WTC values in the glassy state were calculated at 0.12, 0.09, 0.12 and 0.09 cm−1 °C−1, respectively. For rGmPM28, analysis of sugar mixture data gave Tg values of 85, 120, 122 and 134°C, with WTC values of 0.12, 0.10, 0.13 and 0.15 cm−1 °C−1, respectively. These results suggest that these proteins might integrate into and interact with the sugar matrixes.
Interaction between LEA IV proteins and phospholipids To reveal the LEA IV protein–phospholipid interaction in the dry state, FTIR was used to determine the phase transition temperatures of the protein–phospholipid matrix by analyzing the symmetric CH2 stretching vibration at around 2,850 cm−1. For neutral POPC (1-palmitoyl-2-oleoyl-3-sn-phosphatidylcholine), the phase transition temperature appeared at around 60°C in a fast-dried sample or at around 56°C in a slow-dried sample (Fig. 5A, B). GmPM1 affected the melting behavior of the POPC system in the dry state. A substantial wave shift was detected at around 43°C after fast drying or at 36°C after slow drying, which indicates that most of the lipid acyl chains melt under these temperatures. GmPM28 affected the melting behavior of
the POPC system under both drying conditions. Under fast drying, a substantial wave shift was detected at around 42°C. After slow drying, however, the phase transition temperature of the GmPM28–POPC matrix was lower than the temperature of pure POPC by only 5°C, which suggests that the ability of GmPM28 to decrease the phase transition temperature in the neutral phospholipid system depends on the rate of drying. For acidic DOPG (1,2-dioleoyl-phosphatidylglycerol), the phase transition temperature appears at around 53°C in a fast-dried sample or at around 68°C in slow-dried sample (Fig. 5C, D). Apart from the fast-dried GmPM1–DOPG matrix, other matrices were not detected at less than −20°C. Hence, the melting behavior of GmPM28–DOPG and slow-dried GmPM1–DOPG matrixes changes greatly, which suggests that these matrixes maintain their liquid crystalline phase at least at −20°C. In contrast, for the fast-dried GmPM1–DOPG matrix, a minor transition was detectable at 62°C, which is 9°C higher than that for pure DOPG. No further transition was detected until −55°C, which indicates that not all DOPG molecules interact with GmPM1.
Interaction between LEA proteins and poly-L-lysine Although LEA proteins have been proposed to stabilize cellular components such as proteins and membranes under osmotic stress, the detailed mechanisms still require further investigation. In this study, we chose poly-L-lysine as a model system to study the LEA protein–polypeptide interaction. Hydrated poly-L-lysine was suggested to form random coil conformations (Wolkers et al. 1998b). Real-time FTIR studies revealed that the conformation of poly-L-lysine changed from a random coil to an extended β-sheet structure at 65% relative humidity (RH) within 15 h (Fig. 6), with no change at 3% RH (data not shown). The slow drying might give the dehydrating polypeptides time to aggregate. FTIR spectra were made of slow-dried GmPM1, GmPM28 or lysozyme, alone and in a 1 : 1 (w/w) mixture with poly-L-lysine (Fig. 7). Except for poly-L-lysine, none of the proteins alone showed aggregation on slow drying. The amide-I band profile of slow-dried poly-L-lysine always showed a major band at around 1,625 cm−1 and a minor band at around 1,695 cm−1, which indicates the presence of intermolecular,
Plant Cell Physiol. 51(3): 395–407 (2010) doi:10.1093/pcp/pcq005 © The Author 2010.
401
M. Shih et al.
Fig. 5 Lipid melting curves of dry POPC (A, B) or DOPG (C, D) in the absence or presence of either GmPM1 or GmPM28 protein. The wavenumbers of symmetric CH2-stretching vibrations are plotted as a function of temperature from −20 to 80°C. The lipid/protein mass ratio was 2 : 1. A and C show the plots of fast-dried lipid; B and D show the plots of slow-dried lipid.
extended β-sheet structures (Fig. 7, purple region). The slowdried lysozyme alone adopted mainly an α-helical structure, with an amide-I band at 1,656 cm−1 (Fig. 7, orange region). Spectra of the protein–poly-L-lysine mixtures showed that GmPM1 and GmPM28 prevent the conformational shift to the β-sheet of poly-L-lysine in the slow-dried mixture (Fig. 7, blue and yellow regions), but the lysozyme failed to prevent the aggregation (Fig. 7, red region). These results suggest that the functional LEA IV proteins may affect the conformations of other proteins under slow-drying conditions.
Discussion Hydrophilic LEA IV proteins are unfolded in the native state Although GmPM1 and GmPM28 proteins show low similarity in amino acid sequences, they share several common chemical characteristics, such as high hydrophilicity, similar amino acid compositions and low molecular weight. Both proteins also
402
contain bipartite regions (i.e. highly charged in the N-terminal domains), which are characteristic of most LEA IV proteins (Dure 1993b, Shih et al. 2008). As of October 2009, >100 LEA IV proteins were identified from green plants (see list at http://ipmb.sinica.edu.tw/soja/LEA/review_list/). The amino acid composition of all these proteins shows that LEA IV proteins contain approximately 55% hydrophilic and 20–30% small amino acid residues, while they contain only 10–15% non-polar residues (Shih et al. 2008). This amino acid composition indicates that proteins may barely form a stable hydrophobic core of a folded globular protein in solution (Dunker et al. 2008). Our CD and FTIR results in solution also confirm this prediction (Figs. 1, 3). Hence, LEA IV proteins are members of the natively unfolded proteins. Proteins with large disordered conformations are not rare. Genome-wide analysis indicated that disordered proteins are common products of eukaryotes, with 8 and 17% total proteins wholly disordered in the Arabidopsis and Drosphila genome, respectively (Dunker et al. 2001). Previous studies have reported that numerous natively unfolded proteins
Plant Cell Physiol. 51(3): 395–407 (2010) doi:10.1093/pcp/pcq005 © The Author 2010.
Characterization of two soybean seed LEA proteins
Fig. 6 Real-time FTIR spectra of poly-L-lysine to analyze the effect of slow drying (65% RH) on the protein secondary structures. The fully hydrated poly-L-lysine changes their conformation from random coil to extended β-sheet from 0 to 15 h (0 h, purple; 3 h, blue, 6 h, cyan; 9 h, light green; 12 h, orange, 15 h, red). Arrowheads indicate 1,625, 1,651 and 1,693 cm−1 for signatures of random coil and extended β-sheet.
change their conformations after incubation with other molecules such as proteins, ions or chemicals. Moreover, the kind of structural plasticity of natively unfolded proteins also plays a key role in their protein functions (Uversky 2002). Although in solution known hydrophilic LEA proteins adopt many disordered conformations (including random coil or extended helical structures), the ability for intrinsic conformational change is diverse. For example, soybean GmPM1, GmPM28 and GmPM16 (Shih et al. 2004), Typha latifolia D-7 (Wolkers et al. 2001), nematode AavLEA1 (Goyal et al. 2003) and Medicago truncatula MtEm6 (Boudet et al. 2006) show conformational change under hydrophobic or dehydration conditions. In contrast, structural analysis of several LEA I or LEA II proteins revealed a restricted defined secondary structure in the presence of SDS or TFE (Lisse et al. 1996, Ismail et al. 1999, Soulages et al. 2002, Koag et al. 2003, Soulages et al. 2003). Additionally, the analysis of the CD or FTIR spectra shows that these LEA proteins may undergo refolding to any possible compositions of secondary structures. For example, T. latifolia D-7 proteins contain α-helix and β-strand conformations (Wolkers et al. 2001). Soybean GmPM16 proteins adopt approximately ≥90% of α-helical structures (Shih et al. 2004). Other LEA proteins, such as nematode AavLEA1 (Goyal et al. 2003), M. truncatula MtEm6 (Boudet et al. 2006), GmPM1 and GmPM28 (this study), show partial α-helix (from ∼25 to ∼50%) and disordered conformation. Therefore, the refolding of hydrophilic LEA proteins under hydrophobic or dehydrated conditions does not follow certain rules. The refolding procedure
Fig. 7 Infrared absorption spectra in the amide-I region of poly-L-lysine (purple) that was slowly dried in the presence or absence of various proteins, including LEA proteins (GmPM1 only, black; GmPM1 with poly-L-lysine, blue; GmPM28 only, green; GmPM28 with poly-L-lysine, yellow) and lysozyme (lysozyme only, orange; lysozyme with poly-L-lysine, red).
of hydrophilic LEA proteins may be caused by the water molecules inside the protein molecule. Hydrodynamic studies have indicated that LEA proteins contained large amounts of water molecules under full hydration (McCubbin et al. 1985, Goyal et al. 2003). Because of chemical characteristics, the internal water molecules should be decreased in level but not eliminated from LEA proteins during dehydration. Little information is available on the quantity of internal water molecules during the dehydration process but may be reflected by the structural compositions of the dried LEA proteins.
LEA IV proteins interact with other macromolecules during dehydration Orthodox seeds, such as soybean seeds, undergo dehydration and maturation during the late developmental stage. In fact, the moisture loss of orthodox seeds is critical for embryo phase transition (Rosenberg and Rinne 1986). This feature leads to the question of how dry seeds withstand severe desiccation. Nonreducing sugars, such as sucrose and certain oligosaccharides, were first suggested to play an important role in desiccation tolerance because of their high level during anhydrobiotic
Plant Cell Physiol. 51(3): 395–407 (2010) doi:10.1093/pcp/pcq005 © The Author 2010.
403
M. Shih et al.
conditions (Hoekstra and Van Roekel 1988, Crowe et al. 1992). These non-reducing sugars might be necessary to form intracellular glasses in the cytoplasm, which is indispensable for the long-term survival in the dry state by stabilizing cellular components such as membranes and enzymes or retarding cytosomal crystallization (Burke 1986, Crowe et al. 1992, Hoekstra et al. 2001, Buitink and Leprince 2004). In addition, the large difference in biophysical properties between simple sugar and intracellular glasses indicates that the composition of intracellular glasses is complex (Wolkers et al. 1998a, Buitink et al. 2000). We found both soybean LEA IV proteins to interact with non-reducing sugars after fast or slow drying, as was found for several LEA proteins studied previously (Wolkers et al. 2001, Shih et al. 2004). Additionally, use of phospholipids and polypeptides to investigate the capability for macromolecule interaction revealed that GmPM1 and GmPM28 proteins change the phase transition temperature of the natural POPC system or negative DOPG system; however, the effects of the two samples, i.e. GmPM28 in the POPC system and GmPM1 in the DOPG system, differed depending on the rate of drying (Fig. 5). In this case, the pH values of LEA proteins are not crucial for the macromolecule interaction. For example, acidic GmPM28 proteins interact strongly with negative DOPG in the dry state, but the basic GmPM1 proteins may not interact with DOPG molecules in the fast drying state. As a whole, both soybean LEA IV proteins may efficiently maintain the stabilization of phospholipid systems. In the protein–sugar interaction assay, spectral analysis revealed that both soybean LEA IV proteins prevented the aggregation of poly-L-lysine under slow drying (Fig. 7), which indicates the molecular chaperone functions of these LEA IV proteins. However, use of the dehydration-insensitive lysozyme failed to prevent the aggregation. These results suggest that only particularly dehydration-insensitive proteins are capable of interacting with other proteins during dehydration. It should be noted that non-reducing sugars also interact with phospholipids during dehydration (Vereyken et al. 2003), and prevent the poly-L-lysine aggregation after slow drying (Wolkers et al. 1998b). The chemical features of non-reducing sugars, such as a water shell or hydrogen bond donor, might be important for the macromolecule interaction. Considering the diverse types of secondary structures in the dry state, chemical features of soybean LEA IV proteins may be one of the key factors for interaction with other macromolecules. Of course, one cannot exclude the possibility that the specific protein domains are involved in the LEA protein–macromolecule interaction. During seed development, in addition to storage proteins, which are packed in protein bodies, numerous transcription factors, enzymes or other structural proteins for the forthcoming germination are synthesized and stored in cells. These proteins are desiccation sensitive, and a protective mechanism should exist. Cytoplasm under the glassy state may be important in desiccation tolerance. For example, results of in situ FTIR spectroscopy suggested that slow-dried, desiccation-tolerant
404
somatic carrot embryos might be closely associated with newly synthesized bioglasses (Wolkers et al. 1999). However, the maturation-defective mutants of Arabidopsis seeds, such as abi3-1, abi3-5, abi3-7, lec1-1, lec1-3 and lec2-1, contain relatively loose intracellular glasses and fail to prevent the aggregation or denaturation of cellular proteins (Wolkers et al. 1998a). The cytoplasmic composition of these embryonic mutants differs greatly from that of the wild type. For example, RNA and protein assay revealed that these mutants lack most LEA proteins. LEA proteins in intracellular glasses might be one of the critical factors in preventing the aggregation of the desiccation-sensitive proteins and organelles and thus improve long-term survival.
Materials and Methods Bacterial strains and media Escherichia coli strain XL1-Blue was used for cloning plasmids, with BL21(DE3) used for expressing recombinant proteins and growth analysis. All cultures were grown in LB medium in the presence of 50 µg ml−1 kanamycin at 37°C.
Plasmid construction Recombinant DNA techniques were essentially as described by Sambrook and Russell (2001). The NdeI–EcoRV fragment of GmPM1 or GmPM28 containing the coding region was ligated to an NdeI–EcoRV fragment of the pET28a T7 expression vector (Novagen, Madison, WI, USA). The recombinant plasmids were introduced into E. coli cells, and the expression of the recombinant proteins was enhanced by 1 mM isopropyl-β-Dthiogalactopyranoside (IPTG) induction. Protein profiles were revealed by 12.5% SDS–PAGE.
Protein extraction and purification Purification of recombinant proteins followed the manufacturer’s protocol (pET system manual version 5.0, Novagen). Total soluble proteins of E. coli were extracted by sonication in ice-cold binding buffer (20 mM Tris–HCl, pH 7.9, 500 mM NaCl and 5 mM imidazole). An immobilized metal affinity column was used for purification. After being washed with wash buffer (20 mM Tris–HCl, pH 7.9, 500 mM NaCl and 50 mM imidazole), recombinant proteins were eluted with elution buffer (20 mM Tris–HCl, pH 7.9, 500 mM NaCl and 100 mM imidazole). Both N-terminal sequencing and mass spectrometry analysis were used for confirmation of recombinant proteins. N-terminal sequencing involved use of the Applied Biosystems 477A Automatic Protein Sequencer (Applied Biosystems, Foster City, CA, USA). Molecular mass determination involved use of the Finnigan LCQ ion trap mass spectrometer (Thermo Finnigan, San Jose, CA, USA).
Circular dichroism spectroscopy Protein samples were analyzed with use of a CD spectropolarimeter (Model J715, Jasco, Tokyo, Japan), with a 0.1 cm optical
Plant Cell Physiol. 51(3): 395–407 (2010) doi:10.1093/pcp/pcq005 © The Author 2010.
Characterization of two soybean seed LEA proteins
path length cell and circulating water bath as a temperature controller (Model RTE 111, Neslab, Portsmouth, NH, USA) as previously described (Shih et al. 2004). CD spectra were recorded at 20°C, or every 10°C from 10 to 90°C. The acquisition parameters were 0.1 nm resolution, 1.0 nm bandwidth, 2 s response and in the 260–185 nm range.
Fourier transform infrared spectroscopy FTIR spectroscopy was performed as described by Wolkers et al. (1998, 2001) with slight modifications. Infrared spectra were recorded on a Fourier transform infrared spectrophotometer (Model 1725, Perkin-Elmer, Foster City, CA, USA) equipped with a liquid nitrogen-cooled mercury/cadmium/telluride detector and a Perkin-Elmer microscope. Each sample was sealed between two circular (2 × 13 mm) CaF2 windows with a rubber O-ring and mounted into a temperature-controlled brass cell. All these procedures were performed in a dry box with 3% RH to prevent rehydration or H2O vapor exchange. The temperature of the cell was regulated by a computercontrolled device that activated a liquid nitrogen pump, in conjunction with a power supply for heating the cell. Spectra were recorded every 1 min at increments of 1.5°C min−1 from −40 to 150°C, starting with the lowest temperature. The acquisition parameters were 4 cm−1 resolution, 32 co-added interferograms and 3,600–1,000 cm−1 wavenumber range.
Sample preparation
CD spectral analysis and display involved the DICHROWEB analysis webserver (http://dichroweb.cryst.bbk.ac.uk/html/ home.shtml) (Whitemore and Wallace 2008); and FTIR spectral analysis and display involved Spectrum v2.00 (Perkin-Elmer). For protein studies, the spectral region between 1,800 and 1,500 cm−1 containing the amide-I and -II absorption bands was selected. Curve fitting of the original absorbance spectra between 1,800 and 1,500 cm−1 involved use of Peakfit (Jandel software) assuming Pearson band shapes. Second-derivative spectra were calculated by the use of Perkin-Elmer software with a three-point smoothing factor. Assignment of secondary structures was according to Nevskaya and Chirgadze (1976), Byler and Susi (1986), Krimm and Bandekar (1986) and Marsh et al. (2000).
Funding This work was supported by the National Science Council of the ROC [NSC 92-2311-B-001-153]; Academia Sinica [to Y.C.H].
Acknowledgments We thank L.-H. Wu for technical support. We also express our deep thanks to Ms. Laura Smales for editing services.
References
Poly-L-lysine (57.4 kDa), lysozyme (EC 3.2.1.17, from chicken egg white), sucrose, raffinose, trehalose and stachyose were purchased from Sigma (St Louis, MO, USA). Bovine serum albumin (BSA) was purchased from Roche. POPC and DOPG were purchased from Avanti Polar Lipids (Alabaster AL, USA). A 10 µM recombinant protein solution in 10 mM potassium phosphate buffer (pH 7.0) was used for CD spectroscopy. Protein samples were prepared fresh before measurement. The sample preparations for FTIR spectroscopy were slightly modified from those of Wolkers et al. (1998, 2001) and Vereyken et al. (2003). Aqueous protein samples were obtained by dissolving an aliquot of lyophilized proteins in D2O. Dry protein, protein–sugar, protein–poly-L-lysine or protein–phospholipid films were prepared by slow or fast airdrying of an 8 µl droplet of 20 µg µl−1 protein solution in H2O on the infrared windows. Fast drying was at room temperature with a stream of dry air (3% RH) for at least 3 h. Slow drying was at room temperature in a ventilated container at 65% RH generated by a saturated sodium nitrite solution for 16 h, after which the sample was air dried for another 3 h at room temperature with 3% RH.
Data analysis The characteristics of protein primary sequences, including amino acid contents, pI values, net charges and molecular weight, were analyzed by use of Computer Group (GCG) Sequences Analysis v10 (Devereux et al. 1994). Similarity searching involved BLAST algorithms (Altschul et al. 1990);
Almoguera, C. and Jordano, J. (1992) Developmental and environmental concurrent expression of sunflower dry-seed-stored low-molecularweight heat-shock protein and Lea mRNAs. Plant Mol. Biol. 19: 781–792. Altschul, S.F., Gish, W., Miller, W., Myers, E.W. and Lipman, D.J. (1990) Basic local alignment search tool. J. Mol. Biol. 215: 403–410. Baker, J., Steel, C. and Dure, L., III (1988) Sequence and characterization of 6 LEA proteins and their genes from cotton. Plant Mol. Biol. 11: 277–291. Battaglia, M., Olvera-Carrillo, Y., Garciarrubio, A., Campos, F. and Covarrubias, A.A. (2008) The enigmatic LEA proteins and other hydrophilins. Plant Physiol. 148: 6–24. Bies-Etheve, N., Gaubier-Comella, P., Debures, A., Lasserre, E., Jobet, E., Raynal, M., et al. (2008) Inventory, evolution and expression profiling diversity of the LEA (late embryogenesis abundant) protein gene family in Arabidopsis thaliana. Plant Mol. Biol. 67: 107–124. Boudet, J., Buitink, J., Hoekstra, F.A., Rogniaux, H., Larre, C., Satour, P., et al. (2006) Comparative analysis of the heat stable proteome of radicles of Medicago truncatula seeds during germination identifies late embryogenesis abundant proteins associated with desiccation tolerance. Plant Physiol. 140: 1418–1436. Bray, E.A. (1994) Alternation in gene expression in responsive to water deficit. In Stress-Induced Gene Expression in Plants. Edited by Basra, A.S. pp. 1–23. Harwood Academic Publishers. Buitink, J. and Leprince, O. (2004) Glass formation in plant anhydrobiotes: survival in the dry state. Cryobiology 48: 215–228. Buitink, J., Leprince, O., Hemminga, M.A. and Hoekstra, F.A. (2000) Molecular mobility in the cytoplasm: an approach to describe and predict lifespan of dry germplasm. Proc. Natl Acad. Sci. USA 97: 2385–2390.
Plant Cell Physiol. 51(3): 395–407 (2010) doi:10.1093/pcp/pcq005 © The Author 2010.
405
M. Shih et al.
Burke, M.J. (1986) The glassy state and survival of anhydrous biological system. In Membranes, Metabolism and Dry Organisms. Edited by Leopold, A.C. pp. 358–363. Cornell University Press, Ithaca, NY. Byler, D.M. and Susi, H. (1986) Examination of the secondary structure of proteins by deconvolved FTIR spectra. Biopolymers 25: 469–487. Chen, Z.Y., Hsing, Y.I.C., Lee, P.F. and Chow, T.Y. (1992) Nucleotide sequences of a soybean cDNA encoding an 18 kilodalton late embryogenesis abundant protein. Plant Physiol. 99: 773–774. Cohen, A., Plant, A.L., Moses, M.S. and Bray, E.A. (1991) Organ-specific and environmentally regulated expression of two abscisic acidinduced genes of tomato. Plant Physiol. 97: 1367–1374. Crowe, J.H., Hoekstra, F.A. and Crowe, L.M. (1992) Anhydrobiosis. Annu. Rev. Physiol. 54: 579–599. Cuming, A.C. (1999) LEA proteins. In Seed Proteins. Edited by Shewry, P.R. and Casey, R. pp. 753–780. C.H.I.P.S., New York. Devereux, J., Haeberli, P. and Smithies, O. (1994) A comprehensive set of sequence analysis programs for the VAX. Nucleic Acids Res. 12: 387–395. Dunker, A.K., Lawson, J.D., Brown, C.J., Williams, R.M., Romero, P., Oh, J.S., et al. (2001) Intrinsically disordered protein. J. Mol. Graph. Model. 19: 26–59. Dunker, A.K., Silman, I., Uversky, V.N. and Sussman, J.L. (2008) Function and structure of inherently disordered proteins. Curr. Opin. Struct. Biol. 18: 756–764. Dure, L., III (1993a) A repeating 11-mer amino acid motif and plant desiccation. Plant J. 3: 363–369. Dure, L., III (1993b) Structural motifs in Lea proteins. Curr. Top. Plant Physiol. 10: 91–103. Dure, L., III, Crouch, M., Harada, J., Ho, T.H.D., Mundy, J., Quatrano, R., et al. (1989) Common amino acid sequence domains among the LEA proteins of higher plants. Plant Mol. Biol. 12: 475–486. Goyal, K., Tisi, L., Basran, A., Browne, J., Burnell, A., Zurdo, J., et al. (2003) Transition from natively unfolded to folded state induced by desiccation in an anhydrobiotic nematode protein. J. Biol. Chem. 278: 12977–12984. Hoekstra, F.A., Golovina, E.A. and Buitink, J. (2001) Mechanisms of plant desiccation tolerance. Trends Plant Sci. 6: 431–438. Hoekstra, F.A. and van Roekel, T. (1988) Desiccation tolerance of Papaver dubium L. pollen during its development in the anther. Possible role of phospholipid composition and sucrose content. Plant Physiol. 88: 626–632. Hsing, Y.I.C. and Wu, S. (1992) Cloning and characterization of cDNA clones encoding soybean seed maturation polypeptides. Bot. Bull. Acad. Sin. 33: 191–199. Imai, R., Chang, L., Ohta, A., Bray, E.A. and Takagi, M. (1996) A lea-class gene of tomato confers salt and freezing tolerance when expressed in Saccharomyces cerevisiae. Gene 170: 243–248. Ingram, J. and Bartels, D. (1996) The molecular basis of dehydration tolerance in plants. Annu. Rev. Plant Physiol. Plant Mol. Biol. 47: 377–403. Ismail, A.M., Hall, A.E. and Close, T.J. (1999) Purification and partial characterization of a dehydrin involved in chilling tolerance during seedling emergence of cowpea. Plant Physiol. 120: 237–244. Kazuoka, T. and Oeda, K. (1994) Purification and characterization of COR85-oligomeric complex from cold-acclimated spinach. Plant Cell Physiol. 35: 601–611. Koag, M.C., Fenton, R.D., Wilkens, S. and Close, T.J. (2003) The binding of maize DHN1 to lipid vesicles. Gain of structure and lipid specificity. Plant Physiol. 131: 309–316.
406
Krimm, S. and Bandekar, J. (1986) Vibrational spectroscopy and conformation of peptides, polypeptides and proteins. Adv. Protein Chem. 38: 181–364. Lee, P.F., Chow, T.Y., Chen, Z.Y. and Hsing, Y.I.C. (1992) Genomic nucleotide sequence of a soybean seed maturation protein GmPM9 gene. Plant Physiol. 100: 2121–2122. Lisse, T., Bartels, D., Kalbitzer, H.R. and Jaenicke, R. (1996) The recombinant dehydrin-like desiccation stress protein from the resurrection plant Craterostigma plantagineum displays no defined three-dimensional structure in its native state. Biol. Chem. 377: 555–561. Marsh, D., Muller, M. and Schmitt, F.J. (2000) Orientation of the infrared transition moments for an alpha-helix. Biophys. J. 78: 2499–2510. McCubbin, A.G., Kay, C.M. and Lane, B.G. (1985) Hydrodynamic and optical properties of the wheat germ Em protein. Can. J. Biochem. Cell Biol. 63: 803–811. Nevskaya, N.A. and Chirgadze, Y.N. (1976) Infrared spectra and resonance interactions of amide-I and II vibration of alpha-helix. Biopolymers 15: 637–648. Nylander, M., Svensson, J., Palva, E.T. and Welin, B.V. (2001) Stressinduced accumulation and tissue-specific localization of dehydrins in Arabidopsis thaliana. Plant Mol. Biol. 45: 263–279. Parcy, F., Valon, C., Raynal, M., Gaubier-Comella, P., Delseny, M. and Giraudat, J. (1994) Regulation of gene expression programs during Arabidopsis seed development: roles of the ABI3 locus and of endogenous abscisic acid. Plant Cell 6: 1567–1582. Rosenberg, L.A. and Rinne, R.W. (1986) Moisture loss as a prerequisite for seedling growth in soybean seeds (Glycine max L. Merr.). J. Exp. Bot. 37: 1663–1674. Sambrook, J. and Russell, D.W. (2001) Molecular Cloning: A Laboratory Manual, 3rd edn. Cold Spring Harbor Laboratory Press, Cold Spring Harbor, NY. Shih, M.D., Hoekstra, F.A. and Hsing, Y.I.C. (2008) Late embryogenesis abundant proteins. Adv. Bot. Res. 48: 211–255. Shih, M.D., Lin, S.C., Hsieh, J.S., Tsou, C.H., Chow, T.Y., Lin, T.P., et al. (2004) Gene cloning and characterization of a soybean (Glycine max L.) LEA protein, GmPM16. Plant Mol. Biol. 56: 689–703. Soulages, J.L., Kim, K., Arrese, E.L., Walters, C. and Cushman, J.C. (2003) Conformation of a group 2 late embryogenesis abundant protein from soybean. Evidence of poly (l-proline)-type II structure. Plant Physiol. 131: 963–975. Soulages, J.L., Kim, K., Walters, C. and Cushman, J.C. (2002) Temperatureinduced extended helix/random coil transitions in group 1 late embryogenesis-abundant protein from soybean. Plant Physiol. 128: 822–832. Tunnacliffe, A. and Wise, M.J. (2007) The continuing conundrum of the LEA proteins. Naturwissenschaften 94: 791–812. Uversky, V.N. (2002) Natively unfolded proteins: a point where biology waits for physics. Protein Sci. 11: 739–756. Vereyken, I.J., Chupin, V., Hoekstra, F.A., Smeekens, S.C. and de Kruijff, B. (2003) The effect of fructan on membrane lipid organization and dynamics in the dry state. Biophys. J. 84: 3759–3766. Whitmore, L. and Wallace, B.A. (2008) Protein secondary structure analyses from circular dichroism spectroscopy: methods and reference databases. Biopolymers 89: 392–400. Wise, M.J. (2002) The POPPs: clustering and searching using peptide probability profiles. Bioinformatics 18 Suppl 1: S38–S45. Wise, M.J. (2003) LEAping to conclusions: a computational reanalysis of late embryogenesis abundant proteins and their possible roles. BMC Bioinformatics 4: 52–70.
Plant Cell Physiol. 51(3): 395–407 (2010) doi:10.1093/pcp/pcq005 © The Author 2010.
Characterization of two soybean seed LEA proteins
Wolkers, W.F., Alberda, M., Koornneef, M., Leon-Kloosterziel, K.M. and Hoekstra, F.A. (1998a) Properties of proteins and the glassy matrix in maturation-defective mutant seeds of Arabidopsis thaliana. Plant J. 16: 133–143. Wolkers, W.F., McCready, S., Brandt, W.F., Lindsey, G.G. and Hoekstra, F.A. (2001) Isolation and characterization of a D-7 LEA protein from pollen that stabilizes glasses in vitro. Biochim. Biophys. Acta 1544: 196–206. Wolkers, W.F., Tetteroo, F.A., Alberda, M. and Hoekstra, F.A. (1999) Changed properties of the cytoplasmic matrix associated with desiccation tolerance of dried carrot somatic embryos. An in situ
Fourier transform infrared spectroscopic study. Plant Physiol. 120: 153–164. Wolkers, W.F., van Kilsdonk, M.G. and Hoekstra, F.A. (1998b) Dehydration-induced conformational changes of poly-l-lysine as influenced by drying rate and carbohydrates. Biochim. Biophys. Acta 1425: 127–136. Xu, D., Duan, X., Wang, B., Hong, B., Ho, T.H.D. and Wu, R. (1996) Expression of a late embryogenesis abundant protein gene, HVA1, from barley confers tolerance to water deficit and salt stress in transgenic rice. Plant Physiol. 110: 249–257.
Plant Cell Physiol. 51(3): 395–407 (2010) doi:10.1093/pcp/pcq005 © The Author 2010.
407