Department of Computer Science ... between computational resources and leadership, presence .... significant difference between reported presence and co-.
Leadership and Collaboration in Shared Virtual Environments Anthony Steed, Mel Slater, Amela Sadagic Department of Computer Science University College London Gower St, London, WC1E 6BT, UK {A.Steed | M.Slater | A.Sadagic}@cs.ucl.ac.uk
Abstract We present an experiment that investigates the behaviour of small groups of participants in a wide-area distributed collaborative virtual environment (CVE). This is the third and largest study in a series of experiments that have examined trios of participants carrying out a highly collaborative puzzle-solving task. The results reproducing those of earlier studies suggest a positive relationship between place-presence and co-presence, between co-presence and group accord, with evidence supporting the notion that immersion confers leadership advantage.
1. Introduction This paper describes an experiment that was designed to investigate what happens when a small group of strangers meet together to carry out a joint task in a virtual environment. The issues of interest are the relationship between computational resources and leadership, presence of being in a place and co-presence, the sense of being with other people, and accord between the group members. This is the third in a series of experiments examining these issues, in an attempt to characterise what makes working together in virtual environments enjoyable and productive, or even possible.
2. Background In all three experiments we have used the following task. Groups of three strangers meet for the first time in an office environment. The participants have avatars coloured Red, Green or Blue, and refer to themselves and the others by colour throughout the experiment. They meet in a small room, and have to find their way together to another room that has a series of puzzles written on pieces of paper stuck around the walls. On each piece of paper is a set of words or phrases each prefixed by a number. The participants have to rearrange all the words
Adrian Bullock, Jolanda Tromp Department of Computer Science University of Nottingham University Park, Nottingham, NG7 2RD, UK {A.Bullock | J.Tromp}@cs.nott.ac.uk
with the same number in order to form a pithy saying. This task was chosen because it requires collaboration between the members since it is difficult for one participant to remember all the words in the phrase. The task can be divided by each participant examining a different area of the room. The first experiment was an exploratory study to generate hypotheses about how people would conduct themselves in such a highly collaborative task[5]. For this purpose, the scenario was carried out by each trio twice, first in a virtual environment, and then in the real environment from which the virtual had been modelled. In the virtual experience, one participant was immersed using a head-mounted display, and the others were using desktop machines. The scenario was implemented in the Dive3.2 software[2]. There were 10 groups in the study. The results suggested that the immersed person tended to emerge as leader in the virtual group, but that this advantage was lost in the real meeting. Group accord tended to be higher in the real meeting than in the virtual meeting. Responses such as embarrassment could be generated in the virtual meeting, even though the individuals were presented to one another by very simple avatars. The study also found a positive relationship between presence of being in a place, and co-presence, that is the sense of being with the other people. Accord in the group increased with presence, the performance of group, and with the proportion of females in the group. The second experiment demonstrated the feasibility of carrying out a similar study over a wide-area network [7]. Four groups of 3 participants completed the virtual version of the task only. The scenario was implemented in the Dive3.2 software[2]. There was no immersed participant and correspondingly no correlation of leadership with immersion. There was evidence supporting the earlier results on group-accord.
3. Experimental Design In this latest experiment there were three participants in
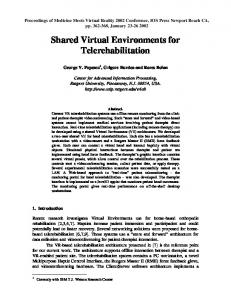
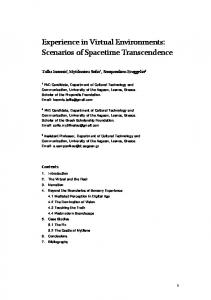
Figure 1. Overview of the environment.
each trial; one at University College London, UK, one at the University of Nottingham, UK and one at Integrated Information Systems, Greece. The difference in display characteristics between participants was re-introduced with the purpose of examining whether the network condition would remove the effect of immersion. Given the distributed nature of the experiment, a rigorously timed schedule was prepared and carried out. The participants spent 4 or 5 minutes training to navigate using the system. Once this was completed, the task was explained and the participants were told their colour, and instructed to refer to each other only by colour. Throughout the trials the UCL participant was Blue (immersed), the Nottingham participant was Red (nonimmersed) and the IIS participant was Green (nonimmersed). Once all sites had completed this set-up stage, the multi-user session was started in co-ordination between the sites. The participants entered the environment (Figure 1) and introduced themselves to one another and decided how to complete the task (Figure 2). The task was limited to 15 minutes duration. A questionnaire was then used to elicit information regarding the areas of interest outlined in the introduction: the relationship between co-presence and presence, the relationship between both types of presence and immersion, the relationship between both types of presence and accord within the group, and the extent to which leadership is conferred by immersion. Self-reported presence was assessed by six questions each on a 7-point scale, with the higher score indicating higher presence. The questions (paraphrased here) required a response to the extent to which: 1. there was a sense of being in the room which has pieces of paper with the riddles; 2. there were times during the experience when the real world of the office in which the experience was really taking place was forgotten;
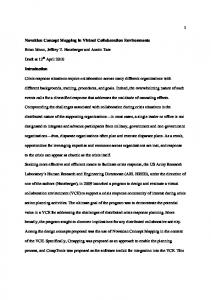
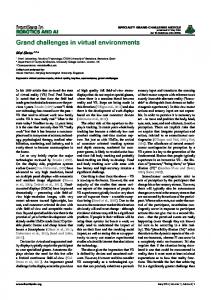
Figure 2. Red, Green and Blue examining one of the posters. 3. that the virtual place is thought of as somewhere visited rather than just images that were seen; 4. the sense of being in the virtual place was stronger than of being in the real world of the office; 5. the structure of memory of the virtual place is similar to the structure of memory of real places; 6. the virtual experience was overwhelming In line with previous experiments where these questions have been employed (e.g. [6]) the overall measure was conservatively taken as a count of how many scores of ‘6’ or ‘7’ were given to the questions. Reported co-presence was assessed by eight questions on the theme of ‘being with the other people’. These were again rated on a 7-point scale, and required a response to the extent to which: 1. there was a sense of being with the other people; 2. the computer interface seemed to vanish and there was direct working with the other people; 3. the experience was more like working with other people rather than interacting with a computer; 4. other people were forgotten and concentration was on the task as if the individual was the only one; 5. the experience was like some other real experience of working together with people; 6. a sense of being with other people rather than just experiencing computer images; 7. the experience resembled being together with others in a real-world setting; 8. there was a sense of other human beings interacting with the individual; Overall co-presence was measured as the number of ‘6’ or ‘7’ scores out of the eight questions. Accord was assessed by a series of questions relating to enjoyment, harmony and cooperation of the group. These questions were rated on a 7-point scale, and concerned the extent to which: 1. the experience was enjoyed in a similar manner to a
previous real meeting that was enjoyable; 2. there was a desire to meet the other two people; 3. the group was in harmony during the task; 4. the person felt comfortable with the other two; 5. there was a desire for the group to form again; 6. the other two people were cooperative; 7. there was no embarrassment. Overall accord was measured as the average response across all of these questions. There were two questions that related to leadership, one directly and the other indirectly. Each participant was asked to score (out of 100) all three participants on the degree to which that person “was the ‘leader’ or main organiser”. In addition, there was a similar question concerning who did most of the talking. An overall leadership score was constructed for each individual by taking the average of the assessments of the other two members of the group. A similar method was used for ‘talkativeness’. In order to take into account the impact of personality on the results there was a final question that assessed the extent to which the individual generally experienced social anxiety in everyday life. This employed the Interaction Anxiousness Scale[3] where fifteen statements are given, and the participant has to respond in a range of 1-5, where the higher score corresponds to a higher social anxiety. An example statement is “I often feel nervous even in casual get-togethers” for which the responses range from “the statement is not at all characteristic of me”(1) to “the statement is extremely characteristic of me”(5). The average score amongst the general population for this test is reported as 38, whereas for those with social anxiety problems the average score is 55. For the participants in this experiment the average social-phobic scores amongst the three groups were 32 (Red Nottingham), 35 (Green - Greece), 36 (Blue - London).
4. Technical Description We used the dVS/dVISE 5.0 software from Division Ltd[1] to implement the scenario. dVS does not support audio communication between participants, hence the Robust-Audio Tool (RAT) v.3.0.23 was used alongside the main application. The environment ran at 20-30Hz on all client machines. The machine at UCL was a Silicon Graphics Onyx with twin 196 MHz R10000 processors, Infinite Reality graphics and 192M of main memory. The machine at Nottingham was a Silicon Graphics Indigo2 with a 200MHz R4400 processor, High Impact graphics and 192M of main memory. The machine at IIS was a Silicon Graphics Octane with a 195MHz R10000 and 128M main memory. The final machine involved was the dVS and
audio server at UCL. This was a Silicon Graphics Indigo2 with a 200MHz R4400 processor and 64M of main memory. The dVS system uses a central server to distribute initial scene state, and subsequently uses peer to peer connections for event delivery. The participant at UCL used an immersive system employing a 2 tracker Polhemus Fastrak, Virtual Research VR4 helmet and a 3D mouse with 5 buttons. The other two participants used a desktop system with a 1280x1024 screen and a 2D mouse with three buttons. The experiment was carried out over a network used for weekly trials by the partners of the COVEN project [4]. Each site was connected over ISDN to UCL with mean round trip times over all trials being 100ms between Nottingham and UCL, 450ms between Nottingham and IIS and 300ms between UCL and IIS.
5. Results of the Statistical Analysis There were 20 groups of 3 participants in the study. The results of 14 participants were eliminated from the analysis because of incomplete questionnaires. Of these 8 were the Green participants located in Greece. There is obviously considerable difficulty in conducting a study involving people with different native languages, and this is probably reflected in the relatively high proportion of non-native English speakers with incomplete questionnaires. Co-presence and Presence: As found in the previous experiments there was a significant positive relationship between presence and co-presence. Since co-presence is scored as a count out of 8, logistic binomial regression can be used with co-presence as the response variable, and the presence score as the explanatory variable. This results in a significant fit (Chi-squared = 18.6 on 1 d.f.). This relationship is practically important whatever the reason for the correlation. If one influences the other, or if they are both independently caused by the same underlying factors, it is useful to know that benefiting one may positively influence the other. Presence and immersion: There was no reported significant difference between reported presence and copresence between the immersed and non-immersed participants. Again this is in line with the previous results. Presence and Accord: As found previously, individual accord is positively associated with copresence. The square of the correlation coefficient (R2) is 0.38, and the fit is significant at the 5% level. Leadership and Immersion: In the first study the immersed participants tended to emerge as leaders in the virtual session but not in the real session. In the second study there were no immersed participants, and no special pattern of leadership emerged. In this study the situation is more complex, and still
there is no uncomplicated answer that can be given with confidence to this question. The Green participant (in Greece) was almost never the leader. There is strong evidence that the participants in Greece experienced the dual problem of language difficulties with also the poorest audio response. The speed of the network connection from London to Greece and from Nottingham to Greece, was 3 to 5 times slower than between London and Nottingham. Recall also that eight of the twenty Green participants had been eliminated from the questionnaire data. There was a very high correlation, as found in the earlier studies, between leadership rating and degree of talkativeness (R2 = 0.82). In fact 85% of the variation in overall leadership score can be accounted for by the degree of ‘talkativeness’ (positive correlation) and the extent of social anxiety (negative correlation). Independently of any other factors, the more talkative and the less social discomfort a person generally experiences, the more likely they were to have been rated as leader, which is to be expected also in real-life meetings. Leadership and degree of talkativeness may be considered as different aspects of one overall leadership variable, computed as the average of the two. Using this as a response in a regression analysis, 40% of the variation in the response can be accounted for by the ‘colour’, gender and social-discomfort as explanatory variables. A summary of the regression analysis is shown in Table 1. Bearing in mind that average social anxiety score of 32 for Red, the analysis suggests a leadership advantage for the Blue participants, but not for the female participants. For the males, substituting in the social anxiety score of 32 for the Red participants gives a predicted score of 29. Since the social anxiety score is not significant for the Blue participants, their predicted score is 63. In the case of the females, substituting in the average social anxiety score gives a predicted leadership rating of 29 for the Red females, and it is also 29 for the Blue females. It is possible that the use of the head-mounted display disadvantaged females compared to males. Table 1: Regression of Overall Leadership Red Green Blue
Male 51 0.7*social_phobic 19+ 0.3*social_phobic 63– 0.5*social_phobic
Female 64 0.7*social_phobic 12+ 0.3*social_phobic 29– 0.5*social_phobic
Non significant results are in italics.
6. Conclusions The results of the statistical study based on the
questionnaire responses offers further support for the relationship between co-presence and presence, between co-presence and group accord. The question of immersion and leadership is still very much an open one, though there is evidence here supporting the notion that immersion confers leadership advantage.
Acknowledgments Manolis Avagianos and Nikos Kladias ran the experiments at IIS, and Lisa Miller assisted at UCL. The COVEN project is funded by the European ACTS Framework, project number AC040.
References [1] [2]
[3]
[4]
[5]
[6]
[7]
Division Ltd (1997) dVISE VDI Reference, Division Ltd, Bristol, BS32 4JT, UK, http://www.division.com Frecon, E. and Stenius M. (1998) DIVE: A Scaleable Network Architecture for Distributed Virtual Environments, Distributed Systems Engineering Journal Special Issue on Virtual Environments, 5, pp.91-100. Leary, M. (1983) Social Anxiousness: The Construct and its Measurement, Journal of Personality Assessment, 47, 66-75. Normand, V. et al. (1999) The COVEN Project: Exploring Applicative, Technical and Usage Dimensions of Collaborative Virtual Environment, Presence: Teleoperators and Virtual Environments, 8(2), in press. Slater, M., Sadagic, A., Usoh, M., Schroeder, R. (1999) Small Group Behaviour in Virtual and Real Environments: A Comparative Study. Accepted to Presence: Teleoperators and Virtual Environments. Slater, M. Usoh, M., Steed, A. (1995) Taking Steps: The Influence of a Walking Metaphor on Presence in Virtual Reality, ACM Transactions on Computer-Human Interaction (TOCHI) 2(3) September, 201-219. Tromp, J.G., Steed, A., Frecon, E., Bullock, A., Sadagic, A., Slater, M. (1998) Small Group Behaviour Experiments in the COVEN Project, IEEE Computer Graphics and Applications 18(6), 53-63.