eye tracking, proactive interfaces, Midas touch, pervasive comput- ing, ubiquitous computing, object selection, information retrieval. 1. INTRODUCTION.
Learning Relevance from Natural Eye Movements in Pervasive Interfaces Melih Kandemir1
Samuel Kaski1,2
1
Helsinki Institute for Information Technology HIIT, Department of Information and Computer Science, Aalto University 2 Helsinki Institute for Information Technology HIIT, Department of Computer Science, University of Helsinki
{melih.kandemir, samuel.kaski}@aalto.fi ABSTRACT
very attractive research direction (see [5] for a comprehensive survey). Bolt [3] has done the pioneer work on using eye movements as an interaction modality where the user is able to select and zoom one of several video streams simultaneously playing on a computer screen. Eye gaze-based interaction is typically designed to be done by intensively looking at visual items. A common problem is that normal attention and natural eye movements easily cause unintentional clicks, which is known as the Midas touch problem [12]. To avoid this, a predefined pattern of eye movements may be required for doing the actual selection of the object being looked at. Examples are looking at the item of interest longer than a threshold (dwelltime thresholding) [12], following a specific trajectory (eye gesturing) [35], looking at another copy of the item (antisaccades) [9] or at a button [33] after the item of interest. Such interfaces are desirable for people having hand disabilities and workers who need their hands for other tasks, and additionally they may suit the personal taste of some users. Some tasks such as text typing [32] can be performed by eye movements faster than using more traditional input modalities. Eye movements can also be used as a side modality to facilitate the interaction. Fast pan-zoom [28] and fast scrolling [16] are among the successful applications of gaze-supported interaction. An alternative way of designing eye gaze-based interfaces is to build a proactive interface based on natural eye movements. By natural, we mean that the user does not need to use her eyes for any artificial behaviour, such as the ones listed above, but instead she can just look around in a natural way. A proactive interface [30] is a means of user interaction where the computer guesses the needs of the user and takes helpful actions without any explicit command. This concept has been used in the eye gaze-based user interaction research in various ways. Hyrskykari et al. [10] developed a text reader which automatically infers from the eye movements the words that the reader wants to look up from a dictionary. Hardoon et al. [7] introduced a text retrieval engine that constructs the queries by inferring the relevance of the words in the vocabulary from the eye movements on the previously read documents. Oyekoya et al. [20] proposed an image retrieval system working on eye movement-based queries. Kozma et al. [15] developed an eye movement-based zooming interface for image databases. Image relevances were inferred from eye movements, and then the retrieved images were displayed on zoomable nested circles. By zooming in, the user gets to see more relevant images. In this paper, we study whether proactive interaction with realworld objects via natural eye movements is possible in pervasive
We study the feasibility of the following idea: Could a system learn to use the user’s natural eye movements to infer relevance of realworld objects, if the user produced a set of learning data by clicking a “relevance” button during a learning session? If the answer is yes, the combination of eye tracking and machine learning would give a basis of “natural” interaction with the system by normally looking around, which would be very useful in mobile proactive setups. We measured the eye movements of the users while they were exploring an artificial art gallery. They labeled the relevant paintings by clicking a button while looking at them. The results show that a Gaussian process classifier accompanied by a time series kernel on the eye movements within an object predicts whether that object is relevant with better accuracy than dwell-time thresholding and random guessing.
Categories and Subject Descriptors H.5.2 [Information Interfaces and Representation]: User interfaces—input devices and strategies
General Terms Algorithms, Human Factors
Keywords eye tracking, proactive interfaces, Midas touch, pervasive computing, ubiquitous computing, object selection, information retrieval
1.
INTRODUCTION
Eye gaze is correlated with visual attention [13]. This property makes eye movements a plausible modality for human-computer interaction. The attractive prospect of hands-free control with the eyes further motivates eye gaze driven computer interaction as a
Permission to make digital or hard copies of all or part of this work for personal or classroom use is granted without fee provided that copies are not made or distributed for profit or commercial advantage and that copies bear this notice and the full citation on the first page. To copy otherwise, to republish, to post on servers or to redistribute to lists, requires prior specific permission and/or a fee. ICMI’12, October 22–26, 2012, Santa Monica, California, USA. Copyright 2012 ACM 978-1-4503-1467-1/12/10 ...$15.00.
85
setups. We assume that the user is mobile and her eye movements are tracked. There are real-world objects around, and the computer the user wears is able to detect these objects and retrieve information about them. In this paper we report the first results on the feasibility of building a proactive interface for interacting with the objects. Various applications are possible given such a well-working interface. One example is Lifelogging [19]. A proactive interface can automatically extract a summary of a day of the user by taking snapshots of the important moments detected from her eye movements. Another example is a proactive information retrieval device that infers how interesting the real-world object being looked at, for instance the face of a person in a conversation, is to the user, and retrieves useful information such as the business card of that person in case the object is interesting enough. By default, the retrieved information will be shown only by the user’s request, but if the inference of interestingness can be done accurately enough, the interface can be used even more proactively. In particular, the realworld scene can be thought of as a point-and-click interface where the items are real-world objects, and the “implicit” click commands can be inferred from the eye movements. This can also be viewed as a zero-effort solution to the Midas touch problem. Small-effort solutions in pervasive interfaces have been proposed in several studies. Park et al. [21] used dwell-time thresholding. Baldauf et al. [2] proposed blinking for longer than two seconds. Lee et al. [17] introduced half-blinking. All of these methods are based on explicit commands, and hence prohibit “natural” use of the eyes. All of these studies are prototype proposals; none of them reports on analyses about the users’ task performance. In a previous work that motivated this study, we observed that it is possible to infer the relevance rankings of real-world objects from eye movement patterns in augmented video to a small extent using simple machine learning techniques [14]. There we assumed that the correct answers are available a priori for learning, and in practice we needed to make artificial assumptions. What we propose in this paper gives the users the chance to collect the learning data in natural setups, enhancing the adaptation of the learner to the ecology it operates on. For the feasibility study, we designed an experiment where five test subjects explored an experimental art gallery, wearing a headmounted eye tracker. We have chosen an art gallery scenario, similar to [17, 21], to simulate a case where several objects with rich visual content are being looked at. The subjects carried a button in their hand and clicked it when they encountered an interesting (“relevant”) painting. We then investigated how well the relevance of the paintings can be predicted from the measured eye movement patterns. Two alternative setups are possible for predicting the relevance. The first, more difficult one, is to predict all the time, in practice for every short window of time. The second, more feasible setup is to make one prediction for each encountered object. The latter requires a pattern recognition system to be available for detecting the objects. We will investigate the accuracy of the predictions as a function of the time delay from encountering the object; the accuracy will obviously increase as a function of the delay, as new evidence accumulates. Our result is that the first setup is too difficult to be practical, even though the results are better than random, whereas in the second setup a standard Gaussian process classifier with a linear time warping kernel is able to predict the relevant paintings with a reasonable level of accuracy. Explicit eyecommands [2, 17, 21] are naturally even more accurate but since giving explicit commands by the eyes is disturbing in many contexts, this outcome encourages investigating the use of “natural”
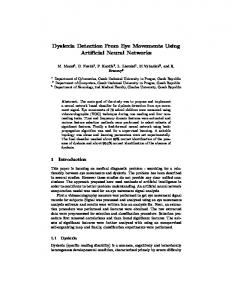
Eye Tracker
Forward Pointing Camera
Video of user's view
Object Recognizer
Eye Coordinates
Relevance Predictor
Boundaries of detected objects
Object Relevance
Interaction Interface
Figure 1: A systems architecture for pervasive interaction by natural eye movements.
eye movements in lifelogging applications, and for building pervasive recommender systems.
2. PROACTIVE NATURAL INTERACTION BY EYES We will first list the components that are needed in a processing platform as a background for the proposed eye movement-based interaction. Then we give the details of the machine learning setup that we introduce for proactive interaction, for predicting object relevances from eye movements. Based on the results, we then draw conclusions on the feasibility of pervasive proactive interaction with natural eye movements.
2.1 The Platform Architecture The block diagram in Figure 1 shows the essential components of the pervasive interaction platform that we assume. The platform includes a mobile eye tracker for (implicit) user interaction, and a forward pointing camera for detecting objects and their locations. There is an object recognition tool for identifying the objects, their locations and boundaries in the field of view. In this study, we approximated the object boundaries by their bounding boxes for computational simplicity. Whenever the user’s eyes point at an object, the relevance predictor computes a relevance estimate for that object from the eye trajectory in the object boundaries, using a machine learning algorithm. The system will learn to predict relevance off-line, and the learned relevance predictor algorithm will then be used on-line in an automatic mode to predict relevances. In the off-line learning phase, “ground truth” relevance will need to be known for the data. We propose collecting the data in a manual mode where the user can mark relevant objects explicitly, using any clicking method such as dwell-time thresholding, button clicking etc. During this mode, the system will be collecting data whose labels come from the user’s manual clicks. The relevance prediction algorithm can then be trained on this labeled data set, after which the relevances can in the automatic mode be predicted for new data, for which only eye movements are available. Since no explicit eye movement control is needed in the on-line mode, the user can maximally concentrate on the real world. If the predictions are accurate enough, the relevance predictions can be used to directly trigger actions. For instance, if the object has high relevance, more information about the object can be retrieved from a database or the Internet, and presented in a non-intrusive way. Presentation options are augmented audio [1] or augmented vision, presenting information visually on data goggles. Several pervasive interaction platforms have been introduced pre-
86
viously. The Touring Machine [6] is one of the pioneer studies on augmenting outdoor objects with virtual tags. The objects are clicked either by positioning them at the center of the field of view for longer than a specific time threshold, or alternatively by pointing and clicking a cursor on a trackpad that the user holds in her hand. In [27], usability of goggles for pervasive augmented reality is investigated at a conceptual level. The objects are clicked by pointing with a finger. Neither of these studies used eye movements for interaction. Eye movements have started to be used in pervasive interaction more recently. Nilsson et al. [18] took the user commands via virtual buttons shown on the field of view. Ishiguro et al. [11] introduced a so-called life event extraction system that detects new objects and recognizes previously seen objects in natural scenes, and displays augmented textual information about the recognized objects. Eye movements are used for narrowing the search space to the surroundings of the point of attention. The act of looking at an object is considered a smart lens [25], and the object is augmented. In [1], a hardwired estimator of object relevance from gaze intensity (the proportion of the time an object is looked at within a fixed-length time window [22]) was used as a contextual cue for information filtering in a wearable pervasive information access system. In this paper, we complement these studies by including a new component, an adaptive relevance estimator based on fully natural eye movements, and carry out a quantitative analysis on the prediction performance.
Bounding Box
Object
1
5
4
6
2
3
Dwell Session 1
2
3
4
5
6
Timeline
Figure 2: The concept of dwell session is illustrated in spatial (top figure) and time (bottom figure) domains. The green area represents the boundaries of an object in the visual scene. The dotted rectangle is the bounding box of the object, which represents its approximate boundaries detected by the system. Yellow circles are fixations numbered by their occurence order. The solid line below is the timeline going from left to right. Yellow rectangles are fixations. Fixations from 2 to 5 form a dwell session. sessions, each being a labeled multivariate time series of eye-movement features. The time series is formed by dividing the timeline into short intervals of uniform length and representing each interval with a data vector. We preferred one second as the interval length for simplicity in calculations. A data vector is composed of the following six features:
2.2 Prediction of Object Relevance The key question we investigate in this paper is how feasible is natural eye movement-based proactive interaction in wearable pervasive setups. To this end, we carry out a feasibility study with a probabilistic model that predicts real-world object relevances from natural eye movement patterns. We take the prediction performance of this model as a benchmark to measure the feasibility of the proactive eye movement-based interaction idea. Regarding when to make the predictions we propose two options. The first, which is both difficult and computationally demanding (as will be detailed in Section 4), is to make predictions at every time instant. The second option is to predict the relevance of each object the user looks at. For this, we introduce the concept of dwell session, to be the time interval that the user’s visual attention is continuously inside a particular object. Figure 2 illustrates the concept. A less time-accurate version of this concept, named as models of interest, has been introduced earlier as a method for partitioning the timeline by the objects being looked at [29]. It was used for fast browsing of previously recorded eye movements. A minor technical detail is that the dwell session concept implicitly assumes that the user does not click more than once within a dwell session. In our experiments, we observed multiple clicking within a dwell session only once in 23 clicks, which we consider as a noise in the modeling. A dwell session is labeled positively if it includes any click. Hence, the extra click did not affect the label. When making predictions during the dwell session, a trade-off needs to be made. On the one hand, the more quickly the model predicts the relevance and the system takes an appropriate action, the more the user experience potentially improves. On the other hand, a quicker prediction would necessarily be less accurate, since it will be made based on more limited observations of the eye movement pattern. In this study, we aim at quantifying this trade-off by studying performance as a function of the prediction delay from the beginning of the dwell session. For dwell sessions that last shorter than the delay period, we take the entire time series. The data set for learning the predictor is constructed of the dwell
• mean and standard deviation of saccade length in the previous three intervals, • mean and standard deviation of fixation duration in the previous three intervals, and • mean and standard deviation of pupil area in the previous three intervals. The context depth was set to three seconds; the results for 2, 2.5, 3.5, and 4 seconds were similar (not shown). The raw eye trajectory is segmented into saccades and fixations by grouping each consecutive set of targets within a radius of 25 pixels into one fixation and the jumps between fixations as saccades. In order to exploit the known correlation between fixation duration, pupil size, and mental activity [8], we include the mean and standard deviation of these measures into our feature set. The object relevance can be predicted using any classifier that is able to operate on a data set each data point of which is a time series with an attached binary label. The kernelizeable classifiers, such as the support vector machine (SVM) [31] or the standard binary Gaussian process (GP) classifier [24], accompanied by a time series kernel are among suitable choices. We preferred the GP classifier over SVM in order to get probabilistic predictions. The results for the SVM were very similar. Let X = [x1 , x2 , · · · , xN ] be a set of N dwell sessions, and y = [y1 , y2 , · · · , yN ] be the binary vector of their ground-truth relevances. The GP classifier assumes a latent function f ∈ R between the input pattern and the output label which is governed by a Gaussian process. The sign and the magnitude of this function indicates the predicted class and the prediction confidence respectively, for binary labels {−1, +1}. The predictive distribution of
87
the label y ∗ for a test pattern x∗ is � p(y ∗ = +1|X, y, x∗ ) = p(y ∗ = +1|f ∗ ) p(f ∗ |X, y, x∗ )df ∗ where p(f ∗ |X, y, x∗ ) =
�
p(f ∗ |X, x∗ , f ) p(f|X, y)df ,
3.1 Procedure and Design The art gallery was composed of 14 colored paintings printed out on A4-sized papers and attached to the walls of a room in groups of three, five, and six paintings as shown in Figure 3. We drew lines on the floor at a distance of one meter from the paintings, and instructed the subjects not to cross them. The motivation of this setup was to get several objects into the view at the same time, so that the user would continuously be in the process of considering not only whether to click on the painting she was looking, but also whether to switch to another object in the view. There were on average 2.33 paintings simultaneously in the view, with standard deviation of 0.90. Augmented reality markers were attached to the paintings in order to identify the objects and automatically detect their boundaries from the video data. We used the software platform introduced in [1] for this task. The subjects were equipped with a mobile eye tracker, a forward-pointing camera, and a small laptop to be held in their hands. They were asked to keep their finger on the space button of the laptop throughout the experiment and click it when they were interested in a painting that they were looking at. In order to keep the test subjects concentrated on the paintings during the experiment, we assigned them a task appropriate for visiting an art gallery. They were told that they would report in the end a list of the four best paintings. Four was chosen as a reasonable length that is large enough to demand considerable mental effort for comparing paintings and small enough to keep the entire list in mind. They started with an empty list in mind, and pushed a painting into the list by a click. If the list was already full, when clicking they replaced a chosen painting already in the list with the new one. This way, they had to keep in mind an unordered list of the best four paintings from the beginning to the end of the experiment. All subjects accomplished this memory task without any reported difficulty. The subjects were allowed to visit the painting groups multiple times. The experiment of one subject lasted 229 seconds on average with 59 seconds of standard deviation, and each subject clicked 6 to 13 times. The subjects performed 8.40 clicks on average with standard deviation of 3.44. Five naive male undergraduate and postgraduate university students aging from 23 to 27, with mean 24.80 and standard deviation of 1.48 participated in the experiments. The test subjects volunteered and did not get paid.
(1)
and the vector f = [f1 , f2 , · · · , fN ] contains the values of the latent function for the training data points. The predictive distribution of the latent function p(f ∗ |X, x∗ , f ) is the same as the predictive distribution of GP regression. By the Bayes’ theorem, the posterior of the latent function can be expressed as: p(f |X, y) =
p(y|f )p(f |X) . p(y|X)
Here, f |X ∼ GP(0, K) is the standard Gaussian process prior on the training data, where K is the covariance matrix with entries calculated by the kernel k(x, x� ) for each pair of training samples. The likelihood function p(y|f ) = σ(f ) is a sigmoid function that converts latent function values into posterior � z class probabilities. We used the probit function Φ(z) = −∞ N (τ |0, 1)dτ as the likelihood function. The denominator p(y|X) is the marginal likelihood, which typically appears as a constant in the inference stage, since it is not a function of f . The integral in Equation 1 is intractable due to the nonlinearity of the likelihood function. We adopted the standard Laplace method [34] to solve this integral, which approximates p(f|X, y) by a Normal distribution. We treat p(y = +1|x) as an estimate for the relevance of the object being looked at an instant. We avoided formulating the problem as a regression problem since it would be tedious, if not impossible, to gather ground truth data for intermediate relevance levels. We made our analysis using the GPML implementation [23] of binary GP classification. In our setting, we require a kernel that measures the similarity between two multivariate time series of possibly different lengths. One standard way of making two time series of different lengths comparable is to align them. An alignment can be viewed as an element-wise matching between data points of two time series. In this work, we adopt the standard linear static time-warping as the alignment method to keep the model as simple and computationally efficient as possible. More formally, the kernel function is as follows [26]: L 1� k(X, V) = φ(xψ(t) , v θ(t) , σ). L t=1
3.2 Apparatus We used an SMI iView X HED 1 model mobile eye tracker for recording the eye movements. The sampling rate of the eye tracker was 50 Hz. To ensure the stability of the recordings against head movements, the tracker was attached to a bicycle helmet. The device included a web camera with a resolution of 757 × 480 pixels that was placed in front of the helmet for recording the view of the user. We identified the markers and their locations by postprocessing the recorded field of view video of each test subject, using the AR software of [1].
(2)
Here, the ψ(t) = �(|X|/L)t� and θ(t) = �(|V|/L)t� are the linear time-warping functions, L is an arbitrary integer, and φ(xi , xj , σ) = exp(−�xi − xj �2 /σ 2 ) is the radial basis function with length scale σ. We choose L = max(|X|, |V|) × 2. We choose σ as the square-root of the feature vector dimensionality, adopting the customary heuristic [4] coming from the fact that the total variance of a z-score normalized data set equals the feature vector dimensionality.
3.
4. RESULTS As discussed in Section 2.2, there are two alternative setups for predicting the object relevance. We started with the first and more difficult one, of making predictions at every fixed-length short time window. When the one-second time slots within the dwell sessions of all subjects are treated as individual data points, we obtain a data set of 687 samples, only 23 of which are positively labeled (con-
EXPERIMENTS
To test predictability of object relevance from natural eye movements, we design an experiment where the subject encounters many real-world objects within a short time interval, to ensure collecting enough data for testing. An “art gallery”, where the subject explores the paintings and marks a subset of the paintings as relevant, is a suitable scenario for this goal.
1 http://www.smivision.com/en/gaze-and-eye-trackingsystems/products/iview-x-hed.html
88
Figure 3: The experimental art gallery that consisted of three groups of paintings. In total 14 paintings from four painters were displayed. 1
taining clicks). We used randomly chosen 75 per cent of the data for training, and the rest for testing. We repeated this procedure for 50 splits and reported the average of these replications. As shown in the Receiver Operating Characteristic (ROC) and the precision-recall curves in Figure 4, this learning setup delivers only a marginal improvement over uniform random guessing, which does not look promising for practical usage. One main reason behind this poor performance is likely to be that in this setup we attempt to predict the precise timing of the click (the time interval for which the relevance is known to be maximal) within the dwell session, although the change in the user’s eye movement patterns based on her interest does not necessarily take place right at the click time. This difference might get detectable only when the entire dwell sessions are compared, instead of short time windows. Furthermore, the severe class imbalance makes the machine learning task difficult. In the alternative prediction setup discussed in Section 2.2, of predicting relevance for each dwell session, the data for each prediction is a time series of short time windows during the dwell session. We again studied multi-user prediction, by pooling together the data collected from all users, as in the previous setup. This way, we have more learning data than for individual users. Our data set consists of 63 dwell sessions, 23 of which are labeled positively. The duration of the dwell sessions varied from 3 to 34 seconds. We used a randomly selected 75 per cent of the data set for training and the rest for testing. We repeated the entire analysis for 50 splits to training and test sets. All the results given in the figures below are averages over the 50 replications. We compared our eye movement-based relevance predictor to three baselines. The first measures how long the user looks at an object (the dwell time), and predicts a click when the dwell time exceeds a threshold (which was optimized on training data using line search). This corresponds to an adaptive version of the clicking method used in [21]. This is the only existing eye movement-based relevance prediction method for pervasive scenes. The second is the standard baseline of predicting the largest class, which is not useful in practice as it would never predict non-zero relevance. The third is random guessing according to the prior probabilities of the classes (class ratio in the training data). Figure 5 shows the prediction accuracy, area under ROC curve (AUC), and F1 score (the harmonic mean of precision and recall) of our model and the baselines as a function of prediction delay (the prediction time relative to the start of the dwell session). Our model is better than the alternatives on a grand majority of delays, and the differences are significant at each delay for one or more of the three metrics when the delay is larger than 3 seconds. Notice that F1 score is undefined for dwell-time thresholding for delays shorter than the learned threshold (12 seconds) since it constantly
0.9
Our model Random Guess
0.8 0.7
TPR
0.6 0.5 0.4 0.3 0.2 0.1 0 0
0.2
0.4
0.6
0.8
1
FPR
(a) ROC Curve 0.25 Our model Random Guess
Precision
0.2
0.15
0.1
0.05
0 0
0.2
0.4
0.6
0.8
1
Recall
(b) Precision-recall curve Figure 4: Predicting relevance for each short time instance is better than but close to random guessing. The ROC (a) and precision-recall curves (b) of this setup are given in solid red, and uniform random guessing with the dashed black line.
predicts zero relevance. We interpret the clear improvement of our model over random guessing and majority voting as a strong evidence to the discriminative effect of user’s interest on eye movements. On the other hand, outperforming dwell-time thresholding indicates that this discriminative effect is primarily observable on patterns of eye movements, rather than dwell duration. It is also worthwhile to note that our model follows a rather steadily increasing trend proportional to delay in all performance metrics, which implies that prediction delay can be thought of as a user-tunable configuration parameter. Since it is more user-friendly to make the prediction as early as possible, we take a closer look at the performance at short delays. Precision-recall curves of our model and random guessing are shown in Figure 6 for four to seven seconds of delay. Dwell-
89
85 80
60 55 50
Avg. Session Len. Our Model Dwell−Time Majority Random Guess
45 40 5
10
15 20 Delay (sec.)
(a) Accuracy
25
30
0.7
0.7 0.65
F1 score
Accuracy (%)
65
Area Under Curve (AUC)
0.75
70
35
0.8
0.8
75
0.6 0.55 0.5
Avg. Session Len. Our Model Dwell−Time Majority Random Guess
0.45 0.4 0.35
5
10
15 20 Delay (sec.)
25
0.6
0.5
0.4
Avg. Session Len. Our Model Dwell−Time Random Guess
0.3
30
5
(b) Area Under ROC Curve (AUC)
10
15 20 Delay (sec.)
25
30
(c) F1 score
Figure 5: Our model predicts the relevant paintings with better accuracy than the baselines. The prediction accuracy (a), area under ROC curve (b), and F1 score (c) are plotted as a function of the prediction delay from the beginning of the dwell session, for our model (in blue circles), dwell-time thresholding (green triangles), majority voting (horizontal dashed pink line), and random guessing by class ratio (horizontal solid red line). The F1 scores of majority voting and dwell-time thresholding for delays less than the learned threshold (12 seconds) are skipped since F1 score is undefined for a predictor that constantly gives negative output. The vertical dashed black line shows the average dwell session duration. Our model’s improvement over all baselines is statistically significant in at least one metric for delays larger than three seconds (Wilcoxon signed-rank test over the scores for 50 splits: p < 0.05). out for finding out whether the relevance prediction performance is sufficient for smooth user experience in tasks such as automatic moment highlighting, information filtering (retrieving information only for a relevant subset of objects), and natural eye movementbased clicking. Finally, in this study, the inferences were based on partly heuristically chosen features computed from the eye movements. A psychophysics experiment to optimize the feature set could be valuable. We believe that the big promise in using specific eyeglasses for information access comes from the prospect of being able to use fully natural and hence convenient eye movements. If the user will need to give the commands explicitly, carrying a smart phone and using its see-through camera for information access is a strong competitor (see Layar 2 and Wikitude 3 as widely known examples of pervasive augmented reality information access applications). The results in this paper are promising but more work is needed; at the current state, we would not recommend automatic “clicking” to be inferred from natural eye movements, but eye movements do already give a fair amount of relevance feedback which can be used implicitly in proactive interfaces.
time thresholding is not shown in the figure since it always predicts zero relevance for delays shorter than 12 seconds. The curve of our model is always above random guessing, although the improvement is marginal for very short delays. Note that the user’s interest affects her eye movement patterns even at very early stages of the dwell session. This outcome encourages further research on using natural eye movement patterns for proactive interaction in future systems, as an alternative to giving explicit commands by eyes. We present the precision-recall curves for long delays in Figure 7 for completeness. Our model outperforms both dwell-time thresholding and random guessing more clearly as the delay gets larger. Computational efficiency of our model is adequate for online use. Off-line training of the classifier on 47 dwell sessions (corresponding to 7 minutes of eye movement data) takes approximately 16 seconds, and prediction of the click for one dwell session takes 0.25 seconds on a computer with a 2.66 GHz processor and 4 GB of main memory.
5.
DISCUSSION
We made a feasibility study on building proactive user interfaces for pervasive user setups based on natural eye movements. We chose a specific use case where the user explores the paintings in an art gallery, accompanied with a wearable computer. In an off-line or manual mode, the system collects data for learning to predict relevances; these data were collected by asking the test subjects to visit the paintings and click a button while looking at the paintings that they find interesting. Using the collected data, we built a machine learning model that predicted clicks on test data with accuracy higher than that of baselines including dwell-time thresholding. The learned predictor can then be used in an on-line or automatic mode, without the button clicks. Eye movement patterns depend heavily on the user task [36]. Hence, generalization of our early findings to other use cases and other types of real-world objects needs to be studied later. One interesting use case would be a meeting where the real-world objects are human faces and the task of the system is to bookmark the important moments of the meeting. We expect that our outcome will generalize to other domains to a large extent, since our features are not tailored to the current domain. As another direction of future research, a comprehensive user study could be carried
6. ACKNOWLEDGMENTS The authors belong to the Finnish Center of Excellence in Computational Inference Research (COIN). SK also belongs to PASCAL2 EU network of excellence. This study was funded by Aalto University MIDE programme. We thank Veli-Matti Saarinen and Lotta Hirvenkari for their help in conducting the experiments, and Arto Klami for his very useful discussion.
7. REFERENCES [1] A. Ajanki, M. Billinghurst, H. Gamper, T. Järvenpää, M. Kandemir, S. Kaski, M. Koskela, M. Kurimo, J. Laaksonen, K. Puolamäki, T. Ruokolainen, and T. Tossavainen. An augmented reality interface to contextual information. Virtual Reality, 15(2):1–13, 2010. [2] M. Baldauf, P. Fröhlich, and S. Hutter. Kibitzer: a wearable system for eye-gaze-based mobile urban exploration. In 2 3
90
http://www.layar.com http://www.wikitude.org
1
0.8
0.8 Precision
Precision
1
0.6 0.4 0.2
0
0.2
0.4
0.6 Recall
0.4 0.2
Our Model (D=4) Random 0.8
0
1
1
1
0.8
0.8 Precision
Precision
0
0.6
0.6 0.4 0.2 0
0.2
0.4
0.6 Recall
0
0.8
0.4
0.6 Recall
0.8
1
0.8
1
0.4
0
1
0.2
0.6
0.2
Our Model (D=6) Random 0
Our Model (D=5) Random
Our Model (D=7) Random 0
0.2
0.4
0.6 Recall
Figure 6: Retrieval performance of our model is better than random guessing for short delays. Precision-recall curves of our model (in blue circles), and random guessing by class ratio (in red squares) are given for four to seven seconds of delay (D).
[3] [4]
[5] [6]
[7]
[8]
[9]
[10]
[11]
[12] R. J. K. Jacob. The use of eye movements in human-computer interaction techniques: what you look at is what you get. ACM Transactions on Information Systems, 9(2):152–169, 1991. [13] M. A. Just and P. A. Carpenter. Eye fixations and cognitive processes. Cognitive Psychology, 8:441–480, 1976. [14] M. Kandemir, V.-M. Saarinen, and S. Kaski. Inferring object relevance from gaze in dynamic scenes. In Proceedings of ACM Symposium on Eye Tracking Research & Applications (ETRA), Austin, TX, USA, pages 105–108, New York, NY, 2010. ACM. [15] L. Kozma, A. Klami, and S. Kaski. GaZIR: Gaze-based zooming interface for image retrieval. In Proceedings of the International Conference on Multimodal Interfaces (ICMI), pages 305–312, New York, NY, USA, 2009. ACM. [16] M. Kumar and T. Winograd. Gaze-enhanced scrolling techniques. In Proceedings of the Symposium on User Interface Software and Technology (UIST), pages 213–216, New York, NY, USA, 2007. ACM. [17] J.-Y. Lee, H.-M. Park, S.-H. Lee, T.-E. Kim, and J.-S. Choi. Design and implementation of an augmented reality system using gaze interaction. In Proceedings of the International Conference on Information Science and Applications (ICISA), pages 1 –8. IEEE, 2011. [18] S. Nilsson, T. Gustafsson, and P. Carleberg. Hands free interaction with virtual information in a real environment. In Proceedings of The Conference on Communications by Gaze Interaction (COGAIN), pages 53–57, 2007. [19] K. O’Hara, M. Tuffield, and N. Shadbolt. Lifelogging: Privacy and empowerment with memories for life. Identity in the Information Society, 1:155–172, 2008. [20] O. Oyekoya and F. Stentiford. Perceptual image retrieval
Proceedings of the Augmented Human International Conference (AH), pages 9:1–9:5, New York, NY, USA, 2010. ACM. R. A. Bolt. Gaze-orchestrated dynamic windows. SIGGRAPH Computer Graphics, 15(3):109–119, 1981. C.-C. Chang and C.-J. Lin. LIBSVM: a library for support vector machines, 2001. Software available at http://www.csie.ntu.edu.tw/~cjlin/libsvm. A. T. Duchowski. Eye Tracking Methodology: Theory and Practice. Springer-Verlag Inc., New York, NY, USA, 2007. S. Feiner, B. MacIntyre, T. Höllerer, and A. Webster. A touring machine: Prototyping 3D mobile augmented reality systems for exploring the urban environment. Personal and Ubiquitous Computing, 1(4):208–217, 1997. D. Hardoon, J. Shawe-Taylor, A. Ajanki, K. Puolamäki, and S. Kaski. Information retrieval by inferring implicit queries from eye movements. In Proceedings of the International Conference on Artificial Intelligence and Statistics (AISTATS ’07), 2007. E. H. Hess and J. M. Polt. Pupil size in relation to mental activity during simple problem-solving. Science, 143(3611):1190–1192, 1964. A. Huckauf and M. H. Urbina. Object selection in gaze controlled systems: What you don’t look at is what you get. ACM Transactions on Applied Perception, 8(13):1–14, 2011. A. Hyrskykari, P. Majaranta, and K.-J. Räihä. Proactive response to eye movements. In Proceedings of INTERACT IFIP Conference on Human-Computer Interaction, pages 129–136. IOS Press, 2003. Y. Ishiguro, A. Mujibiya, T. Miyaki, and J. Rekimoto. Aided eyes: eye activity sensing for daily life. In Proceedings of the Augmented Human International Conference (AH), pages 1–7, New York, NY, USA, 2010. ACM.
91
1
0.8
0.8 Precision
Precision
1
0.6 0.4 Random Dwell−Time Our Model (D=12)
0.2
0
0.2
0.4
0.6 Recall
0.4
0.8
0
1
1
1
0.8
0.8
0.6 0.4 Random Dwell−Time Our Model (D=20)
0.2 0
0
0.2
0.4
0.6 Recall
Random Dwell−Time Our Model (D=15)
0.2
Precision
Precision
0
0.6
0
0.6 Recall
0.8
1
0.8
1
0.4
0
1
0.4
0.6
Random Dwell−Time Our Model (D=34)
0.2
0.8
0.2
0
0.2
0.4
0.6 Recall
Figure 7: Retrieval performance of our model is better than the baselines for medium and longer delays (D=12,15,20,34). Precisionrecall curves of our model (in blue circles), dwell-time thresholding (in green triangles), and random guessing by class ratio (in red squares) are given for 12, 15, 20, and 34 seconds of delay (D).
[21]
[22]
[23]
[24]
[25]
[26]
[27]
[28]
using eye movements. International Journal of Computer Mathematics, 84(9):1379–1391, sep 2007. H. M. Park, S. H. Lee, and J. S. Choi. Wearable augmented reality system using gaze interaction. In Proceedings of the International Symposium on Mixed and Augmented Reality (ISMAR), pages 175–176, Washington, DC, USA, 2008. IEEE. P. Qvarfordt and S. Zhai. Conversing with the user based on eye-gaze patterns. In Proceedings of the SIGCHI Conference on Human Factors in Computing Systems (CHI), pages 221–230, New York, NY, USA, 2005. ACM. C. E. Rasmussen and H. Nickisch. GPML: Gaussian processes for machine learning toolbox, 2010. http://mloss.org/software/view/263/. C. E. Rasmussen and C. K. I. Williams. Gaussian Processes for Machine Learning (Adaptive Computation and Machine Learning). MIT Press, 2005. D. Schmalstieg and G. Reitmayr. The world as a user interface: Augmented reality for ubiquitous computing. In Location Based Services and TeleCartography, Lecture Notes in Geoinformation and Cartography, pages 369–391. Springer Berlin Heidelberg, 2007. H. Shimodaira, K. Noma, M. Nakai, and S. Sagayama. Dynamic time-alignment kernel in support vector machine. In Proceedings of the Advances in Neural Information Processing Systems 14 (NIPS), pages 921–928, Cambridge, MA, USA, 2001. MIT Press. T. Starner, S. Mann, B. Rhodes, J. Levine, J. Healey, D. Kirsch, R. W. Picard, and A. Pentland. Augmented reality through wearable computing. Presence: Teleoperators and Virtual Environments, 6(4):452–460, 1997. S. Stellmach and R. Dachselt. Investigating gaze-supported
[29]
[30] [31] [32] [33]
[34]
[35]
[36]
92
multimodal pan and zoom. In Proceedings of the Symposium on Eye Tracking Research and Applications (ETRA), pages 357–360, New York, NY, USA, 2012. ACM. S. Stellmach, L. Nacke, and R. Dachselt. Advanced gaze visualizations for three-dimensional virtual environments. In Proceedings of the Symposium on Eye-Tracking Research & Applications (ETRA), pages 109–112, New York, NY, USA, 2010. ACM. D. Tennenhouse. Proactive computing. Communications of ACM, 43(5):43–50, 2000. V. N. Vapnik. The nature of statistical learning theory. Springer-Verlag New York, Inc., New York, NY, USA, 1995. D. J. Ward and D. J. C. Mackay. Fast Hands-free writing by Gaze Direction. Nature, 418(6900), 2002. C. Ware and H. H. Mikaelian. An evaluation of an eye tracker as a device for computer input. In Proceedings of the SIGCHI/GI Conference on Human Factors in Computing Systems and Graphics Interface (CHI), pages 183–188, New York, NY, USA, 1987. ACM. C. K. I. Williams and D. Barber. Bayesian classification with Gaussian processes. IEEE Transactions on Pattern Analysis and Machine Intelligence, 20:1342–1351, 1998. J. Wobbrock, J. Rubinstein, M. Sawyer, and A. Duchowski. Not typing but writing: Eye-based text entry using letter-like gestures. In Proceedings of The Conference on Communications by Gaze Interaction (COGAIN), pages 61–64, 2007. A. L. Yarbus. Eye Movements and Vision. Vision Science: Photons to Phenomenology, 1967.