Learning to Predict Ad Clicks Based on Boosted Collaborative Filtering Teng-Kai Fan
Chia-Hui Chang
Dept. of Computer Science & Information Engineering National Central University Taoyuan, Taiwan, R.O.C.
[email protected]
Dept. of Computer Science & Information Engineering National Central University Taoyuan, Taiwan, R.O.C.
[email protected]
Abstract— This paper addresses the topic of social advertising, which refers to the allocation of ads based on individual user social information and behaviors. As social network services (e.g., Facebook and Morgenstern) are becoming the main platform for social activities, more than 20% of online advertisements appear on social network sites. The allocation of advertisements based on both individual information and social relationships is becoming ever more important. In this study, we first propose the notion of social filtering and compare it with content-based filtering and collaborative filtering for advertisement allocation in a social network. Second, we apply content-boosted and social-boosted methods to enhance existing collaborating filtering models. Finally, an effective learning-based framework is proposed to combine filtering models to improve social advertising. The experiments are conducted based on datasets collected from a social finance web site called Morgenstern. We performed a series of comparison experiments between filtering approaches. The experimental results indicate that the learning-based framework is able to achieve better performance results than fundamental filtering and boosted filtering mechanisms alone. Keywords: social advertising; machine learning; recommender system; social networks; collaborative filtering
I.
INTRODUCTION
Due to its rapid growth and popularization, social network (SN) services that allow users to interact over the Internet are becoming an increasingly attractive vehicle for major advertisers seeking to optimize campaign reach and for smaller advertisers desiring to reach a highly-targeted audience [24]. Though advertising in TV, radio and newspapers continues to drop, online advertising still shows a steady growth rate due to social networking, as reported by BizReport1 in 2009. Social networks saw a boom in 2009, and marketers are now becoming more comfortable utilizing the social marketplace to start branded conversations, obtain consumer reviews and simply connect with their customers. Moreover, the report from comscore2 indicates that social networking sites now account for one out of every five ads people view online. Since social media sites can deliver high-reach commercial ads to target potential consumers at low costs, it appears that some advertisers are eager to use social networking sites as a new advertising delivery channel. Therefore, most social network service providers (e.g., Facebook, YouTube, and Morgenstern) are interested in how
1 2
http://www.bizreport.com/ http://www.comscore.com/
to employ their social media for advertising, which thus opens new opportunities in social media marketing. This paper addresses the topic of social advertising, which refers to the allocation of advertisements based on social behaviors of and information on individual users. In contrast to widely-studied forms of online advertising, such as sponsor search and contextual advertising [3][9], social advertising considers not only contextual information such as the content of a browsing page and the context of ads but also a user's social relationships. Formally, given a user-ad pair, the goal of social advertising is to decide whether the ad a should be allocated to user u. There are several ways to solve this problem. We can regard social advertising as a content match problem if the user and ad can be properly represented by text descriptions for similarity computation. Alternatively, social advertising can also be understood as a recommendation problem and solved by collaborative filtering techniques if there are no detailed text descriptions available. In fact, social advertising is closely bound up with individual social networks. That is, the information generated from individual social networks can be applied to make decisions on advertising. Although some of these techniques are well known, social advertising still faces some challenges. For example, due to privacy concerns, users tend to provide incorrect (or incomplete) data when they register as members of social services. In addition, the data stored in a profile usually are static and rarely updated regularly. Hence, constructing a representative profile is a fundamental problem for advertising. In addition, general challenges for collaborative filtering include the sparsity and first-rater problems. Meanwhile, because not all social websites provide explicit social relationships (e.g., friend lists) between users, the third challenge involves how to use social behaviors in an online community to deliver personalized ads. Finally, the last challenge is how to effectively combine distinct filtering models to improve recommendation performance. To address these challenges, we first propose three fundamental filtering mechanisms for personalized ad allocation. (1) Content-based filtering considers the content of historically clicked ads as a user's profile p to filter a given ad a through traditional information retrieval functions, i.e., tf*idf and cosine similarity. (2) Collaborative filtering considers the relationships between users to decide how well a given ad a is matched to a specific user u. (3) Social filtering aims to use effective social behaviors for prediction. In addition to these filtering mechanisms, we also explore boosted frameworks that aim to combine content-based filtering and social filtering with collaborative filtering to
solve the sparsity problem. Lastly, four learning-based inference models with feature sets that are generated from fundamental filtering and boosted filtering mechanisms are employed in this paper to improve social advertising. To evaluate our proposed method, we use a real-world collection of ads and user logs from a social finance web site called Morgenstern3. We conduct a series of comparison experiments on the presented filtering approaches. The experimental results indicate that learning-based filtering models are able to achieve better performance results than fundamental filtering and boosted filtering mechanisms alone. The rest of this paper is organized as follows. Section 2 provides an overview of Morgenstern and the data used in this paper. Section 3 introduces the filtering mechanisms. The experimental evaluations are presented in Section 4. Section 5 outlines some related work. Finally, we present our conclusions and directions for future research in Section 6. II. OVERVIEW OF MORGENSTERN Morgenstern, an emerging social finance web site, was established in 2008 and has acquired a growing number of participants. As of Oct. 2009, it has over ten thousand registered users and over one thousand advertisers. The goal of Morgenstern is to create a triple-win commercial platform for advertisers, registered users and the platform provider. An advertiser pays a low cost to purchase valuable advertisements, while the platform provider shares advertising profits with registered members who link the ads on their web space to endorse the product based on its popularity among registered members. Its difference from Google’s Adsense is that users can indeed choose which ads will be put on their web space, which is called self-portrait. As a general public Web 2.0 site, Morgenstern provides a private web space (i.e., self-portrait) associating with web applications that facilitate interactive information-sharing and user-centric design and collaboration. Members can interact with other members by message board or e-mail or share interesting media content (e.g., photos, video, and bookmarks). By browsing other the self-portraits of other users, users can build their own social network by adding others as friends. To obtain the benefits shared by the platform, a member can select three (or fewer) interesting ads each day, after which the ad agency system automatically places them on the user's self-portrait to increase the impressions rate of the ad. Instead of a traditional placement of relevant ads (such as contextual advertising), users of Morgenstern can actively select their own favorite ads to display according to their interests. III.
FRAMEWORK
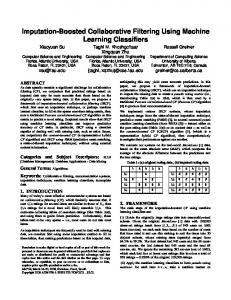
Before we present our proposed filtering mechanisms in detail, we first introduce the data used in the system and the overall prediction structure. As shown in Figure 1, there are three types of data used in this paper, namely, ad descriptions, user ad link matrices and user browsing records, which, in turn, give rise to three fundamental filtering mechanisms. The ad titles and descriptions provide the foundation for 3
http://www.morgenstern.com.tw
content-based filtering. User ad link matrices are used for collaborative filtering. The browsing records are used to build the social networks for social filtering. Next, we introduce boosted methods of collaborative filtering by combining it with content-based filtering and social filtering. Finally, the five scores generated from these filtering models are collected as feature values for the learning models, and then the trained inference models are used to predict whether a given ad a should be assigned to a given user u. Ad description
User-ad link matrix
Users’ browsing records
Content-Based Filtering
Collaborative Filtering
Social Filtering
Content-Boosted Collaborative Filtering
Fundamental models
Boosted models
Social-Boosted Collaborative Filtering
Learning-based Filtering Ad prediction results
Figure 1. System Overview
3.1 Fundamental Filtering Mechanisms Content-based Filtering Content-based filtering (CBF) has two key components. One component is a representative profile for describing the users and the ads; the other component is a measurement mechanism for identifying which profiles are relevant for a given ad. Assume that a user's previously clicked ads can be used to describe a user’s preferences; we can then utilize the content of their historically clicked ads to construct a user profile u p , where an ad consists of a title and a description. In the representation of vector space model (VSM), the given ad a and profile p are represented as weights (tf*idf weighting) in n-dimensional space. Let wi,p be the weight associated with a term ti in profile u p , and let wi,a be the weight associated with term ti in ad a. Then the profile vector u is defined as u p = {w1,p, w2,p,…,wt,p}, and the vector for ad a is defined as a = {w1,a, w2,a,…,wt,a}. The similarity between user profile u and ad a is computed using the cosine similarity function, that is, the cosine of the angle between vectors u p and a : a up Sim (u p , a ) a up
t i 1
t i 1
w
2
wi ,a wi , p
i ,a
t i 1
(1) w
2
i, p
where the weights (e.g., wi,a and wi,p) are obtained from the tf-idf function. CBF uses the similarity between the user profile and the ad to decide whether the given ad a should be assigned to user u. Collaborative Filtering The general collaborative filtering (CF) task is to predict the preference of user u for item a that has not yet rated by user u based on past user ratings. Let C(u,a) denote the ad
click information on user u with respect to ad a, which can be either a Boolean value that denotes whether the ad has been clicked by user or a numerical value that denotes the click-through rate. More specifically, given the past ad click information C(u,a) for all uU and aA, where A = {a1, a2,..., an} denotes the set of all advertisements, collaborative filtering predicts C(u,a) based on the average ad clicks of user u's neighbors v. C(u , a)
1 C(v ,a) | K |vKNN (u )
(2)
Typically, users are represented by their ad click vectors Cu = {C(u, a1), C(u, a2),…, C(u, an)}. The K-nearest neighbors (KNN) are calculated by Euclidean distance between the binary vectors of user u and other users v. Since we focus on the prediction regarding whether the user will link an ad, the entry C(u,a) is assigned a Boolean value in this paper. For ads that are not clicked by users, we adopt the simplest method and fill in all missing values with zeros. Social Filtering As mentioned above, social networks are built from certain specific types of social relationships, such as friendships, common interests and communications. In our case, we employ user browsing behaviors to build social networks. The reason behind this selection is that other social activities, such as message board postings and e-mails, are still limited in this start-up web site, while user self-portraits often attract many browsing activities due to the effects of product endorsement. That is, user selections of ads can be influenced by the information a user browses. Through this construction of social networks, we can identify the Knearest neighbors of a given user u by their browsing frequencies B(u,v) as defined below: (3) B(u , v ) # of visits from u to v Then, the ad click prediction for collaborative filtering can be applied similarly for social filtering (SF). Thus, social filtering differs from collaborative filtering according to how neighbors are selected. 3.2 Boosted Filtering Mechanisms To ease the sparsity and first-rater problems, two boosted filtering mechanisms are proposed in this paper to enhance collaborative filtering. The first boosted model is contentboosted collaborative filtering (CBCF), and the other is social-boosted collaborative filtering (SFCF). The idea behind both is to fill in the missing values in an ad link matrix to avoid zero values in user ad click vectors, as suggested by Melville [15]. We first create a pseudo ad click vector for every user u. The pseudo ad click vector Hu consists of the actual items clicked by user u and the predicted items clicked according to content-based filtering (or social filtering) mechanisms as follows: C ( u ,a ) if user u click ad a H ( u ,a ) Sim ( u ,a ) otherwise
(4)
Note that C(u,a) denotes user u’s actual clicks for item a, while Sim(u,a) is the predicted clicks according to the contentbased filtering (or social filtering) model. The pseudo ad click vectors of all users comprise a new matrix that is much denser than the original user-ad matrix. Collaborative filtering models can use this dense matrix to predict incoming ads for user u. In these boosted methods, the Euclidean measure was again adopted to identify the Knearest neighbors v of u based on the pseudo ad click vectors Hu and Hv instead of the original click vectors Cu and Cv. In addition, the boosted models similarly predict the given ad a based on the average ad clicks of user u's neighbors v. For each C(u,a) generated from the three fundamental filtering and two boosted filtering models, we use a step function based on a predefined threshold τ to decide whether the given ad a should be assigned to user u as follows: 1
if C(u , a )
0
otherwise
(u , a )
(5) The threshold τ is determined based on the historical clicks of user u. We perform a series of preliminary experiments on a given user's historical ad records to find the optimal threshold. 3.3 Learning-based Framework In learning-based filtering models, we regard the ad prediction as a classification problem. Four different inference models, including the support vector machine (SVM), decision tree (DT), Bayesian net (BN) and logistic regression (LR) models, are studied in the experiments. Three fundamental filtering mechanisms (namely, CBF, CF and SF) and two boosted filtering models (that is, CBCF and SFCF) can be regarded as the feature extractors for learningbased models. The feature values correspond to the output of each filtering mechanism. The Boolean class labels are determined according to user ad clicks (i.e., positive for ad clicks and negative for ad non-clicks). Given a user-ad pair , the learned classifier is then used to infer the labels of incoming ads a. IV. EVALUATION In this section, we evaluate the performance of the proposed framework and compare it with individual filtering mechanisms. We begin by describing the dataset and text preprocessing and then proceed to a discussion of the experimental results. 4.1 Data Set and Measurements To evaluate our proposed filtering methods, we collected real-world data from Morgenstern containing ads and user logs from April 2009 to March 2010. We obtained a total of 640 ads and about 10,000 user logs, which mainly record user behaviors, including ad clicking and page browsing. However, not all of the users included in the social site are evaluated; we only selected users who had been registered as members for more than four months and removed users whose numbers of ad clicks were lower than a particular frequency (default = 5). The reduced dataset includes 473,541 ad clicks for 7,166 users. The average ad clicks per
user is approximately 66. We conducted K-fold crossvalidation (K=10) in the following experiments. For each testing user in the validation set, 20% of ads are omitted in order to allow the model to predict them. The proposed filtering methods then are used to predict whether each hidden ad will be clicked by the given user. As individual interests may vary depending on temporal distance, we partitioned user-ad collections into subsets using three temporal durations, namely, long term (LT), midterm (MT) and short term (ST). The temporal subsets are overlapping, that is, MT contains ST, and LT contains both ST and MT. For sufficient detail, we denoted the data from April 2009 to March 2010 as LT. The data from October 2009 to March 2010 and November 2009 to March 2010 are denoted as MT and ST, respectively. In addition, the hidden ad data are distributed from January 2010 to March 2010, for a total of 128 evaluated ads (i.e., 20% of ads). Toolkits Since we addressed ads in Chinese, we tried three widespread Chinese text-preprocessing representations, namely, unigram, bigram, and segmentation, to tokenize the ad description in our preliminary experiments. The results show that using Chinese segmentation to construct user profiles can yield better performance results than the other data representations. In this study, we adopt Yahoo's chunking tools4 to divide ad descriptions into segmentation units according to Chinese semantics. For the learning toolkit, we used Weka 3.75 to conduct experiments with the SVM, decision tree, Bayesian net and logistic regression Models. Measurements To effectively evaluate the proposed filtering models, we adopted the following common measures: Mean Absolute Error (MAE): the average absolute difference between predicted ad clicks and actual ad clicks, where 0 indicates perfect prediction, and 0.5 indicates complete randomness. Area under the ROC (AUC): accuracy is measured by the area under the receiver operating characteristic (ROC) curve. The ROC is an approach for displaying the tradeoff between the true positive rate and false positive rate of a classifier, where 1 indicates perfect prediction, and 0.5 indicates complete randomness. Precision: the proportion of identified ad clicks of the actual ad clicks. Recall: the proportion of ad clicks that are identified out of all actual ad clicks. F1 score: weighted harmonic mean of precision and recall, where ad clicks are represented by a binary value (i.e., 1 for an ad click and 0 for an ad non-click). In our experiments, we evaluated each metric on the test set for each user and then averaged the metric over the set of test users. 4.2 Parameter Selection In fundamental filtering and boosted filtering mechanisms, each approach was used to decide whether the 4 5
http://tw.developer.yahoo.com/cas/ http://www.cs.waikato.ac.nz/ml/weka/
given ad a should be assigned to user u according to a threshold τ. The threshold τ was determined based on the historical clicks of user u. Intuitively, we can adopt the aggregation functions (e.g., maximum, minimum and average) and statistical measurements (e.g., variance and standard deviation σ) with respect to the historical clicked ads to determine τ for each user u. Therefore, for each user during some portion of the training set, 80% of visible ad click data are analyzed by filtering mechanisms to identify the threshold. Furthermore, the remaining visible ad click data were used to evaluate performance. The results indicate that using the average function to define a threshold can yield better performance results than other measurements, as shown in Table 1. Therefore, in the following experiments for fundamental filtering and boosted filtering mechanisms, the average function was used to identify threshold values. TABLE 1.
FILTERING MECHANISMS: MAE OVER DIFFERENT Τ.
Filtering Models CBF Threshold type 0.113 Maximum Average 0.093
CF
SF
0.117 0.085
0.173 0.128
0.107 0.074
0.126 0.105
Average+σ
0.132
0.134
0.166
0.145
0.128
Average-σ
0.162
0.368
0.320
0.392
0.219
Average+2σ
0.139
0.142
0.162
0.153
0.131
CBCF SFCF
With regard to setting parameters for collaborative filtering, we compared the performance results with k equal to 5, 10, 15, 20, 30, 40, 50, and 80 for 10 rounds. The results indicate that k equal to 5 yields the best performance. For social filtering, the performance is best when k is set to 80. The parameter settings for boosted filtering (CBCF and SFCF) are similar. 4.3 Evaluation of Fundamental Filtering and Boosted Filtering Mechanisms The objective of this section is to explore how well the filtering mechanisms performed by implementing the three fundamental filtering mechanisms (i.e., CBF, CF, and SF) and two boosted filtering mechanisms (i.e., CBCF and SFCF) on testing data. Table 2 shows the results for the five filtering approaches, where bolding indicates the best performance results within each temporal duration. As can be seen in this table, CBCF performs better than other filtering mechanisms in the datasets over both long-term and midterm periods. As for the short-term dataset, the SFCF method achieves the best performance results. This result is consistent across two metrics, namely, MAE and AUC. Of the three fundamental filtering mechanisms, CF performs the best, while SF performs the worst. Both SF and CBF can boost performance when combined with CF. In terms of MAE, CBCF yielded 0.062, which is better than SFCF and CF with values of 0.074 and 0.076, respectively, for the long-term dataset. For the short-term dataset, SFCF (0.060) outperforms the other methods, with CBCF yielding 0.073, CF yielding 0.081, CBF yielding 0.088 and SF yielding 0.145. We further used the experimental results to explore whether the boosted filtering mechanisms can perform better than more fundamental approaches. That is, we compared
CBCF with CBF and CF and compared SFCF with SF and CF. The differences in performance between these approaches were evaluated using two a-sided test. For the MAE metric, both boosted approaches can yield better or at least similar performance results as compared to the fundamental approaches across the three temporal datasets. The differences in MAE are statistically significant (p < 0.01), except for that between SFCF and CF for the midterm dataset. According to these results, it seems reasonable to infer that using boosted filtering algorithms for prediction is more appropriate than using fundamental mechanisms. TABLE 2. Filtering Models CBF CF SF CBCF SFCF
FILTERING MECHANISMS RESULTS. (BOLD = BEST PERFORMING, * = P < 0.01 )
Long term (LT) MAE AUC 0.078 0.617 0.076 0.734 0.165 0.589
Midterm(MT) MAE AUC 0.089 0.683 0.082 0.758 0.185 0.583
Short term(ST) MAE AUC 0.088 0.747 0.081 0.712 0.145 0.570
0.062* 0.074
0.081* 0.082
0.073* 0.060*
0.796 0.60
0.765 0.583
0.750 0.798
4.4 Evaluation of Learning-Based Filtering Models Next, we conducted experiments to compare learningbased filtering mechanisms (i.e., the SVM, decision tree (DT), Bayesian net (BN) and logistic regression (LR) models) using features generated from fundamental filtering and boosted filtering mechanisms. For each test user, the learning-based model again uses visible ad click data (i.e., 80% of ads) to train the classifier and 20% of ads for predicting. Table 3 shows four sets of learning-based filtering models results, where the bold indicates the best performance results within the distinct temporal durations. As can be seen from the table, the logistic regression model performs best among other learning algorithms in terms of the MAE and AUC metrics across the three temporal datasets. The best performance results can be achieved using logistic regression with respect to MAE (0.022), and AUC (0.969) in the short-term dataset. To compare learning-based filtering models with boosted filtering mechanisms, we also conduct statistical significance tests to evaluate the differences between each learning model and boosted approach using two-side tests. As can be seen in Table 3, most learning-based filtering models can achieve better performance results than boosted filtering mechanisms. TABLE 3.
LEARNING-BASED FILTERING MODELS RESULTS (BOLD = BEST PERFORMANCE RESULTS). LEARNING MODELS WITH A SIGNIFICANT DIFFERENCE FROM BEST-PERFORMING FILTERING MECHANISMS IN TABLE 2 ARE MARKED (* = P < .05, ** = P < .01) Learning models SVM BN DT LR
Long term MAE AUC 0.055** 0.815 0.061* 0.946 0.056** 0.838 0.044** 0.957
Midterm MAE AUC 0.079** 0.788 0.097 0.926 0.085 0.829 0.068** 0.945
Short term MAE AUC 0.028** 0.889 0.037** 0.952 0.027** 0.779 0.022** 0.969
To compare multiple classifiers, we follow the procedure proposed by Demsar [7]. First, we use the Friedman test [10], which is a non-parametric equivalent of the repeatedmeasure ANOVA, to test the null- hypothesis that all
classifiers perform the same such that observed differences are merely random. The null hypothesis is rejected, and we therefore proceed with the two-tailed Nemenyi [16] post-hoc test to compare classifiers with each other. The performance of two classifiers is significantly different if the corresponding average ranks differ by at least the critical difference (CD), which can be calculated by CD q
k (k 1) 6N
(6)
Note that k is the number of classifiers to be compared, N6 is the number of datasets, and q is based on the Studentized range statistic divided by 2 . The results of the comparisons are shown in Figure 2. The groups of classifiers that are not significantly different are connected. According to Figure 2, we can infer that the model generated by logistic regression performs significantly better than that generated by the SVM and decision tree methods in terms of MAE in our datasets, while the models generated by the logistic regression and Bayesian net methods are not significantly different. The models generated by the SVM and decision tree methods are also not significantly different. C ritical D ifference 5
4
SV M D ecision T ree
3
2
1
0 L ogistic R egression B ayesian N et
Figure 2. Comparison of all classifiers against each other with using the Nemenyi test. Group of classifiers that are not significantly different (at p = 0.05) are connected.
Further Analysis for Feature Combinations In order to explore the effectiveness of features within the learning algorithm, five basic features and their total of seven combinations were evaluated. The feature combinations were chosen according to our preliminary experimental results. Ten-fold cross-validation was again conducted in this experiment. For each learning algorithm, we used each feature or feature combination to train a classifier, and the learned model was then used for prediction. Due to space limitations, we only present MAE performance for the long-term dataset. As shown in Figure 3, no matter what kinds of learning algorithms were adopted, the results based on CF features are consistently superior to the results based on CBF and SF features alone. However, the combination of CF with CBF and SF does offer a positive effect. In addition, learning algorithms with the combination of all basic features (i.e., CBF combined with CF, SF, CBCF and SFCF) can for the most part achieve the best performance results. Similarly, we use multiple comparisons to evaluate the performance of distinct feature sets. The null hypothesis (i.e., that the given learning algorithm performs the same for all various feature sets such that observed differences are merely 6 The value N is 30 since we conduct 10 fold cross validation for LT, MT and ST respectively.
random) was rejected after the Friedman test. Next, we compared the pairwise difference between various feature sets with the two-tailed Bonferrni-Dunn test [8], which is a method used to address the problem of multiple comparisons and calculate the critical difference using the same equation as for the Nemeny test. The critical difference (CD) for posthoc tests after the Friedman test is 3.342. Due to space limitations, only the logistic regression algorithm was adopted for statistical tests. The pairwise comparisons of all feature sets using the Bonferrni-Dunn test are shown in Figure 4. The groups of feature sets that are not significantly different are connected. As can be seen in Figure 4, we conclude that using the combination of all basic features performs significantly better than using each basic feature alone. However, the results are not sufficient to determine whether CBF feature performs the same as CF or SF or whether CF feature is equivalent to the combination of CBF and SF features or to CBCF feature alone. Meanwhile, as MAE results are averaged across the three temporal datasets, we see that even though SFCF performs best in the shortterm dataset (Table 2), the effect is not significantly different from CF or CBF or combined feature sets, such as CBCF and SFCF. SVM
0.120
BN
DT
LR
0.100
MAE
0.080
.095
0.060 0.040
.083 .072
.069
.08
.074
.072 .056
.056
0.020
.055 .055 .054
0.000 CB
F
CF
SF
CB
CF
F F F CF CF SF CF FC FC +S F+ SF F+ CB +S +S CF F+ CB SF+ + SF CF CB F+ C B + CB CB CF F+C CF F+ F+ B +S B F C C C F+ CB
C SF
F
Figure 3. MAE performance results for various feature sets in the longterm dataset. The values under the curve show the average MAE values for four classifiers. Critical Difference 12 SF SFCF CBF CBCF+SFCF CBF+SF CF
10
8
6
4
2
0 CBF+CF+SF+CBCF+SFCF CBF+CF+SF+CBCF CBF+CF+SF+SFCF CBF+CF+SF CBF+CF CBCF
Figure 4. Comparison of MAE for various feature combinations using the Bonferroni-Dunn test. Group of feature sets that are not significantly different (at p = 0.05) are connected.
4.5 Other Explorations In this paper, we regard the prediction of ad clicks as a binary label classification problem. However, the majority of users do not click on many items, and hence, the user ad click matrix is very sparse, resulting in imbalanced data. For a given user, if all items were predicted as a negative class (i.e., the users did not click on the given ad), the mean average of error is about 0.1. This naive method performs even significantly better than some fundamental filtering mechanisms. However, positive predictions (i.e., that the
user actually clicks on the given ad) are more of concern than negative predictions. Therefore, in addition to the MAE metric, precision and recall values are also used to present the performance results for positive predictions, as shown in Table 4. Here, the learning models included all basic features for predicting. As can be seen in Table 4, the learning-based filtering models can outperform fundamental filtering and boosted filtering mechanisms. The results clearly show that the best precision (0.914), recall (0.873), and F-score (0.882) performance results are produced using the logistic regression algorithm on the short-term dataset. In terms of averages, the learning models yield an average precision value of 0.78, an average recall value of 0.71 and an average F-score of 0.73. Therefore, we can infer that the features that we extracted can not only address the data imbalance issue but also achieve better performance results for positive predictions. Furthermore, as can be seen from Figure 2, the SVM algorithm was ranked in the last position among four learning algorithms. However, Table 4 below illustrates that the SVM method used on long-term and midterm datasets can obtain the best precision values of 0.866 and 0.829, respectively. Although the experimental results from Figure 2 and Table 4 are contradictory, the findings with respect to the SVM method are very useful for ad prediction. Some prior studies [9][20] have suggested that strong relevance increases the number of clicks and that advertisements that are presented to users who are not interested can result in customer annoyance. Hence, learning models with high precision are essential for maintaining customers. TABLE 4. Filtering Methods SVM BN DT LR CBCF SFCF CBF CF SF
POSITIVE PERFORMANCE RESULTS FOR EACH FILTERING METHOD (BOLD = BEST PERFORMING)
Long-Term Pre. Rec. F1 0.866 0.653 0.703 0.768 0.777 0.751 0.696 0.681 0.669 0.854 0.793 0.806 0.828 0.537 0.652 0.609 0.442 0.512 0.749 0.451 0.563 0.802 0.421 0.552 0.341 0.252 0.279
Middle Term Pre. Rec. F1 0.829 0.619 0.671 0.688 0.774 0.705 0.666 0.683 0.656 0.808 0.754 0.764 0.776 0.450 0.570 0.586 0.453 0.511 0.694 0.443 0.541 0.799 0.414 0.545 0.308 0.303 0.350
Short Term Pre. Rec. F1 0.911 0.788 0.821 0.794 0.836 0.799 0.573 0.559 0.556 0.914 0.873 0.882 0.684 0.501 0.578 0.652 0.551 0.597 0.654 0.446 0.530 0.684 0.463 0.552 0.324 0.378 0.349
4.6 Discussion and Observations Ad Recommendations for New Members In this study, we did not consider how to bootstrap the construction of a user profile when a new user joins the web site. Here we propose two possible ways to address this issue. Generally, the social site service providers usually require a new user unew to enter personal information (e.g., address, city, sex, education, and other basic information) and interests (e.g., music, movies, reading, and other leisure pursuits) to build his/her profile when he/she register as a member of the service. We can directly utilize a user’s interests to recommend ads based on CBF. Another possible approach is to apply a clustering method with personal basic information and then build pseudo ad clicks for the new user unew from the click records of unew’s group. With these
pseudo ad clicks, we can then apply CF to choose the top-knearest users for prediction. Temporal Series Observations In terms of how much data we must collect for prediction, we observe that the short-term dataset yields the best performance results across all experiments. We show the aggregate MAE performance over fundamental, boosted, and learning-based mechanisms. As shown in Table 5, the average performance of each filtering model type in the short-term dataset can provide better performance results than that of long-term and midterm datasets. This finding is consistent with other studies [23]. That is, user interests should be relevant to the latest behaviors of users. Therefore, according to this finding, it seems reasonable to infer that any filtering model can achieve moderate performance results and save computing costs by only looking at shortterm data. TABLE 5.
AGGREGATE MAE FROM THE FILTERING METHODS. (BOLD = BEST PERFORMING)
Filtering models Learning-based Boosted Fundamental
V.
Long term 0.054 0.068 0.106
Midterm 0.082 0.081 0.118
Short term 0.028 0.066 0.104
RELATED WORK
Several prior research studies are relevant to our work, including efforts in the personalized search and social community. 5.1 Personalized search and User Interests Many personalized advertising methods are proposed that make use of explicit user profiles, which are gathered, maintained, and analyzed by the ad placing system. Such methods often make use of data-mining techniques [11]. Many web portals create user profiles using information gained during the registration process. However, due to privacy considerations, users tend to give incorrect data. In addition to user profiles, an alternative solution is to exploit information stored in the web server logs [2]. Several studies in advertising research have stressed the importance of relevant associations for consumers and how irrelevant ads can turn off users and relevant ads are more likely to be clicked [5]. They show that advertisements that are presented to users who are not interested can result in customer annoyance. Thus, to be effective, the authors conclude that advertisements should be relevant to a consumer’s interests at the time of exposure. As a result, certain studies have tried to determine how to take advantage of the available evidence to enhance the relevance of selected ads. For example, studies on keyword matching show that the nature and number of keywords affect the likelihood of an ad being clicked [6]. Several studies have also examined query log and clickthrough analysis for web search personalization [1]. Qiu & Cho [19] combine a topic-sensitive version of PageRank with a history of user clicks data for personalizing search results. Tan et al. [22] propose a language modeling approach for query mining. Their results indicate significant
improvement of personalized web search with a historybased language model than general search. Luxenburger et al. [14] introduce a statistical language model for user tasks representing different granularity levels of a user profile, ranging from very specific search goals to broad topics. Their framework selectively matches the actual user information need with relevant past user tasks and allows to dynamically switch the course of personalization from refinding very precise information to biasing results toward general user interest. Their proposed model is able to detect when the user's search and browse history is not appropriate for aiding the user in satisfying her current information quest. White et al. [23] predict user interests using contextual information. They use several variant sources (i.e., social, historic, task, collection and user interaction) of contextual information for user interest modeling. The results demonstrate that context overlap outperforms any isolated source. 5.2 Social Community and Advertising Several research studies investigate users' social relations and behaviors for personalization [17]. Carmel et al. [4] study the effectiveness of three social network types for personalization, namely familiarity-based, similarity-based and Overall. The results show that all three models have significant levels of performance compared to the Topicbased social network. Singla & Richardson [21] apply data techniques to study the relationship between social networks and personal behavior. The analysis reveals that people who chat with each other are more likely to share interests. In addition, the more time they spend talking, the stronger this relationship is. Behavioral Targeting, proposed by Yan et al. [24], is a technique used by online advertisers to increase the effectiveness of their campaigns. They utilize users' clickthrough log of advertisements and the similarities between users to draw two conclusions. One is that users who clicked the same ad will truly have similar behaviors on the Web. Another is that using short term user behaviors to represent users is more effective than using long term user behaviors for advertising. Provost et al. [18] propose some brand proximity measures (e.g., cosine similarity and Euclidean distance) to select audience for on-line brand advertising. The results reveal that audiences with high brand proximity indeed show substantially higher brand affinity. Konstas et al. [12] propose a track recommendation which takes into account both the social annotation and friendships inherent in the social graph established among users. They compare the collaborative recommendation system and the generic framework of Random Walk with Restarts. The results indicate that the graph model outperforms the standard collaborative filtering method. As for contextual advertising, some prior studies have suggested that strong relevance increases the number of click-through [13] [20]. In recent years many researchers have not only considered the extent of content relevance between pages and ads but also further investigated the importance of personal interests mining, including intention and sentiment analysis for improved contextual advertising [9]. The major difference between
prior studies and ours is that we proposed a learning-based framework which combines distinct filtering models to improve social advertising. VI.
CONCLUSION
In this study, we proposed and evaluated learning-based filtering mechanisms for allocating personalized ads on a social finance site called Morgenstern. To investigate whether personal interests change with time series, we divided the training dataset into different temporal intervals. The experimental dataset contained about 640 ads and about 10,000 members. The feature sets and feature values for the proposed learning-based filtering mechanisms are mainly from fundamental filtering and boosted filtering mechanisms. For fundamental filtering, we evaluated three basic filtering approaches, namely, content-based filtering (CBF), collaborative filtering (CF) and social filtering (SF). For boosted filtering, we evaluated two boosted models, namely, content-boosted collaborative filtering (CBCF) and socialboosted collaborative filtering (SFCF). Our results show that boosted filtering models can outperform fundamental filtering approaches. The best performance may be as low as 0.06 in terms of mean average error (MAE). For learning-based filtering, we compared four learning algorithms, namely, the SVM, Bayesian net, decision tree, and logistic regression methods. The results indicate that most learning-based filtering models can achieve better performance results than fundamental filtering and boosted filtering mechanisms. The best performance result based on learning-based approaches was the MAE value of 0.022. We applied statistical tests to conclude that using a logistic regression algorithm can obtain the best performance among the other learning models on our datasets. To investigate the contribution of each feature, we performed a series of experiments to compare the learning models across distinct feature sets. Our results show that learning models that combine all basic features perform significantly better than learning models with each basic feature alone. Last, we concluded that the latest user behaviors are most relevant to user preferences. There are several directions still left to be explored. First, term expansion and relevance feedback can be used to enhance content-based performance. The current results are not significant, since advertisements are concise in nature and thus lead to very little intersection between ads and profiles. Second, we plan to identify more social behaviors (and social interactions) and combine them with existing filtering models to enhance performance. Moreover, we intend to conduct a more comprehensive analysis of our model. To address large datasets, we may also apply topic analysis to user logs and ads to improve personal ad prediction. ACKNOWLEDGMENT The authors would like to thank the anonymous reviewers for helpful comments on this study. The work was supported in part by the National Science Council of Taiwan (NSC98-2221-E-008-089).
REFERENCE [1] [2] [3] [4]
[5] [6]
[7] [8] [9] [10] [11] [12] [13] [14] [15] [16] [17]
[18] [19] [20] [21] [22] [23] [24]
E. Agichtein, E. Brill, S. Dumais, and R. Ragno, "Learning user interaction models for predicting web search result preferences," in Proceedings of the 29th SIGIR, 2006, pp. 3-10. S. M. Bae, S. C. Park, and S. H. Ha, "Fuzzy Web ad selector based on Web usage mining," Intelligent Systems, IEEE, vol. 18, pp. 62-69, 2003. A. Broder, M. Fontoura, V. Josifovski, and L. Riedel, "A semantic approach to contextual advertising," in Proceedings of the 30th SIGIR, 2007, pp. 559-566. D. Carmel, N. Zwerdling, I. Guy, S. Ofek-Koifman, N. Har'el, I. Ronen, E. Uziel, S. Yogev, and S. Chernov, "Personalized Social Search Based on the User's Social Network," in Proceeding of the 18th CIKM, 2009, pp. 1227-1236. P. Chatterjee, D. L. Hoffman, and T. P. Novak, "Modeling the Clickstream: Implications for Web-Based Advertising Efforts," Marketing Science, vol. 22, pp. 520-541, 2003. ChoiceSteam, "ChoiceStream personalization survey: consumer trends and perceptions, http://www.choicestream.com/pdf/ChoiceStream_PersonalizationSur veyResults2005.pdf," 2005. J. Demsar, "Statistical Comparisons of Classifiers over Multiple Data Sets," Machine Learning Research, vol. 7, pp. 1-30, 2006. O. J. Dunn, "Multiple Comparisons Among Means," American Statistical Association, vol. 56, pp. 52-64, 1961. T.-K. Fan and C.-H. Chang, "Sentiment-Oriented Contextual Advertising," Knowledge and Information Systems (KAIS), 2009. M. Friedman, "The Use of Ranks to Avoid the Assumption of Normality Implicit in the Analysis of Variance " Journal of the American Statistical Association, vol. 32, pp. 675-701, 1937. P. Kazienko and M. Adamski, "AdROSA-Adaptive personalization of web advertising," Information Sciences, vol. 177, pp. 2269-2295, 2007. I. Konstas, V. Stathopoulos, and J. M. Jose, "On Social Networks and Collaborative Recommendation," in Proceedings of the 32nd SIGIR, 2009, pp. 195-202. A. Lacerda, M. Cristo, M. A. Gonçalves, W. g. Fan, N. Ziviani, and B. Ribeiro-Neto, "Learning to advertise," in Proceedings of the 29th SIGIR, 2006, pp. 549-556. J. Luxenburger, S. Elbassuoni, and G. Weikum, "Matching Task Profiles and User Needs in Personalized Web Search," in Proceeding of the 17th CIKM, 2008, pp. 689-698. P. Melville, R. J. Mooney, and R. Nagarajan, "Content-boosted collaborative filtering for improved recommendations," in Eighteenth national conference on Artificial intelligence, 2002, pp. 187-192. P. B. Nemenyi, "Distribution-free multiple comparisons." vol. PhD: Princeton University, 1963. P. Panzarasa, T. Opsahl, and K. M. Carley, "Patterns and dynamics of users' behavior and interaction: Network analysis of an online community," Journal of the American Society for Information Science and Technology, vol. 60, pp. 911-932, 2009. F. Provost, B. Dalessandro, and R. Hook, "Audience Selection for On-line Brand Advertising: Privacy-friendly Social Network Targeting," in Proceedings of the 15th KDD, 2009, pp. 707-716. F. Qiu and J. Cho, "Automatic identification of user interest for personalized search," in Proceedings of the 15th WWW, 2006, pp. 727-736.. B. Ribeiro-Neto, M. Cristo, P. B. Golgher, and E. S. d. Moura, "Impedance coupling in content-targeted advertising," in Proceedings of the 28th SIGIR, 2005, pp. 496-5034. P. Singla and M. Richardson, "Yes, There is a Correlation-From Social Networks to Personal Behavior on the Web," in Proceedings of the 17th WWW, 2008, pp. 655 - 664. B. Tan, X. Shen, and C. Zhai, "Mining long-term search history to improve search accuracy," in Proceedings of the 12th SIGKDD, 2006, pp. 718-7209. R. W. White, P. Bailey, and L. Chen, "Predicting User Interests from Contextual Information," in Proceedings of the 32nd SIGIR, 2009, pp. 363-370. J. Yan, N. Liu, G. Wang, W. Zhang, Y. Jiang, and Z. Chen, "How much can Behavioral Targeting Help Online Advertising?," in 18th WWW, 2009, pp. 261-270