781
Life history trade-offs and community dynamics of small fishes in a seasonally pulsed wetland1 Donald L. DeAngelis, Joel C. Trexler, and William F. Loftus
Abstract: We used a one-dimensional, spatially explicit model to simulate the community of small fishes in the freshwater wetlands of southern Florida, USA. The seasonality of rainfall in these wetlands causes annual fluctuations in the amount of flooded area. We modeled fish populations that differed from each other only in efficiency of resource utilization and dispersal ability. The simulations showed that these trade-offs, along with the spatial and temporal variability of the environment, allow coexistence of several species competing exploitatively for a common resource type. This mechanism, while sharing some characteristics with other mechanisms proposed for coexistence of competing species, is novel in detail. Simulated fish densities resembled patterns observed in Everglades empirical data. Cells with hydroperiods less than 6 months accumulated negligible fish biomass. One unique model result was that, when multiple species coexisted, it was possible for one of the coexisting species to have both lower local resource utilization efficiency and lower dispersal ability than one of the other species. This counterintuitive result is a consequence of stronger effects of other competitors on the superior species. Résumé : Nous avons utilisé un modèle unidimensionnel spatialement explicite pour simuler la communauté des petits poissons dans des terres humides d’eau douce du sud de la Floride, É.-U. La variation saisonnière des précipitations dans ces terres humides produit des fluctuations annuelles de la surface inondée. Nous avons modélisé des populations de poissons qui diffèrent entre elles seulement par l’efficacité de leur utilisation des ressources et par leur pouvoir de dispersion. Les simulations montrent que ces compromis, alliés à la variabilité temporelle et spatiale de l’environnement, permettent la coexistence de plusieurs espèces qui sont en compétition d’exploitation pour le même type de ressources. Ce mécanisme est inusité dans son détail, bien qu’il partage quelques caractéristiques avec d’autres mécanismes proposés pour expliquer la coexistence d’espèces compétitrices. Les densités de poissons dans les simulations ressemblent aux patrons de densité observés dans les données empiriques provenant des Everglades. Les cellules dont l’hydropériode dure moins de six mois accumulent des quantités négligeables de biomasse de poissons. Un résultat exceptionnel de la modélisation est que, lors de la coexistence de plusieurs espèces, il est possible pour l’une des espèces en présence de posséder à la fois une efficacité d’utilisation des ressources locales et un pouvoir de dispersion plus bas que ceux d’une autre des espèces. Ce résultat à première vue illogique est la conséquence des effets plus importants d’autres compétiteurs sur les espèces de niveau supérieur. [Traduit par la Rédaction]
DeAngelis et al.
790
Introduction Fishes are the most abundant vertebrates in the Everglades and Big Cypress wetland ecosystems of southern Florida. Small-bodied species, composed particularly of about 10 species of livebearers (poeciliids) and killifishes (cyprinodontids and rivulids) having similar life cycles and resource use, dominate the community by numbers. They constitute an ecosystem component whose biomass is the major energy resource for higher trophic levels, especially wintering and
breeding wading birds (Ogden 1994; Crozier and Gawlik 2003). Systematic, human-induced changes in hydrology over the last several decades have altered hydroperiods in most wetland areas, thereby diminishing this fish forage base or changing the pattern of its availability. Lack of sufficient biomass and availability of prey is hypothesized to have been a major factor in the decline of wading bird nesting at traditional Everglades’ rookeries (Ogden 1994). Recovery of historic fish patterns is a primary goal for restoration of southern Florida wetlands (Ogden et al. 2003).
Received 31 January 2004. Accepted 23 October 2004. Published on the NRC Research Press Web site at http://cjfas.nrc.ca on 6 May 2005. J17988 D.L. DeAngelis.2 US Geological Survey, Florida Integrated Science Center, Department of Biology and Biological Resources Division USGS, University of Miami, P.O. Box 249118, Coral Gables, FL 33124, USA. J.C. Trexler. Department of Biological Sciences, Florida International University, Miami, FL 33199, USA. W.F. Loftus. US Geological Survey, Florida Integrated Science Center, Everglades National Park Field Station, Homestead, FL 33043, USA. 1
This article was part of a special symposium entitled Building on Beverton’s legacy: life history variation and fisheries management, which took place on 11–14 August 2003 in Québec, Quebec, during the 133rd annual meeting of the American Fisheries Society. 2 Corresponding author (e-mail:
[email protected]). Can. J. Fish. Aquat. Sci. 62: 781–790 (2005)
doi: 10.1139/F05-050
© 2005 NRC Canada
782
The strongly seasonal rainfall pattern of this region creates a cycle of wet and dry seasons. Because of the flat landscape, relatively small differences in mean water level amplify into large differences in the amount of wetted area and flooding duration, which affect many plant and animal communities. The wetland small-fish community is strongly influenced by seasonal hydrologic fluctuations (Loftus and Kushlan 1987; Trexler et al. 2002). The coexistence of many fish species of similar small body size and resource use begs for an explanation (Strange and Foin 1999). Our operating hypothesis is that fluctuations in available habitat, along with trade-offs in life history traits, play key roles in maintaining this community. As vast areas of wetland are reflooded each year, opportunistic fish species can disperse into and exploit those areas first, while other species appear to be better at dominating more permanently inundated areas of marsh. Species better at exploiting more stable areas should have higher reproductive and (or) survival rates in long-hydroperiod areas, and they should be slower to disperse.
Materials and methods We hypothesize that maintenance of a diverse wetland fish community can be related to current ecological theory on nonequilibrium communities. Environmental fluctuations are often proposed as a means for maintaining richness in a dynamic community by preventing competitively dominant species from eliminating others. Chesson (2000) reviewed the mathematical models showing that environmental fluctuations could promote diversity in nonequilibrium communities, when the fluctuations effectively provide distinct niches for the competing species. These circumstances may occur when the competing species have trade-offs in key physiological and (or) behavioral traits that allow the relative advantages to alternate among species in a fluctuating environment. One type of nonequilibrium model is that of Litchman and Klausmeier (2001). That model was based on trade-offs in coexisting species, phytoplankton species in their case, competing under seasonally periodic light availability. One species (opportunist) was able to grow faster under initially high levels of light, but when phytoplankton biomass increased to the point that self-shading occurred, the advantage shifted to the other species (gleaner). Both species declined during the period of the year when external solar radiation was low. For certain ratios of light to dark period, coexistence was possible. The opportunist–gleaner species trade-off is a useful idea, although in the Everglades fish community, spatial movement probably plays a role, as in “successional mosaic” models (Armstrong 1976; Tilman 1994; Holmes and Wilson 1998). In that hypothesis, disturbances occur asynchronously across the landscape, creating new habitats ready to be recolonized. If some members of the regional species pool have traits that allow invasion of newly available gaps where they increase rapidly, while others invade slowly but are better competitors and eventually displace the pioneers, species diversity can be maintained. Areas within this dynamic landscape offer a range of successional stages at a given time, allowing niches for many different life history traits. Other models of this class assume that all patches are continuously occupied by all the species, but dif-
Can. J. Fish. Aquat. Sci. Vol. 62, 2005
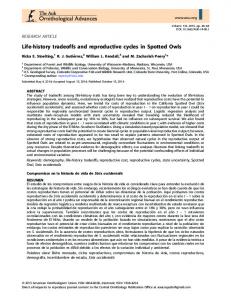
ferences in dispersal rates, along with differences in resource growth rates on different patches, can maintain more than one species on a given resource (Abrams and Wilson 2004; Namba and Hashimoto 2004). Our conceptual model for the South Florida wetland fish community contains the primary elements, resource fluctuations and spatial dispersal, of the above nonequilibrium hypotheses. However, the mechanism that we propose differs slightly from each of those. As in the successional mosaic hypothesis, fish species populations move at different rates into newly opened (flooded) habitat, with the more competitive species moving more slowly than the more opportunistic ones. But this recolonization process does not occur in randomly and asynchronously opened habitat patches, as in gap creation in forest systems, but as large annual pulses during the seasonal flooding period. In addition, during the dry season, the recession of water forces all populations together into permanent or semipermanent waterbodies. The gradual opening of new habitat by the rising water gives the more effectively dispersing fish species a temporary advantage during which they can build in numbers before being subjected to competition by the other invaders. When the waters recede, the opportunistic fish are subjected again to heavy competition, but if they have built up high enough numbers, the species may persist. This mechanism can be demonstrated mathematically for very simple cases. Consider two competing fish species, Species 1 and 2, that can occupy two spatial areas, Regions 1 and 2, one of which (Region 1) is continually flooded, while Region 2 floods seasonally for several months. The two fish species differ as follows. Species 1 has greater resource use efficiency and hence can outcompete Species 2 when both are present in either region but is a less efficient disperser, so only a small proportion of the Species 1 population invades Region 2 during the time that it is flooded. A large fraction of Species 2 invades Region 2 when it is flooded. It is essential also to assume that both species have carrying capacities in each region. It can be shown mathematically that the two species can coexist over a range of parameter values. Here, we will only show one numerical simulation of a simple differential equation model of Species 1 and Species 2, which inhabit Region 1 continuously and alternately disperse into and out of Region 2 as it floods and dries out. An example of the trajectories of the two species in the two regions is shown (Fig. 1, details given in the legend). As a result of its numerical head start in the seasonally flooded area, the poorer competitor is able to build to high enough numbers to persist, despite being outcompeted in both the permanently flooded region and the seasonally flooded region. It is possible to extend the mathematical model to describe the coexistence of more fish species. Instead, we chose the alternative of using a more detailed simulation model to support our hypothesis. This allows inclusion in the model of aspects of the wetland fish community, such as age and size structure, that are important for the results to be believable. Simulation model development We developed a spatial model of a community of age- and size-structured fish species. This model, ODFISH (onedimensional fish model), simulates a fish community along a © 2005 NRC Canada
DeAngelis et al. Fig. 1. Plots of the biomasses of the hypothetical Species 1 and 2 from a two-species, two-region Lotka–Volterra competition model, where Region 1 is continuously flooded and Region 2 is flooded for part of the year. In both regions, the intrinsic growth rates for the two species are r1 = 0.208·day–1 and r2 = 0.204·day–1, while the coefficients of competition and selfregulation are c11 = c22 = c12 = c21 = 0.2·day–1. One half of the population of Species 2, but only 0.05 of the population of Species 1, move to Region 2 on day 110 (start of flooding of Region 2) and one half of both populations survive on day 240 (end of flooding of Region 2) to move back to Region 1. No further movement takes place between the regions besides those days. Biomass of Species 1 is represented by the thick solid line (Region 1) and thick broken line (Region 2). Species 2 is represented by the thin solid line (Region 1) and thin broken line (Region 2).
one-dimensional elevation gradient by modeling the fish community dynamics in a sequence of spatial cells along the gradient. As elevation increases along the gradient, the hydroperiods of individual spatial cells decrease. The model has two trophic levels, fish and a single common food resource. We applied ODFISH to small fishes representative of the Everglades. Our first objective was to determine the reasonableness of the model in simulating the dynamical patterns in space of a single fish population. The second objective was to determine if the mechanism involving trade-offs between traits for resource use efficiency and dispersal is plausible for explaining maintenance of coexistence of species utilizing a common resource. The model ODFISH is based on an earlier model developed for the small-fish community of southern Florida, the single-spatial cell fish fodel (DeAngelis et al. 1997). The single-cell fish model describes the dynamics of the functional group of small freshwater fish in an area uniform in elevation. ODFISH extends this model to several competing species of small fishes in a one-dimensional series of cells along an elevation gradient. One simplification of the singlecell model is ignoring refugia (e.g., alligator ponds) within spatial cells, which are present in the original unit cell model, in order on a smaller number of mechanisms for coexistence. ODFISH is a simulation model, not an analytic
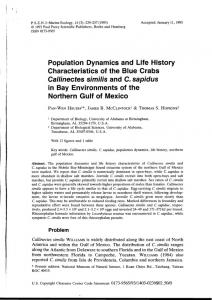
783 Fig. 2. Description of the physical characteristics modeled. (a) Elevation and resultant hydroperiod of each cell along the onedimensional transect. (b) Seasonal pattern of water depths of 16 of the total of 32 spatial cells (the others are spaced between these lines). The extreme upper and lower curves correspond to the continually flooded and continually dry cells, Cells 1 and 32, respectively. The hydroperiods of the other cells lie in between these.
model. It is designed to approximate the sort of dynamics that should occur in a population of small fishes in an expanding and contracting floodplain in more detail than an analytic model can achieve. Details such as population age and size structure make explanation of results more difficult than in simple analytic models. But the mechanism of coexistence described in the preceding section (Fig. 1) is explicitly present in ODFISH. That is, ODFISH incorporates the trade-off between local competition and dispersal. Physical environment ODFISH simulates an elevation gradient by a onedimensional array of 32 cells, starting from Cell 1, which was always flooded, to Cell 32, which was always dry for the range of water levels simulated. The elevation of cells increases linearly from Cell 1 to Cell 32 (Fig. 2a). Each cell is 250 m × 250 m, internally homogeneous, and characterized by a mean elevation. This size is small enough to provide good spatial resolution, as there is only about a 6-cm difference in elevation between adjacent cells but large enough that each cell can contain a sizable population of small fishes. The water depth (water level relative to the cell elevation) of the spatial cells is simulated by a sinusoidal function within each year (Fig. 2b). Water levels change on daily time steps. This results in a truncated sinusoidal change in water depth for each cell, with the period of flooding decreasing with the elevation of the cell. © 2005 NRC Canada
784
Can. J. Fish. Aquat. Sci. Vol. 62, 2005 Table 1. Main parameter values of ODFISH (one-dimensional fish model). Length of spatial cell Lower trophic level productivity Turnover rate of lower trophic level biomass von Bertalanffy growth coefficients
Assimilation coefficient Length–weight coefficients Survival coefficients
Food resources The food resources, R, for the fish in each cell are described by a differential equation similar to the resource dynamics of a chemostat: dR = input − mR − loss to fish dt where input is a constant rate of productivity, mR represents losses not related to consumption by fish, and loss to fish corresponds to removal of resource by fish that is translated into fish population biomass growth. Lower trophic level productivity and turnover rates were parameterized to resemble typical values in southern Florida wetlands (values in Table 1). Fish life cycles The fish species represented in ODFISH are small omnivorous fishes that include, for example, eastern mosquitofish (Gambusia holbrooki), flagfish (Jordanella floridae), and other cyprinodontiform fishes common in the Everglades and Big Cypress Swamp (Loftus and Kushlan 1987). We simulated growth and mortality in age-classes on 1-day time steps, but reproduction only occurred on 10-day steps. At age s, the size of the fish (length L) was given by a von Bertalanffy equation: L S = L ∞ [1 − e– K ( s − s 0 ) ] Weight (W) in grams dry weight is given by the weight– length relationship W = α1 Lα 2 where L∞ , K, s0, α1, and α 2 are constants. The values of these fish growth parameters used in the model, simplified for making theoretic comparisons, are presented (Table 1). We assumed that all fishes that survive through a given time step grow at the growth rate specified by the von Bertalanffy equation above. We assumed that when the food available to the fishes during a particular time step fell below maintenance levels, this translated directly into mortality rather than stunting growth (DeAngelis et al. 1997). Mature fish produce a number of viable offspring, denoted by “repr” per reproductive bout. We assigned age of maturity, fecundity, and months during the year in which each functional group reproduced based on empirical data. The model embodies three types of mortality assumptions (Ta-
Input m L∞ K s0 a α1 α2 Fb Fp Fa
250 m 0.8 g dry weight·m–2·day–1 0.5·day–1 4.5 cm 0.015·day–1 6.0 days 0.5 0.00128 3.02 0.04 g dry weight·m–2 0.05·day–1 0.004·day–1
Table 2. The two survival functions used in ODFISH (onedimensional fish model). Density-dependent survival Size-dependent survival
ddsurviv = 1/(1 + Fb /R) sdsurviv = 1.0 – Fp /(1 + Fas)2
Note: R is available food (g·m–2·day–1), and s is age (10-day age-classes).
ble 2). (i) Density-independent background mortality, i.e., the natural mortality of an uncrowded population, of each fish size-class. (ii) Density-dependent mortality from starvation. This was calculated by first computing the density of resources. As the ratio of total fish biomass to total resource amount increases, the mortality rate applied to fish increases. This mortality is applied equally across species and ageclasses. (iii) Loss from drying of the cell. When a cell dries, we assumed that some fraction of fish was able to move to an adjacent flooded cell (see Movement section below). The remainder stays in refugia (e.g., alligator ponds) but suffer mortality at a high rate from crowding, oxygen depletion, and predation. Movement The environmental driving variable for movement is the water depth (Trexler et al. 2002). When water depth in a cell falls to zero, a fraction of the fish, “disp”, moves to an adjacent cell that is still flooded. The rest are subjected to rapid mortality. When a cell refloods, a fraction of fish, assumed here to be the same disp, moves from the adjacent lower elevation cell. Fish move only when their current cell dries out or an adjacent cell refloods. Simulation runs Simulations were performed for small Everglades fishes to show the plausibility of the assumed trade-offs for permitting coexistence of species. Three general types of simulations were performed using ODFISH. The first were simulations of a single species with different sets of life history traits to test whether the model projected reasonable spatiotemporal fish density patterns and to determine the effect of each trait on the dynamics of the population. The second type of simulation consisted of two species competing for the same resource to determine the degree of differences in the traits among species necessary for coexistence. The third simulations were of several species competing for the same resource to determine whether the proposed mechanism of © 2005 NRC Canada
DeAngelis et al.
trade-offs in the two traits permitted multispecies coexistence for reasonable parameter ranges. Simulations of individual species populations We assumed that the species within the fish community differed along two trait axes, each being a trait that affected the ability of the fish species to survive in the environment: (i) efficiency of resource exploitation, reflected in a different population growth rates (five different reproductive rates), and (ii) colonization of reflooded areas (six rates of dispersal). Our simulations examined the spatiotemporal dynamics of single-species populations for the sets of assumed values of these parameters. We defined a dispersal coefficient, disp, to represent the fraction of fish able to move from one cell to the adjacent flooded cell when the initial cell dried and that were able to move in the other direction to a newly flooded cell. The following values were used: disp = 0.10, 0.15, 0.20, 0.30, 0.40, and 0.50. In all cases, we assumed that female fish attained sexual maturity at 30 days and that a mature female had a reproductive bout every 10 days. The number of successful offspring produced per fish per bout, reflecting resource use efficiency, was set at repr = 4, 5, 6, 7, and 8 (precise estimates of fecundity are difficult to obtain, but these values are consistent with fertility data of Breder and Rosen (1966) and Fuller and Travis (2001)). All possible combinations of disp and repr were studied. Each simulation was run for at least 3650 days (10 years). For each run, we seeded the elevational gradient with an initial population of fish. Several hundred days were allowed for the initial transient dynamics to play out before results were recorded. Simulations of two competing species We simulated pairs of species, each drawn from a set of life histories characterized by fecundity and dispersal rates, such that there were trade-offs in these traits. The species with the greater resource use efficiency was slower than the other in dispersing into new areas. The existence of such trade-offs in capabilities is considered an essential factor in explaining the coexistence of species using similar resources (e.g., Roff 1992; Stearns 1992; Rosenzweig 1995). We provided two competing species with different fecundities (repr): Species 1, repr1 = 5.4, and Species 2, repr2 = 5.3. The dispersal rate of Species 1 was disp1 = 0.02, whereas that of Species 2, disp2, was allowed to vary. We performed simulations >50 000 days to determine when coexistence or extinction of one species occurred. Simulations of a community of competing species We performed simulations for five different fish species competing simultaneously to see which combinations of life history traits were able to coexist. Strict trade-offs were not assumed in these simulations. As in the two-species case, only the traits of offspring number and dispersal rate were permitted to vary. Simulations were run >50 000 days.
Results Simulations of individual fish species populations After several hundred days in a particular simulation, the initial transients died out and the dynamics of the population settled into a regular pattern of seasonal variation. Several
785 Fig. 3. Illustration of the temporal patterns of biomass of a single species in selected cells over a period of 500 days after all transients have disappeared (solid line, Cell 3; long-dashed line, Cell 4; dot-dashed line, Cell 7; dot-dot-dashed line, Cell 9; short-dashed line, Cell 11; representing longer to shorter hydroperiods). Note the biomass peaks as the cells upstream dry and fish move down-gradient.
features of the seasonal biomass trajectories of fish varied in response to hydroperiod (Fig. 3) First, mean biomass in spatial cells with longer hydroperiods was higher, and fish in cells with the longest hydroperiod may have approached the carrying capacity of those cells. Second, biomass in any given cell rose gradually, ending in a sharp peak, followed by a drop at least as sharp and then a slower, but still rapid decline. This was followed by a brief sharp rise,and then, again, a gradual rise in biomass. The gradual rise occurred after reflooding when the population reestablished. The peak occurred when the cell immediately upstream dried, resulting in an influx of fish dispersing from that cell. When a given cell dried, a sharp decline occurred in the population because of emigration to the adjacent downstream cell. The remaining fish in that cell were assumed to die. After a dry period, the cell flooded again and there was a pulse of immigrants from the adjacent downstream cell. Then the population grew steadily again. Both traits had strong effects on the spatiotemporal population dynamics. To compare the impact of different assumptions of dispersal and fecundity, we plotted the biomasses attained by the late wet season (just prior to immigration influx from the drying upstream cell) in each cell during the year. The results (below) provided profiles of the maximum biomasses attained within the 32 cells along the elevation gradient. Dispersal rate We set the fractions of fish able to disperse from drying to wet cells to disp = 0.10, 0.15, 0.20, 0.30, 0.40, and 0.50 (with the other parameter value repr = 6). Below Cell 8, the fish were able to attain close to their carrying capacities for all levels of drydown survival. Above Cell 17, fish could barely attain a fraction of their carrying capacity even for a very high survival rate (Fig. 4). This suggests that there is a lower limit on hydroperiod, below which the buildup of appreciable biomass is difficult. Low dispersal rates did not limit maximum biomass in cells with long hydroperiods, and © 2005 NRC Canada
786 Fig. 4. Profiles of maximum biomass along the elevational gradient for a single species with the dispersal rate disp = 0.10 (shaded line), 0.15 (short-dashed line), 0.20 (dot-dot-dashed line), 0.30 (dot-dashed line), 0.40 (long-dashed line), and 0.50 (solid line). Fecundity is the same in each case, repr = 6.
high dispersal rates did not lead to accumulation of appreciable biomass in the cells with hydroperiods below about 6 months. Reproduction For fish reaching maturity at 30 days with reproductive bouts every 10 days, we set numbers of successful offspring produced per bout, repr = 4, 5, 6, 7, and 8 (with the other parameter value disp = 0.20) (Fig. 5). Once again, this range of values had little influence on fish biomass in cells with hydroperiods shorter than about 6 months. However, low numbers of offspring (four or five) affected the accumulation of biomass in all cells because low reproductive rates shifted the steady-state values of fish biomass toward lower levels. A strong implication of each comparison of spatial profiles of maximum biomass is that cells with hydroperiods less than 6 months are unlikely to build up appreciable fish biomass, even for species with life histories predisposed to increase biomass. An alternative explanation is that shorthydroperiod, high-elevation cells are so far from refuges (continuously flooded cells acting as sources of fish) that they cannot sustain high fish biomass (i.e., they act as population sinks). We tested this alternative hypothesis by making Cell 10 into a permanent waterbody, thereby moving a continuous source of fish closer to the high-elevation cells. The results did not change when the second experiment, that of varying dispersal rates, was repeated. Cells with hydroperiods less than 6 months still failed to accumulate fish biomass, reflecting the lack of time for an invading population to go through more than a few generations. This result could change for species with much higher intrinsic growth rates. Simulations of two competing species We provided the two competing species with different fecundities per fish per bout (repr): Species 1, repr1 = 5.4, and Species 2, repr2 = 5.3. Species 1 had dispersal rate disp1 = 0.02, while that of Species 2, disp2, was allowed to vary. Species 2 reached extinction for disp2 = 0.05, 0.08, 0.10, and 0.11. Coexistence occurred for disp2 = 0.12, 0.15,
Can. J. Fish. Aquat. Sci. Vol. 62, 2005 Fig. 5. Profiles of maximum biomass along the elevational gradient for a single species with the fecundity rate, repr = 4 (shortdashed line), 5 (dot-dot-dashed line), 6 (dot-dashed line), 7 (long-dashed line), and 8 (solid line). Dispersal is the same in each case, disp = 0.20.
0.20, and 0.30. Thus, a species with lower fecundity must have a dispersal rate that exceeds some threshold relative to the dispersal rate of the other species to coexist. We also simulated pairs of species with one fish species superior to the other in both fecundity and dispersal ability. The superior species displaced the other in all cases. Simulations of a community of competing species We simulated simultaneously five species with various combinations of fecundity and dispersal rate (the choice of five was arbitrary — it may be possible for additional fish species to coexist). In general, coexistence required that differences in repr among the species be proportionally smaller than the differences in the trade-off trait disp, that is, small relative differences in repr have a large effect. Given these conditions, many combinations of values produced coexisting communities. Here, we show the results of one such multispecies assemblage to demonstrate that communities of at least five species can coexist indefinitely in competition for a single resource type, where the resource type is produced independently in spatial cells along an elevation gradient and where fish have both different resource consumption efficiencies and different dispersal rates. The temporal dynamics of biomass of each of the five species populations in a particular cell undergo continual 2-year cycling (see Fig. 6 for a 2000-day period starting at a point 50 years into the simulation). Population dynamics differed among spatial cells. For example, Species 3 shows 2-year cycles in biomass density in the cells (3, 4, 7, 9, and 11), with the maximum biomass declining along the elevation gradient (Fig. 7 shows an 800day period). (These cells were chosen arbitrarily for display. The other cells follow similar patterns.) Note that sharp increases occurred when drying of the adjacent upstream cell forced fish to move into a cell. The fish in a particular cell disappeared soon after it dried down, but the cell was recolonized from the adjacent downstream cell when it reflooded. © 2005 NRC Canada
DeAngelis et al.
787
Fig. 6. Illustration of the temporal patterns of biomass of five fish species in Cell 3 over a 2000-day period starting 50 years into the simulation. The parameter values for Species 1–5, respectively, are repr = 5.32, 5.33, 5.23, 5.1, and 4.9 and disp = 0.02, 0.25, 0.35, 0.45, and 0.55. Solid line, Species 1; longdashed line, Species 2; dot-dashed line, Species 3; dot-dotdashed line, Species 4; short-dashed line, Species 5. Note that the biomass peaks as the cells upstream dry and fish move down-gradient.
Fig. 8. Biomasses of five coexisting species’ populations along the entire elevational gradient on a day late in the wet season. Solid line, Species 1; long-dashed line, Species 2; dot-dashed line, Species 3; dot-dot-dashed line, Species 4; short-dashed line, Species 5. The parameter values for Species 1–5, respectively, are repr = 5.32, 5.33, 5.23, 5.1, and 4.9 and disp = 0.02, 0.25, 0.35, 0.45, and 0.55.
Fig. 7. Dynamics of one of the five species in competitive coexistence (Species 3) in five different cells (3, 4, 7, 9, and 11) over an 800-day period (solid line, Cell 3; long-dashed line, Cell 4; dot-dashed line, Cell 7; dot-dot-dashed line, Cell 9; shortdashed line, Cell 11). Note that sharp increases occurred when drying of the adjacent upstream cell forced fishes to move into the cell. The parameter values for Species 1–5, respectively, are repr = 5.32, 5.33, 5.23, 5.1, and 4.9 and disp = 0.02, 0.25, 0.35, 0.45, and 0.55.
highest fecundity (Species 1). Nonetheless, Species 1 was able to coexist.
The biomass of all of the species populations along the entire elevation gradient can be compared in the model on any day. It is interesting to compare biomasses of five species late in the wet season, when they build to their highest levels. The distribution of biomass for five species across all cells late in the wet season shows Species 3, 4, and 5 excluded from the two lowest elevation cells and Species 1 and 2 skewed towards those cells (Fig. 8). A noteworthy result in the simulation is that the fish reaching the highest biomass in Cells 1 and 2 (Species 2) had the highest fecundity (by about 2%) and was a better disperser than that with second
Discussion Comparisons of data from field studies with models A primary goal of studies of South Florida fish communities has been to understand their role in transferring biomass to higher trophic levels. These studies are also producing information relevant to the general community theory embodied in the model of southern Florida wetland fishes described here. All common small-bodied fishes inhabiting the South Florida wetlands have relatively short generation times of only a few months. The South Florida fishes cannot be easily classified into life history categories such as the gleaners and opportunists. Flagfish, marsh killifish (Fundulus confluentus), and eastern mosquitofish are closest to matching the characteristics of opportunists, but we know little about the relative contributions of local drydown survival and longdistance migration in explaining their quick recolonization after a drydown. Further, we have only limited information on the competitive hierarchy of these species, although mosquitofish are commonly considered aggressive and superior competitors. There is some evidence that resources are limiting at the densities experienced by mosquitofish in longhydroperiod habitats and that size-structured interspecific competition takes place (Taylor et al. 2001). The densities observed in short-hydroperiod habitats may be low enough to relax resource limitation. Consistent with this current lack of information on South Florida fishes, we did not try to specifically model the gleaners and opportunists of current ecological theory (e.g., see Litchman and Klausmeier 2001) but merely examined trade-offs in dispersal ability versus greater competitive ability (greater reproductive rate). © 2005 NRC Canada
788
One area in which the results from ODFISH corroborated empirical results was their strong indication that there is a hydroperiod threshold below which fish apparently cannot build up in biomass. Field data demonstrate that densities of fishes are lowest in the short-hydroperiod wetlands and increase with lengthening flooding periods (Trexler et al. 2002). In the model, hydroperiods below about 6 months simply did not provide the opportunity for enough generations of fish to produce a significant population, even when the traits were pushed to high levels within their regions of feasibility. The age structure incorporated in the model is partly responsible for this result, which shows the importance of incorporating this aspect of realism. Empirical data also reveal a spectrum of life history traits in fishes (Fig. 9) that support the model projections. For example, following a drydown event at a long-hydroperiod site, three fish species commonly appear soon after the marsh is reflooded. These are the flagfish, marsh killifish, and the eastern mosquitofish. Of these three species, eastern mosquitofish is particularly well known for rapid colonization ability (Brown 1985; Congdon 1994; Baber et al. 2002) and displays no relationship between its density and time since last drydown (Fig. 9). As the time since drydown increases, other species come to dominate the small-fish community, primarily least killifish (Heterandria formosa) and bluefin killifish (Lucania goodei). The eastern mosquitofish persists at relatively high density as the community is increased with new colonizers. In very short-hydroperiod wetlands, which are subject to intra- and interannual drying, eastern mosquitofish and flagfish colonize the area immediately upon reflooding and dominate the community during the wet season. Although small numbers of other species, such as the killifishes, slowly move into these habitats, they cannot build their numbers before the next drying event. ODFISH reflects the general features of community expansion into reflooded areas and contraction during the drying period. Some fish disperse more quickly into the newly flooded areas, while others that invade later may come to dominate the community if there is sufficient time. In addition, temporal biomass peaks of the type shown in this study are evident in field data. The detailed spatiotemporal patterns of occupation by the small-fish community and the relationships of these patterns to life history parameters are just beginning to be studied, however, and cannot yet be used to test ODFISH in detail. The model results will serve to guide future observations. Implications and limits of model The results of the ODFISH model confirmed that the general traits of high reproduction and dispersal are important for fishes to persist in the widely varying environments found in southern Florida wetlands. To survive under the conditions imposed by the model, fish species needed high reproduction rates (this does not imply that only highly fecund species will survive in South Florida; our model did not include permanent waterbodies that could support large fishes with competitive advantages other than simply high reproduction). The ability to disperse rapidly enabled fishes with lower reproductive rates to take advantage of newly reflooded areas, where competition for the food supply was low.
Can. J. Fish. Aquat. Sci. Vol. 62, 2005 Fig. 9. Illustration of three patterns of recovery following drying events by fishes inhabiting a long-hydroperiod site in the Everglades. log-transformed density is plotted against days since the study site last dried. (a) Bluefin killifish (Lucania goodei); (b) eastern mosquitofish (Gambushia holbrooki); (c) flagfish (Jordanella floridae).
It is difficult to compare these two traits precisely with those in the theoretical literature. Both high fecundity and rapid dispersal are generally considered to be opportunistic traits and so do not form a gleaner–opportunist trade-off axis. Instead, these might be thought of as two types of opportunistic species. In any case, the simulation model corroborated the results of the simple analytic model that tradeoffs in these traits can lead to coexistence. In general, our model is consistent with results of other types of nonequilibrium models of coexistence discussed earlier. But it was unexpected to find in some five-species simulations that a species with lower values of both traits than another species could persist. This seemed to contradict our two-species simulations, which always showed that when one species had both lower resource use efficiency and © 2005 NRC Canada
DeAngelis et al.
lower dispersal rate than another, it was always excluded. We confirmed that if Species 3, 4, and 5 were removed from the five-species simulation, Species 1 went to extinction. We also extended the simulation time to demonstrate rigorously that the five-species coexistence shown here is real. One possible explanation for the persistence of Species 1 in the five-species case is that the competition of Species 3, 4, and 5 affected Species 2 more strongly than Species 1, as there is more spatial overlap between Species 1 and these other species than between Species 2 and the latter. Although we have not seen this sort of result in the literature on species coexistence in fluctuating environments, it may not be too surprising. Nonlinear, multispecies systems have complex competitive feedbacks that may offset slight inequalities in life cycle fitness in some cases. Thus, the conditions of this model seem to permit exceptions to the general notion that trade-offs in life history traits are required for coexistence (e.g., Roff 1992; Stearns 1992; Rosenzweig 1995). It is interesting to note that empirical data seem to indicate that one Everglades species, the eastern mosquitofish, may be superior to many other species in both of these traits, which does not affect the coexistence of those species in the ecosystem. Like all models, ODFISH is a compromise between the inclusion of enough mechanistic detail that we believe is important and the simplicity that is essential in interpreting the results. It is useful to briefly review the main simplifications of the model that could affect results. (i) Space is modeled as one-dimensional with a linear gradient (divided into 250m cells). (ii) The seasonal fluctuations are sinusoidal with no interannual variations. (iii) All fish species followed the same von Bertalanffy growth pattern and had identical energetics and ages of first reproduction. They differed only in the two traits studied. (iv) There are implicit assumptions in the model concerning how fast fish move from one spatial cell to the next. (v) We did not include refugia (e.g., alligator ponds) within cells, which could allow some fish to survive in a cell after water depth dropped below zero in the cell. (vi) Predators on the fishes were not considered. They may be an important limitation on fish densities in the longhydroperiod marshes. These simplifications are necessary for the model to be useful in exploring theoretical questions. However, they limit the applicability of the model to studying management issues in detail. What the model does show is that a wide spectrum of hydroperiods is probably one of the underlying reasons for the diversity of the fish community in the Everglades wetland. The model also reinforces empirical indications that areas with hydroperiods of less than about 6 months do not produce large amounts of fish biomass. To answer the highly specific management questions required for South Florida restoration, larger models (e.g., Gaff et al. 2000), which can utilize detailed hydrology models of the landscape of southern Florida, must be used. ODFISH can, nevertheless, be extended in the future to provide some general answers to certain critical questions. For example, how do large piscivorous fishes, which may move into the wetlands when water depths are deep enough, affect the small-fish community? How does the presence of large aquatic refuges like canals or river channels affect the large fish – small fish dynamic, and how far into the wetlands is the effect felt? Are there particular life history char-
789
acteristics that render a potential invasive species especially onerous? These features can be addressed in the present model. A lingering question for managers is how high densities of fishes develop and are made available to predators in the wetlands. In the past, large colonies of wading birds occurred in certain years at certain places in the Everglades, presumably owing to high concentrations of fish prey (Frederick and Ogden 2001). Those concentrations were likely related to aspects of hydrology, such as water recession rate and local pooling of water based on topography. Recession rate affects shorter term processes like fish mortality through stranding or in refuges and their availability to predators. But other processes, including plant and animal succession, predator–prey relationships, and nutrient processes, all of which depend on hydroperiod, may also be involved. Extensions of the model may be needed in these directions. ODFISH has revealed other questions that need to be addressed empirically. These include how fast fishes can follow the wetted front. Are their movement rates the same both under recession and flooding? What are the rates of fish survival in local refuges during drydown, and do those fishes play a significant role in colonizing reflooded areas? What features should invaders have to successfully become established in the community? These and other questions will guide collaborative field and modeling research in the future.
Acknowledgments D.L.D. and W.F.L. were supported in significant part by funding from the Critical Ecosystems Studies Initiative of the US Department of Interior and in part by the US Geological Survey Florida Integrated Science Centers. J.C.T. was supported both by National Science Foundation (NSF) grant 99-10514 for Florida Coastal Everglades Long-Term Ecological Research (FCE-LTER) and by a cooperative agreement between Florida International University and the Everglades National Park (H52810200C1) and Florida International University and the US Geological Survey (Nos. 02ERAG0040 and 1445-CA09-0112, subagreement No. 12). We thank Peter Abrams, Yetta Jager, and an anonymous reviewer for their many useful comments.
References Abrams, P.A., and Wilson, W.G. 2004. Coexistence of competitors in metacommunities due to spatial variation in resource growth rates; Does R* predict the outcome of competition? Ecol. Lett. 7: 929–940. Armstrong, R.M. 1976. Fugitive species: experiments with fungi and some theoretical considerations. Ecology, 57: 953–963. Baber, M.J., Childers, D.L., Babbitt, K.J., and Anderson, D.H. 2002. Controls on fish distribution and abundance in temporary wetlands. Can. J. Fish. Aquat. Sci. 59: 1441–1450. Breder, C.M., Jr., and Rosen, D.E. 1966. Modes of reproduction in fishes. T.F.H. Publications, Neptune City, New York. Brown, K.L. 1985. Demographic and genetic characteristics of dispersal in the mosquitofish, Gambusia affinis (Pisces: Poeciliidae). Copeia, 1985: 597–612. Chesson, P. 2000. Mechanisms of maintenance of species diversity. Annu. Rev. Ecol. Syst. 31: 343–366. Congdon, B.C. 1994. Characteristics of dispersal in the eastern mosquitofish Gambusia holbrooki. J. Fish Biol. 45: 943–952. © 2005 NRC Canada
790 Crozier, G.E., and Gawlik, D.E. 2003. Wading bird nesting effort as an index to wetland ecosystem integrity. Waterbirds, 26: 303–324. DeAngelis, D.L., Loftus, W.F., Trexler, J.C., and Ulanowicz, R.E. 1997. Modeling fish dynamics and effects of stress in a hydrologically pulsed ecosystem. J. Aquat. Ecosyst. Stress Recov. 6: 1– 13. Frederick, P.C., and Ogden, J.C. 2001. Pulsed breeding of longlegged wading birds and the importance of infrequent severe drought conditions in the Florida Everglades. Wetlands, 21: 484–491. Fuller, R.C., and Travis, J. 2001. A test for male parental care in a fundilid, the bluefin killifish (Lucania goodei). Environ. Biol. Fishes, 61: 419–426. Gaff, H., DeAngelis, D.L., Gross, L.J., Salinas, R., and Shorrosh, M. 2000. A dynamic landscape model for fish in the Everglades and its application to restoration. Ecol. Model. 127: 33–52. Holmes, E.E., and Wilson, H.B. 1998. Running from trouble: longdistance dispersal and the competitive coexistence of inferior species. Am. Nat. 151: 578–586. Litchman, E., and Klausmeier, C.A. 2001. Competition of phytoplankton under fluctuating light. Am. Nat. 157: 170–187 Loftus, W.F., and Kushlan, J.A. 1987. Freshwater fishes of southern Florida. Bull. Fla. State Mus. Biol. Sci. 31: 147–344. Namba, T., and Hashimoto, C. 2004. Dispersal-mediated coexistence of competing predators. Theor. Popul. Biol. 66: 53–70. Ogden, J.C. 1994. A comparison of wading bird nesting colony dynamics (1931–1946 and 1974–1989) as an indication of ecosystem conditions in the southern Everglades. In Everglades: the system and its restoration. Edited by S.M. Davis and J.C. Ogden. St. Lucie Press, Delray Beach, Fla. pp. 533–570.
Can. J. Fish. Aquat. Sci. Vol. 62, 2005 Ogden, J.C., Davis, S.M., and Brandt, L.A. 2003. Science strategy for a regional ecosystem monitoring and assessment program: the Florida Everglades example. In Monitoring ecoregional initiatives: interdisciplinary approaches for determining status and trends of ecosystems. Edited by D. Busch and J.C. Trexler. Island Press, Washington, D.C. pp. 135–163. Roff, D.A. 1992. The evolution of life histories. Chapman and Hall, New York. Rosenzweig, M.L. 1995. Species diversity in space and time. Cambridge University Press, Cambridge, UK. Stearns, S.C. 1992. The evolution of life histories. Oxford University Press, Oxford, UK. Strange, E.M., and Foin, T.C. 1999. Interaction of physical and biological processes in the assembly rules of stream fish communities. In Ecological assembly rules. Perspectives, advances, retreats. Edited by E. Weiher and P. Keddy. Cambridge University Press, Cambridge, UK. Taylor, R.C., Trexler, J.C., and Loftus, W.F. 2001. Separating the effects of intra- and interspecific age-structured interactions in an experimental fish assemblage. Oecologia, 127: 143–152. Tilman, D. 1994. Competition and biodiversity in spatially structured habitats. Ecology, 75: 2–16. Trexler, J.C., Loftus, W.F., Jordan, F., Chick, J.H., Kandl, K.L., McElroy, T.C., and Bass, O.L., Jr. 2002. Ecological scale and its implications for freshwater fishes in the Florida Everglades. In The Everglades, Florida Bay, and coral reefs of the Florida Keys: an ecosystem sourcebook. Edited by J.W. Porter and K.G. Porter. CRC Press, Boca Raton, Fla. pp. 153–181.
© 2005 NRC Canada