1\fy>wom.\-£i-cp
PROCEEDINGS OF SPIE SPIE—The International Society for Optical Engineering
Light-Emitting Diodes: Research, Manufacturing, and Applications IV H. Walter Yao Ian T. Ferguson E. Fred Schubert Chairs/Editors 26-27 January 2000 San Jose, California
DISTRIBUTION STATEMENT A Approved for Public Release Distribution Unlimited
Sponsored by U.S. Army Research Office AIXTRON, Inc. SPIE—The International Society for Optical Engineering
P 20001122 076
Volume 3938
IP^'
Form Approved OMB NO. 0704-0188
REPORT DOCUMENTATION PAGE
Public Reporting burden for this collection of information is estimated to average 1 hour per response, including the time for reviewing instructions, searching existing data sources, gathering and maintaining the data needed, and completing and reviewing the collection of information. Send comment regarding this burden estimates or any other aspect of this collection of information, including suggestions for reducing this burden, to Washington Headquarters Services, Directorate for information Operations and Reports, 1215 Jefferson Davis Highway, Suite 1204, Arlington, VA 22202-4302, and to the Office of Management and Budget, Paperwork Reduction Project (07O4-O188.) Washington, DC 20503. 2. REPORT DATE 1. AGENCY USE ONLY (Leave Blank) 3. REPORT TYPE AND DATES COVERED
September 2000
Final report
4. TITLE AND SUBTITLE
5. FUNDING NUMBERS
I DAAD19-00-1 -0025 Light-Emitting Diodes: Research, Manufacturing, and Applications IV 6. AUTHOR(S)
Haude Walter Yao, Principal Investigator
7. PERFORMING ORGANIZATION NAME(S) AND ADDRESSEES)
SPIE-lnternational Society for Optical Engineering Bellingham, WA 98225 9. SPONSORING / MONITORING AGENCY NAMEfS) AND ADDRESS(ES)
U. S. Army Research Office P.O. Box 12211 Research Triangle Park, NC 27709-2211
8. PERFORMING ORGANIZATION REPORT NUMBER
10. SPONSORING / MONITORING AGENCY REPORT NUMBER
ARO41034.1-EL-CF
11. SUPPLEMENTARY NOTES
The views, opinions and/or findings contained in this report are those of the author(s) and should not be construed as an official Department of the Army position, policy or decision, unless so designated by other documentation. 12 a. DISTRIBUTION / AVAILABILITY STATEMENT
12 b. DISTRIBUTION CODE
Approved for public release; distribution unlimited. 13. ABSTRACT (Maximum 200 words)
This book records the fourth conference dedicated to light-emittingdiodes (LEDs), held during Photonics West in San Jose, California on 26-27 January 2000. The proceedings contain 30 invited and contributed papers arranged according to the 6 sessions of the conference. The papers cover LEDs emitting in the ultraviolet, visible, and infrared regions of the optical spectrum. LEDs are used for lighting, display, communication, and other applications. This book provides an overview of the current rapid progress in this field.
14. SUBJECT TERMS
15. NUMBER OF PAGES
16. PRICE CODE
17. SECURITY CLASSIFICATION OR REPORT UNCLASSIFIED NSN 7540-01-280-5500
18. SECURITY CLASSIFICATION ON THIS PAGE UNCLASSIFIED
19. SECURITY CLASSIFICATION OF ABSTRACT UNCLASSIFIED
20. LIMITATION OF ABSTRACT UL Standard Form 298 (Rev.2-89) Prescribed by ANSI Std. 239-18 298-102
PROCEEDINGS OF SPIE ^3g7 SPIE—The International Society for Optical Engineering
Light-Emitting Diodes: Research, Manufacturing, and Applications IV H. Walter Yao Ian T. Ferguson E. Fred Schubert Chairs/Editors 26-27 January 2000 San Jose, California
Sponsored by U.S. Army Research Office AIXTRON, Inc. SPIE—The International Society for Optical Engineering
Published by SPIE—The International Society for Optical Engineering
Volume 3938
SPIE is an international technical society dedicated to advancing engineering and scientific applications of optical, photonic, imaging, electronic, and optoelectronic technologies.
The papers appearing in this book compose the proceedings of the technical conference cited on the cover and title page of this volume. They reflect the authors' opinions and are published as presented, in the interests of timely dissemination. Their inclusion in this publication does not necessarily constitute endorsement by the editors or by SPIE. Papers were selected by the conference program committee to be presented in oral or poster format, and were subject to review by volume editors or program committees.
Please use the following format to cite material from this book: Author(s), "Title of paper," in Light-Emitting Diodes: Research, Manufacturing, and Applications IV, H. Walter Yao, Ian T. Ferguson, E. Fred Schubert, Editors, Proceedings of SPIE Vol. 3938, page numbers (2000). ISSN 0277-786X ISBN 0-8194-3555-4
Published by SPIE—The International Society for Optical Engineering P.O. Box 10, Bellingham, Washington 98227-0010 USA Telephone 360/676-3290 (Pacific Time) • Fax 360/647-1445 Copyright ®2000, The Society of Photo-Optical Instrumentation Engineers. Copying of material in this book for internal or personal use, or for the internal or personal use of specific clients, beyond the fair use provisions granted by the U.S. Copyright Law is authorized by SPIE subject to payment of copying fees. The Transactional Reporting Service base fee for this volume is $15.00 per article (or portion thereof), which should be paid directly to the Copyright Clearance Center (CCQ, 222 Rosewood Drive, Danvers, MA 01923. Payment may also be made electronically through CCC Online at http://www.directory.net/copyright/. Other copying for republication, resale, advertising or promotion, orany form of systematic or multiple reproduction of any material in this book is prohibited except with permission in writing from the publisher. The CCC fee code is 0277-786X/00/$15.00.
Printed in the United States of America.
L
Contents
vii ix
SESSION 1 2
Conference Committee Introduction
lll-NITRIDE LIGHT-EMITTING DIODES I High-brightness AIGalnN light-emitting diodes (Invited Paper) [3938-02] M. R. Krames, G. Christenson, D. Collins, L. W. Cook, M. G. Craford, A. Edwards, R. M. Fletcher, N. F. Gardner, W. K. Goetz, W. R. Imler, E. Johnson, R. S. Kern, R. Khare, F. A. Kish, C. Lowery, M. J. Ludowise, R. Mann, M. Maranowski, S. A. Maranowski, P. S. Martin, J. O'Shea, S. L. Rudaz, D. A. Steigerwald, J. Thompson, J. J. Wierer, J. G. Yu, LumiLeds Lighting; D. Basile, Y.-L. Chang, G. Hasnain, M. Heuschen, K. Killeen, C. P. Kocot, S. Lester, J. N. Miller, G. O. Mueller, R. Mueller-Mach, S. J. Rosner, R. P. Schneider, T. Takeuchi, T. S. Tan, Agilent Technologies
13
Design and performance of nitride-based UV LEDs (Invited Paper) [3938-08] M. H. Crawford, J. Han, W. W. Chow, M. A. Banas, J. J. Figiel, L. Zhang, R. J. Shul, Sandia National Labs.
24
GaN-based MQW light-emitting devices (Invited Paper) [3938-05] M. Koike, S. Yamasaki, Y. Tezen, S. Nagai, S. Iwayama, A. Kojima, T. Uemura, A. Hirano, H. Kato, Toyoda Gosei Co., Ltd. (Japan)
30
White-light-emitting diodes for illumination [3938-06] R. Mueller-Mach, G. O. Mueller, Agilent Technologies
SESSION 2
MI-NITRIDE LIGHT-EMITTING DIODES II
44
InGaAlP and InGaN light-emitting diodes: high-power performance and reliability (Invited Paper) [3938-12] I. Eliashevich, J.-P. M. Debray, C. A. Tran, H. Venugopalan, R. F. Karlicek, Jr., GELcore LLC/EMCORE Corp.
52
Gain switching of GalnN MQW laser diodes [3938-14] C. Marinelli, I. Y. Khrushchev, J. M. Rorison, R. V. Penty, I. H. White, Univ. of Bristol (UK); T. Takeuchi, H. Amano, I. Akasaki, Meijo Univ. (Japan); Y. Kaneko, S. W. Watanabe, N. Yamada, Agilent Technologies (Japan); G. Hasnain, R. P. Schneider, S.-Y. Wang, M. R. T. Tan, Agilent Technologies
60
Photon recycling semiconductor light-emitting diode [3938-10] X. Guo, J. W. Graff, E. F. Schubert, Boston Univ.; R. F. Karlicek, Jr., GELcore LLC
SESSION 3
HIGH-EFFICIENCY LEDs
70
Nonresonant-cavity light-emitting diodes (Invited Paper) [3938-03] R. Windisch, IMEC (Belgium); M. Kuijk, Vrije Univ. Brussels (Belgium); B. Dutta, IMEC (Belgium); A. Knobloch, P. Kiesel, C. H. Döhler, Friedrich-Alexander Univ. Erlangen-Nürnberg (Germany); G. Borghs, P. L. Heremans, IMEC (Belgium)
77
High-power truncated-inverted-pyramid (AlxGa,.,)0 5ln05P light-emitting diodes [3938-09] M. O. Holcomb, M. R. Krames, G. E. Hofler, C. Carter-Coman, E. I. Chen, P. N. Grillot, K. Park, N. F. Gardner, J.-VV. Huang, J. Posselt, D. Collins, S. A. Stockman, M. G. Craford, LumiLeds Lighting; F. A. Kish, l.-H. Tan, T. S. Tan, C. P. Kocot, M. Hueschen, Agilent Technologies
82
Resonant-cavity LEDs at 655- and 880-nm wavelengths [3938-13] P. Si pi I ä, M. J. Saarinen, V. Vilokkinen, S. Orsila, P. Melanen, P. Savolainen, M. Toivonen, M. M. Dumitrescu, M. Pessa, Tampere Univ. of Technology (Finland)
90
45% quantum-efficiency light-emitting diodes with radial outcoupling taper [3938-07] W. Schmid, F. Eberhard, R. Jäger, R. King, M. Miller, J. Joos, K. J. Ebeling, Univ. of Ulm (Germany)
SESSION 4
lll-NITRIDES AND RELATED MATERIALS
100
Highly efficient InGaN/GaN MQW for blue- and green-light-emitting structures grown in production MOVPE reactors [3938-1 6] M. D. Bremser, AIXTRON, Inc.; M. Luenenbuerger, H. Protzmann, M. Heuken, AIXTRON AG (Germany)
105
Disorder in InGaN light-emitting diodes [3938-1 7] M. Pophristic, S. J. Lukacs, F. H. Long, Rutgers Univ.; C. A. Tran, I. T. Ferguson, EMCORE Corp.
113
Optical properties of AIN/sapphire grown at high and low temperatures studied by variable angle spectroscopic ellipsometry and micro Raman scattering [3938-18] C. H. Yan, H. W. Yao, Univ. of Nebraska/Lincoln; A. C. Abare, S. P. DenBaars, Univ. of California/Santa Barbara; J. J. Klaassen, M. F. Rosamond, P. P. Chow, SVT Associates, Inc.; J. M. Zavada, U.S. Army European Research Office (UK)
124
Novel processing for improving optical property of InGaN/GaN MQW light-emitting diode [3938-19] C. H. Hwang, K.-Y. Hsieh, National Sun Yat-sen Univ. (Taiwan); H. S. Huang, Military Acadamy/Kaohsiung (Taiwan); L.-W. Tu, National Sun Yat-sen Univ. (Taiwan)
1 31
Optical properties of InN thin films [3938-20] V. Ya. Malakhov, Institute for Problems of Materials Science (Ukraine)
137
Exciton localization and the Stokes' shift in undoped InGaN/GaN multiquantum wells (Invited Paper) [3938-21] Y. F. Chen, T. Y. Lin, H. C. Yang, National Taiwan Univ.
SESSION 5 144
154
Ill-As AND Ill-P LEDs improved-efficiency positive and negative luminescent light-emitting devices for mid-infrared gas-sensing applications (Invited Paper) [3938-22] M. J. Pullin, X. Li, J. Heber, D. Gervaux, C. C. Phillips, Imperial College of Science, Technology and Medicine (UK) Native oxided AlAs current blocking layer for AIGalnP high-brightness light-emitting diodes
[3938-23] G. Wang, X. Ma, Y. Zhang, S. Wang, Y. Li, L. Chen, Institute of Semiconductors (China)
SESSION 6 160
169
NOVEL STRUCTURES AND MATERIALS Substrate-removed 850-nm RCLEDs and small core (63/125 pm) plastic optical fibers for optical data communication (Invited Paper) [3938-25] T. Coosemans, R. Bockstaele, A. Van Hove, K. Naessens, J. Derluyn, L. Vanwassenhove, P. Van Daele, I. Moerman, R. G. Baets, 1MEC (Belgium) Efficiency optimization in ionically self-assembled thin film polymer light-emitting diodes
[3938-26] D. Marciu, M. Miller, A. L. Ritter, Luna Innovations, Inc.; M. A. Murray, P. J. Neyman, W. Graupner, J. R. Heflin, H. Wang, H. W. Gibson, R. M. Davis, Virginia Polytechnic Institute and State Univ. 180
LED backlight: design, fabrication, and testing [3938-30] D. M. Brown, MEMS Optical, LLC; R. N. Dean, Auburn Univ.; J. D. Brown, MEMS Optical, LLC
1 88
Multispectral reflectance-mode fiber optic deposition rate monitor [3938-31] J. T. Daly, J. A. Wollam, Ion Optics, Inc.; F. Luo, T. F. Morse, Boston Univ.; A. Kussmaul, D. Pulver, Lasertron, Inc.
1 96
4-mW microcavity LED at 650 nm on germanium substrates [3938-41] M. D'Hondt, Union Miniere (Belgium) and IMEC (Belgium); P. Modak, D. Delbeke, I. Moerman, P. Van Daele, R. G. Baets, P. M. Demeester, IMEC (Belgium); P. Mijlemans, Union Miniere (Belgium)
205
Long-wavelength shift of ZnSSe metal-semiconductor-metal light-emitting diodes with high injection currents [3938-33] Y. K. Su, W. R. Chen, S.-J. Chang, National Cheng Kung Univ. (Taiwan); F.-S. Juang, National Huwei Institute of Technology (Taiwan); W. H. Lan, A. C. H. Lin, H. Chang, Chung Shan Institute of Science and Technology (Taiwan)
POSTER SESSION 218
Effects of buffer layer growth conditions on the GaN epilayer quality by MOCVD [3938-34] F.-S. Juang, National Huwei Institute of Technology (Taiwan); Y. K. Su, S.-J. Chang, T. K. Chu, C. S. Chen, National Cheng Kung Univ. (Taiwan); L. W. Chi, K. T. Lam, Kao Yuan Institute of Technology and Commercialism (Taiwan)
224
Ohmic contacts to GaN with rapid thermal annealing [3938-35] L. W. Chi, K. T. Lam, Y. K. Kao, Kao Yuan Institute of Technology (Taiwan); F.-S. Juang, Y. S. Tasi, National Huwei Institute of Technology (Taiwan); Y. K. Su, S.-J. Chang, C. C. Chen, J. K. Sheu, National Cheng Kung Univ. (Taiwan)
234
Optical properties of Fe(1.x)Co„Si2 thin films [3938-38] Y.-J. Zhang, Y.-X. Zheng, R. J. Zhang, L.-Y. Chen, Fudan Univ. (China)
240
Characterizing white LEDs for general illumination applications [3938-39] N. Narendran, N. Maliyagoda, A. Bierman, R. M. Pysar, M. Overington, Rensselaer Polytechnic Institute
249
High-performance epoxy casting resins for SMD-LED packaging [3938-40] G. Bogner, A. Debray, OSRAM Opto Semiconductor GmbH (Germany); K. Höhn, Siemens AG (Germany)
263 264
Addendum Author Index
Conference Committee
Conference Chairs H. Walter Yao, University of Nebraska/Lincoln Ian T. Ferguson, EMCORE Corporation E. Fred Schubert, Boston University Program Committee Isamu Akasaki, Meijo University (Japan) Hiroshi Amano, Meijo University (Japan) Steven P. DenBaars, University of California/Santa Barbara Kathy Doverspike, Cree Research, Inc. Mitra Dutta, U.S. Army Research Office Robert M. Fletcher, Hewlett-Packard Company Paul L. Heremans, IMEC (Belgium) Juergen Jahns, Fernuniversität Hagen (Germany) Eric D. Jones, Sandia National Laboratories Lionel C. Kimerling, Massachusetts Institute of Technology Jeffrey N. Miller, Hewlett-Packard Laboratories Shuji Nakamura, Nichia Chemical Industries, Ltd. (Japan) Li Wei Tu, National Sun Yat-sen University (Taiwan) Eli Yablonovitch, University of California/Los Angeles Session Chairs 1
Ill-Nitride Light-Emitting Diodes I H. Walter Yao, University of Nebraska/Lincoln John M. Zavada, U.S. Army European Research Office (UK)
2
Ill-Nitride Light-Emitting Diodes II E. Fred Schubert, Boston University
3
High-Efficiency LEDs Steven P. DenBaars, University of California/Santa Barbara
4
Ill-Nitrides and Related Materials Eric D. Jones, Sandia National Laboratories Klaus H. Ploog, Paul-Drude-Institut für Festkörperelektronik (Germany)
5
HI-As and lll-P LEDs Paul L. Heremans, IMEC (Belgium)
Novel Structures and Materials R. Scott Kern, LumiLeds Lighting Masayoshi Koike, Toyoda Gosei Company, Ltd. (Japan) Poster Session Li Wei Tu, National Sun Yat-sen University (Taiwan)
Introduction
This book records the fourth conference dedicated to light-emitting diodes (LEDs), held during Photonics West in San Jose, California on 26-27 January 2000. The proceedings contain 30 invited and contributed papers arranged according to the 6 sessions of the conference. The papers cover LEDs emitting in the ultraviolet, visible, and infrared regions of the optical spectrum. LEDs are used for lighting, display, communication, and other applications. This book provides an overview of the current rapid progress in this field. We would like to thank the authors, program committee members, session chairs, and their affiliations for providing this valued and timely update on LED research, manufacturing, and applications. H. Walter Yao Ian T. Ferguson E. Fred Schubert
SESSION 1
Ill-Nitride Light-Emitting Diodes I
Invited Paper
High-brightness AlGalnN light-emitting diodes M. R. Krames, G. Christenson, D. Collins, L. W. Cook, M. G. Craford, A. Edwards, R. M. Fletcher, N. Gardner, W. Goetz, W. Imler, E. Johnson, R S. Kern, R. Khare, F. A. Kish, C. Lowery, M. J. Ludowise, R Mann, M. Maranowski, S. Maranowski, P. S. Martin, J. O'Shea, S. Rudaz, D. Steigerwald, J. Thompson, J. J. Wierer, J. Yu LumiLeds Lighting, 370 W. Trimble Rd., San Jose, CA 95131 D. Basile, Y-L Chang, G. Hasnain, M. Hueschen, K. Killeen, C. Kocot, S. Lester, J. Miller, G. Mueller, R Mueller-Mach, J. Rosner, R. Schneider, T. Takeuchi, T. S. Tan Agilent Laboratories, 3500 Deer Creek Road, Palo Alto, CA 94303 ABSTRACT Currently, commercial LEDs based on AlGalnN emit light efficiently from the ultraviolet-blue to the green portion of the visible wavelength spectrum Data are presented on AlGalnN LEDs grown by organometallic vapor phase epitaxy (OMVPE). Designs for high-power AlGalnN LEDs are presented along with their performance in terms of output power and efficiency. Finally, present and potential applications for high-power AlGalnN LEDs, including traffic signals and contour lighting, are discussed. Keywords: LED, light-emitting diode, gallium nitride, high power LED, AlGalnN, InGaN
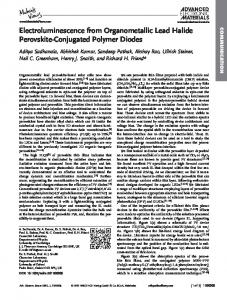
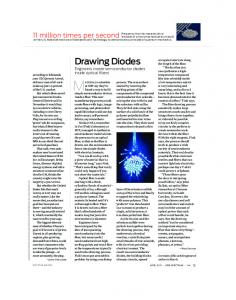
1. INTRODUCTION The evolution of LED performance has proceeded at a phenomenal rate and is now at the point that these solid-state emitters are competing successfully against conventional lighting solutions in a number of applications. An illustration of the evolution of LED performance in commercial industry is shown in Fig. 1. The development of Low-Pressure Sodium (18W)
100
Shaped AÜBGaP/GlP RED - ORANGE - YELLOW
Fluorescent (40W)
AHDG«P/CP RED - ORANGE -YELLOW"
Hmlogen (SOW)
AIInGaP/GaAs RED-ORANGE-YELLOW I
10
Tungsten(60W) Yellow Filtered
AIGaAs/AIGaAs RED
Red Filtered
AIGaAs/GaAi RED
GaAsPiN RED - ORANGE - YELLOW
Edison's First Light Bulb
G«P:N GREEN
0.1
1 ■f *-
I I I 1960
1970
1975
1980
1985
1990
1995
2000
2020
Fig. 1. The evolution of commercial LED performance and its comparison to conventional lighting technologies.
In Light-Emitting Diodes: Research, Manufacturing, and Applications IV, H. Walter Yao, Ian T. Ferguson, E. Fred Schubert, Editors, Proceedings of SPIE Vol. 3938 (2000) • 0277-786X/00/$15.00
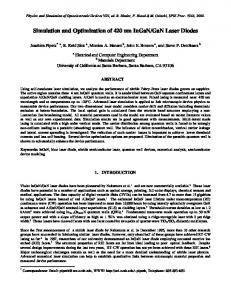
compound semiconductor alloys and the demonstration of the first practical LED (red-emitting GaAsP) in 1962 provided the foundation for the commercial development of the solid-state lamp.1 The discovery of the isoelectronic trap, nitrogen, in GaAsP in 1971 extended the useful wavelength spectrum of Mght-emitting diodes (LEDs) to the yellow spectral region2 A significant increase in the efficiency of red emitters was achieved through the development of AlGaAs/GaAs LEDs employing a fully lattice-matched direct bandgap system and heterostructure active regions.3'4 In the 1970s the LED lamp exceeded the performance (luminous efficiency) of a red-filtered incandescent bulb. The performance of the AlGaAs LEDs was further improved by the development of transparentsubstrate (TS) devices (AlGaAs/AlGaAs) which doubled the efficiency of these emitters compared to their absorbing-substrate (AS) counterparts.5 The emergence of AlGalnP/GaAs technology in the 1980s extended the useful wavelength range of high-brightness emitters into the orange and yellow spectral regions.6 The development of TS AlGalnP/GaP devices doubled the efficiency of these devices and demonstrated the commercial viability of direct compound semiconductor wafer bonding technology.7 Additional improvements to both the internal and external quantum efficiency of TS AlGalnP/GaP devices using multi-well active region structures have resulted in devices with efficiencies >70 Im/W at a peak wavelength (Xp) of 615 nm and external quantum efficiencies >30% at Xp - 632 nm.8 The utility of these devices as practical lighting sources has further been improved by the development of high-power, high-flux (10-20 lm) AlGalnP/GaP LED lamps.9 Most recently, the employment of chip shaping to AlGalnP/GaP LED technology has resulted in power LEDs with luminous efficiencies exceeding 100 lm/W in the orange spectral region (Xp ~610 nm), and external quantum efficiencies exceeding 55% in the deep red spectral region (Xp ~650 nm)10. Similar dramatic improvements in LED performance have been achieved in the blue and green spectra region through the development of the AlGalnN material system. Photoluminescence from porycrystalline GaN was observed in 196211, and the first GaN-based LEDs were fabricated by material grown by hydride-phased vapor epitaxy (HVPE)12"14. The first GaN LEDs grown by OMVPE employed sapphire substrates and were demonstrated in 198415. Considerable improvement was realized after the development of low-temperature buffer layers for highquality GaN films and the realization of p-type GaN:Mg using low-energy 1000 electron-beam ionization (LEEBI)17. Eye Response Curve In 1991, Nakamura and co-workers (CIE) ai High Pressure developed an annealing technique18 o c Sodium (1kW) • that provided similar activation of Mg IS and subsequently demonstrated violet 100 Fluorescent (40W). Mercury Vapor (1 kW) • LEDs employing an InGaN active region19. The brightest AlGalnN Halogen (30W). o. e LEDs are achieved using quantum«A « Tungsten (60W) ■ well active regions wherein the mole c » 10 fraction of InN in the wells determines E the peak emission wavelength20. Red-Filtered Today, external quantum efficiencies Tungsten (60W)" of- 21% in the blue (Xp -470 nm) and - 15% in the green (Xp -530 nm) spectral regions have been observed. 400 500 600 700 800 900 In photometric terms, these Peak Wavelength (nm) efficiencies correspond to -10 lm/W and -55 lm/W, respectively. The Fig. 2. Highest-reported LED luminous efficiencies. highest-reported luminous efficiencies of LEDs to date are shown in Fig. 2 and are dominated by the AlGalnN and AlGalnP material systems.
I
il
2. STATUS OF HI-NITRIDE LED TECHNOLOGY The AlGalnN material system poses some unique challenges compared to conventional HI-V material systems. Presently, the lack of a lattice-mismatched substrate results in very high defect densities, which, although not
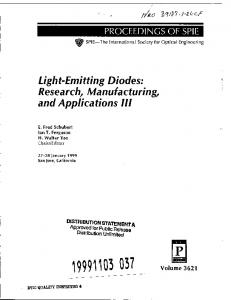
strongly linked to poor quantum efficiency at the low current densities of LEDs, are nevetheless linked to reliability problems for AlGalnN laser diodes21. The two most common substrates used for AuNiCo itart 1 aver Multiple OMVPE growth of AlGalnN are Stacked v ^^^g^j^"MjP^.. '~~'.~ y'-'-j^^j/Q sapphire and SiC. Most QW Active Layers commercial LED suppliers use sapphire substrates which are **Z^'^^ t significantly less expensive than GaN:Si 1 SiC. However, the use of sapphire Buffer Layer-^"^ as a growth substrate poses devices Sapphire Substrate (-100 (jm) design challenges. Sapphire is insulating and therefore both p and n Ohmic contacts must be formed Fig. 3. Typical AlGalnN LED structure. on the top surface of the LED chip. This is performed by mesa etching the AlGalnN LED structure to expose the n-type GaN layers beneath the active region Ohmic n-contact metallization, typically Ti/Al, is applied to the n-type GaN. The p-type Ohmic contact is required to spread current from the p bond pad across the junction area because of the very low conductivity of GaN:Mg. This is typically done by depositing a semi-transparent Ni/Au Ohmic contact metallization across the GaN:Mg surface. Current from the n-type contact is required to spread through the GaN: Si layers beneath the active region. A typical device structure is shown in Fig. 3. In general, this type of structure results in an increased series resistance compared to LEDs based on other EI-V material systems, and provides a challenge in terms of achieving the highest possible power conversion efficiencies. Even accounting for the increased series resistance, AlGalnN LEDs presently exhibit higher forward voltages than LEDs in other IQ-V material systems. Figure 4 shows a plot of forward voltage (at 20 mA) vs. bandgap energy for LEDs based on several different material systems. It is notable that AlGalnN LEDs throughout the blue, green, and amber sprectral regions exhibit forward voltages about 0.5-1.0 V higher than their bandgap voltages. A comparison of current-voltage characteristics of AlGalnP and AlGalnN LEDs, shown in Fig. 4b, show that this voltage increase is apparent at very low current levels. At 1 mA, the AlGalnP LED exhibits a forward voltage of 1.8V, about 300 mV below the bandedge emission at 593 mn At the same current, the AlGalnN LED exhibits a forward voltage of 2.4 V, which is only about 80 mV below the bandedge emission for 500 mn. The difference in series resistance between the two structures is, worst case, about 20 Q. At 1 mA, the difference in series resistance can only account 1000 Grien AlGalnN Blue AlGalnN
100
Amber AlGalnN
£
-■ I
410
I
1*^1—_:
430
450
—
0.00
i
■
i
0.02
—■
-
i
0.04 1/T(K)
Wavelength (nm)
Figure 2a : Room temperature PL spectra of InGaN bulk epilayers [12].
Figure 2b: Temperature dependent integrated PL intensity of InGaN bulk epilayers with In composition x. The Ea values are derived from fitting the data to equation 1 [12].
The PL measurements were performed using a HeCd laser (325 nm) at a low power density of approximately 30 W/cm2. A 0.3 meter spectrometer with an integrated UV enhanced CCD detector was used, with a spectral resolution of approximately 0.2 nm. The room temperature PL spectra for four InGaN epilayer samples is shown in Figure 2b. A strong increase in the integrated PL intensity is seen as In composition is increased, with more than a 25X increase as the peak wavelength shifts from 363-397 nm. The data suggest that the optical efficiency is highly dependent on the In composition. The full temperature dependence of the integrated PL intensity is plotted in an Arrhenius plot in Figure 2b. The data is fit with the following formula [14] I=Io/[l+aexp(-Ea/kT)].
(1)
15
Here the non-radiative decay is assumed to be thermally activated such that the non-radiative lifetime TnT^=T0exp(Ea/kT) and Ea is the activation energy for PL quenching. The parameter a is equal to xjx0 where tr is the radiative lifetime. From the Ea values, we see a systematic increase in the activation energy as the indium composition is increased. The full temperature dependent data thus give further support of the hypothesis that increasing In composition improves the optical efficiency of the materials. Through the increasing Ea values with increasing In composition, we see that the In is reducing the effectiveness of non-radiative recombination mechanisms in quenching the PL intensity. Whether this effect is due to carrier localization or a modification of the nature of the non-radiative centers can not be determined from the data. Additional temperature dependent PL measurements were performed on InGaN, GaN and AlGaN MQW structures. The InGaN QW structures were supplied by Meijo University and have 10 periods of 23 Ä thick Ino.21GaNo.79N QWs with GaN barriers. The GaN MQW structure was grown at Sandia National Laboratories and consists of 4 periods of 30 Ä thick GaN quantum wells with Al0.2oGao.8oN barriers. It should be noted that this GaN MQW structure was grown on an AlGaN buffer so that the QW emission would not be confused with emission from a thick GaN buffer layer. The AlGaN MQW structure was identical to the GaN MQW structure except that approximately 5% aluminum was added to the QWs. In Figure 3a, we show the low temperature (T=10K ) photoluminescence spectra for the three MQW structures. In Figure 3b, we show the temperature dependence of the peak PL intensity for the three MQW structures. A strong distinction is seen in the total drop in peak PL intensity. In particular, the InGaN MQW structure experiences a relatively small (4X) loss in peak PL intensity from 10-300K, while the peak PL drop is 60X and 1000X for the GaN MQW and AlGaN MQW structure, respectively. In the quantitative comparison of the PL data for these three MQW structures, it is important to recognize that the growth conditions for the visible and UV MQW structures were quite different, and it is possible that further optimization of the growth conditions for the UV MQW structures would improve the performance. Nevertheless, this data is a good representation of the performance of our current GaN MQWs and high quality InGaN MQWs. In this data, we see evidence -i—1—1—
105
3 nm AlGaN MOW
T=10K
■
3 nm GaN MQW
104
c
11 ■
3
•
InGaN QW
■
AlGaN QW GaN QW
A
1 1
i
:
*
■
.□
A .«0.
2.3 nm InGaN MQW
11
1000
to
c
;
£
A
■
QL
100
'
■
1 1
: A;
*
1 1
'
■1
•
■
■
2.5
3
3.5
Energy (eV)
Figure 3a: T=10K PL of InGaN, GaN and AlGaN MQWs.
10
i t—1 1
50
1
100
150
1
1
1
200
250
300
Temperature (K) Figure 3b: Temperature dependence of peak PL intensity for InGaN, GaN and AlGaN MQWs.
that the discrepancy in the optical efficiency between the visible and UV MQW structures is highly temperature dependent. In particular, the UV MQW structures are more susceptible to non-radiative recombination processes which serve to quench the PL intensities at room temperature. Furthermore, the severe 1000X drop in intensity from 10-300K for the AlGaN MQWs shows the increasing challenge of obtaining high optical efficiency at wavelengths in the 340 nm region and shorter. As a final experiment, we performed temperature dependent PL studies of InGaN MQW structures where the In composition was kept to a low value (~ 4%) to enable room temperature emission at 380 nm in the UV. These structures are similar to the
16
MQW region of the LED heterostructures described in section 2. The particular structures grown for PL studies consisted of 10 periods of 47 Ä thick InGaN ( x=0.04) QWs with AlInGaN barriers. A drop of ~5X in the integrated PL intensity from 10-300K is seen [13], which is similar to the performance of the blue-emitting InGaN MQW structure described in Figure 3. In summary, the spectroscopic studies that we have performed on InGaN bulk films and InGaN, GaN and AlGaN MQWs have shown that samples with In-containing QWs can have significantly higher optical efficiency than samples with no In in the active region. This result might suggest that GaN/AlGaN MQWs may not be intrinsically capable of performing to the level of InGaN near UV and visible MQWs. To improve the performance of GaN/AlGaN MQWs, a further measure of growing the structures on epitaxially laterally overgrown GaN to significantly reduce dislocation densities may serve to largely improve the non-radiative recombination problem. Indeed, studies by Mukai et. al. have shown that GaN/AlGaN DH LEDs had up to 2X increased output powers when this technique was employed [16]. 3.2 Internal Absorption Effects for Shorter Wavelength (X < 370 nm) UV LEDs In consideration of the challenges in obtaining high efficiency UV LEDs, one must also seriously consider the detrimental role played by internal absorption for UV LEDs with X < 370 nm. At the heart of this problem is the fact that most nitridebased LEDs rely on 3-4 urn thick n-GaN buffer layers and -0.1 um thick p-GaN capping layers for good current spreading and low contact resistance. While these GaN layers are rather transparent for blue LEDs operating at 450 nm, they become strongly absorptive as the QW emission wavelength reaches 370 nm and shorter wavelengths. This effect has been described by both Mayer et. al. [17] and Mukai et al. [18]as a significant contribution to the sudden loss of optical efficiency for X < 370 nm. -i—i—T
r- T
1
1—i
1—p
~~\
1—T
1
I
339 nm GaN Absorption Edge
£Z 3
300
350
400
450
500
We have most clearly seen this effect in the electroluminescence (EL) spectra of AlGaN MQW LEDs operating at 340 nm. These LEDs have similar AlGaN MQW active regions to those described in section 3.1. In Figure 4, we show the EL spectrum at 80 mA injected current. A clear delineation of the GaN absorption edge can be seen at approximately 365 nm. Fabry-Perot (F-P) oscillations exist in the spectrum for wavelengths below this absorption edge, signifying the transparency of the sample at those wavelengths. In contrast, the 340 nm peak from the AlGaN QWs is significantly reduced in intensity compared to what one would expect from the tail emission and shows no F-P oscillations. Thus, it is clear that if one needs high efficiency at these shorter wavelengths, a more transparent buffer layer, such as one consisting of higher bandgap AlGaN or AlInGaN must be employed. Progress in AlGaN buffer layers has been reported by Takeuchi et. al. [19], who have demonstrated growth of a blue laser structure on an Alo.03Gao.97N /Al0.o6Gao.94N buffer layer.
Wavelength (nm) Figure 4: EL spectra for AlGaN MQW LED at 80 mA 3.3 AlGaN Cladding Designs: Critical thickness Limitations and Carrier Leakage Another challenge in the growth and design of nitride-based UV LEDs is the fact that one needs increasingly higher bandgap materials for the barrier and cladding layers. These high bandgap layers are needed to ensure sufficient carrier confinement in the quantum wells, as well as to reduce carrier leakage out of the active region. At present, AlxGa, XN alloys with x=0 100.20 are most commonly used as cladding layers in InGaN and GaN LEDs. Since AlGaN is tensile strained when grown pseudomorphically on GaN buffer layers, there is a critical thickness before dislocations and/or cracking sets in. This requirement puts a strong limitation on the thickness and composition that one may use to reduce electron leakage in the
17
LEDs. In general, these thickness limitations are much more critical for laser diodes than for LEDs, since one needs a much thicker cladding layer to provide optical confinement. Nevertheless it is important to recognize that even for UV LEDs, one must make a compromise between the cladding composition and thickness and the optimal confinement. As will be discussed in section 5, this problem can be eliminated if one could grow high bandgap AlInGaN alloys lattice matched to GaN for cladding layers or grow structures on AlGaN buffer layers. In this section, however, we will focus on the issues of critical thickness and carrier leakage of UV LEDs with AlGaN claddings. The critical thickness for stress relaxation in AlGaN/GaN heterostructures has been studied by Hearne, et al. [20] through insitu stress measurements during MOVPE growth. This work determined that the observed critical thickness for cracking in AlGaN was consistent with the Griffith equation estimated critical thickness. Using the values from Ref. 20, the approximate critical thickness for an Alo.3Gao.7N epilayer on GaN is 700 Ä, for an Al0.2Gao.gN epilayer on GaN is 0.15 urn, and for an Alo.1Gao.9N layer on GaN is 0.6 (im. The effects of exceeding the critical thickness can be clearly seen in Figure 5, where we show a top-view photograph of a 100 urn diameter mesa-etched GaN MQW LED with Al0.2Ga0.gN barrier and cladding layers. The total thickness of the AlGaN layers exceeds 0.2 urn. The cracking networks are especially visible in the etch-exposed n-GaN layer, where preferential etching in the cracks has made them more pronounced. I-V characterization of such LED structures yielded extremely poor reverse leakage characteristics, as shown for a number of cracked devices in Figure 5b. 0.01
< E, c
0.005
0)
k_ h_
3
Ü
-0.005
lOO^mmesa
Figure 5a: Top view photograph of a GaN /AlGaN MQW LED with > 0.2 (im total thickness of Al0.2Ga0.gN barrier.
-0.01
■4-2
0 2 Voltage(V)
Figure 5b: I-V characteristics for several cracked GaN /AlGaN MQW LEDs
Given these limitations in Al composition and thickness, it is useful to evaluate the expected carrier leakage from GaN MQW structures with various composition AlGaN claddings. We have modeled the carrier leakage in a GaN/AlGaN single QW structure grown along the c-axis of the hexagonal wurtzite crystal structure. This particular structure assumes the AlGaN layers are relaxed and that the GaN QW is compressively strained. Such a structure is relevant for UV LED structures grown on transparent AlGaN buffer layers. The basic approach is detailed in Ref. 21. It involves calculating the bandstructure and carrier distribution in both the confined QW states and the unconfined barrier states as a function of injected carrier density. Piezo-electric and spontaneous polarization effects [22] are included in the calculation. Carrier leakage is determined by assuming that the unconfined states of the QW structure, which contribute to current leakage via carrier recombination, drift or diffusion, may be populated through thermalization with the population in the bound QW states. We determine the carrier leakage by the ratio of the unconfined carrier density to the confined carrier density. A schematic of the GaN SQW heterostructure and the processes described by the model are shown schematically in Figure 6. We use a 6 x 6 LuttingerKohn Hamiltonian and the envelope approximation [23] to compute the hole energy dispersions and the optical dipole matrix elements. Input parameters to the calculation are the bulk wurtzite materials parameters [24] for the binary alloys. A conduction band offset of 0.67 is assumed.
18
Barrier States
_n
Thermionic /"j—i^ Drift
r*
Tunneling
Quantum Well States
AlGaN Barrier GaN QW
Figure 6: Schematic of the GaN SQW heterostructure and states involved in the carrier leakage model We first explore the carrier leakage using a relatively low bandgap Alo.1Gao.9N barrier and plot the electron and hole densities in unconfined states versus total carrier population. In Figure 7 we show the results of our calculations for a 2 nm and a 4 nm thick GaN QW. The calculations assume T=300K. 0.35
I
I
I I I I llf""
I
I 'I 'I I I ■ 11
0.25
1
2 nm GaN QW AlGaN (x=0.1) barrier
4 nm GaN dw AlGaN (x=0.l|) barrier
c m
/;
0.2
Q
,
D
:
0.25
A
/
:
0.15 -
a
0.1
■□
a)
1 ■
0.15
1 '
0.05 -
■
/
1
10" Carrier Density (cm-2)
>
1
10"
1
1
1 1 1 nrl
10"
1
t.i.q-L.i.n 1
10"
Carrier Density (cm-2)
Figure 7: Electron (solid curve) and hole (dashed curve) densities in unconfined states versus total (confined and unconfined) carrier population at T=300K for (a) 2 nm GaN QW/Alo.iGao.gN barrier structure and (b) 4 nm GaN QW/Alo.iGao.gN barrier structure. For both the 2 nm QW and the 4 nm QW, we see that the unconfined carrier populations are relatively insensitive to the total carrier density until one reaches total densities of approximately lxlO12 cm"2. This density is higher than that typically used for LED operation, and thus the carrier leakage should be relatively insensitive to injected current for LED operation at modest injection levels. For UV laser diodes, however, where one would expect the threshold carrier densities to be as high as lxlO1 cm"2, our calculations predict a significant loss of 20-35% of the carriers due to leakage. For the narrower 2 nm QW in the low injection regime ( < lxlO12 cm"2), our analysis shows that hole leakage is dominant and can represent a carrier loss of up to 20%. In contrast, electron leakage dominates for the wider 4 nm well and is reduced to -6% at these injection levels. The dominance of hole leakage for the 2 nm well can be explained by the fact that the valence band offset is significantly smaller than the conduction band offset ( AEc=0.67Eg is assumed) and the confined quantum well states are relatively close to the unconfined levels in this narrow well. In the thicker 4 nm well, the confined states have lower energy relative to the unconfined states and can provide sufficient confinement for the holes. In this case, the lighter electrons
19
experience more leakage. Although the 4 nm well is clearly superior in terms of reduced leakage, it is important to note that piezoelectric effects, which would significantly reduce electron-hole overlap, are more severe for the thicker wells. We further explore the importance of higher Al composition claddings by calculating the carrier leakage for 2 nm GaN QWs with Al01Gao.9N barriers and Al0.2Gao.8N barriers. In Figure 8, we assume an injected carrier density of 1x10 cm" and plot the unconfined carrier density as a function of LED temperature. From this calculation, we see that the benefit of the higher bandgap Al0.2Ga0.gN barrier is quite significant, showing only a 0.5% electron leakage at 300K. The stronger confinement of this structure leads to electron leakage being dominant, as for the thicker QW case in Figure 7b. The electron and hole leakage levels increase strongly with temperature, resulting in up to 2.7% electron leakage at 100°C above room temperature. 0.03
0.4 '. 2nm GaNC IWAIC 5aN (X: =0.1) b arrier^
g
0.35
CD
Q
rö S
el ectron --he)le
■
„ 0.3
g« '£ 0J
0.25
TJ CD
c
'
:
0.2
■
0.02
0.15 _J_I...O_
280
•
300
1
1
1
320
1
1
.
340
■
1
360
Temperature (K)
.
380
400
1
// / > /
■
0.01
o o c
0.005
(a) :
. .
T3 QJ
■
■
. -
'
■
^
*
/
s
x
. . '
/
■
■
. . . . . . . . .
1
420
280
' .
// //
electron hole
:
■B
'■
0.1
:
■
/
„ «
S
0025
Q
o
/
■
D
•
•
•
/
I-
■ 2nrr GaN 2WAI 3aN()=0.2) carrier
'■
300
320
340
360
380
(b); •
400
420
Temperature (K)
Figure 8: Electron (solid curve) and hole (dashed curve) densities in unconfined states versus total (confined and unconfined) carrier population as a function of temperature for (a) 2 nm GaN QW/A lo.1Gao.9N barrier structure and (b) 2 nm GaN QW/Al0.2Gao.8N barrier structure. A total carrier concentration of lxlO11 cm"2 was assumed. In summary, we have shown that carrier leakage can significantly reduce the efficiency of GaN/AlGaN MQW LEDs. A barrier Al composition of x=0.2 is sufficient to reduce carrier leakage to < 1% of the total carrier population for 2 nm thick GaN QWs at 300K. In-situ stress measurements suggest that up to 0.15 um of Al0.2Gao.sN barrier and cladding layers can be employed before large scale cracking sets in. For shorter wavelength UV LEDs (< 350 nm), such as those employing AlGaN QWs, issues of carrier confinement and critical thickness are more critical.
4. PERFORMANCE OF GaN/AlGaN MQW LEDS for X < 360 nm We have fabricated GaN/AlGaN MQW LEDs using the heterostructure design shown described in section 2. 100 um-250 urn mesas were defined by inductively coupled plasma (ICP) etching. Ti/Al/Ti/Au was used as the n-contact, and Ni/Au oxidized to form semi-transparent NiO [25] was used as the p-contact. Initial structures had a relatively narrow 30 Ä QW, and electroluminescence peaked at 354 nm [3], as shown in Figure 9a. Th L-I-V data shown in Figure 9b was taken with a calibrated Si detector in close proximity to the sample, and demonstrates 12 uW of output power at a current of 20 mA ( ~ 180 A/cm for these devices), and a turn-on voltage of approximately 4V. This performance results in an external quantum efficiency of below 0.1%, which is largely due to the internal absorption effects. The EL FWHM of 5.8 nm is significantly narrower than that reported for InGaN blue and green LEDs; a feature which is often desirable for spectroscopic applications.
20
i ■ ' ' ' i ' ' '
353.6 nm
l = 5mA
FWHM = 5.8 nm (57.4 meV)
340
350
360
370
380
390
10
Wavelength (nm)
15
20
Current (mA)
Figure 9: (a) Electroluminescence spectrum of 30 Ä GaN/AlGaN MQW LED at 5 mA. (b) Light output-current-voltage characteristic for this 120 urn diameter mesa-etched device. [3] We have further optimized the growth of the GaN QW regions as well as explored QW structures emitting at slightly longer wavelengths where the internal absorption effects would be reduced. In Figure 10, we show the performance of a GaN/AlGaN MQW LED with emission at 357.5 nm. From the EL spectrum, and one can see that the tail of the spectrum is enhanced due to the strongly reduced absorption of the GaN buffer layer at those wavelengths. The L-I data shown in Figure 10b was taken from LEDs bonded to TO-headers (no encapsulation or lens), and using an integrating sphere coupled to a calibrated Si detector. These LEDs showed > 100 U.W output at currents up to 50 mA (~ 100 A/cm2 for these larger devices). While these powers are at least an order of magnitude less than that measured from commercially available blue and green LEDs, such powers are already sufficient for a number of fluorescence-based sensing applications. I
'
'—T
1=20 mA *—■
3 .£> t— (O
>. '55 c
c —i LU
340
360
380
400
Wavelength (nm)
420
10
20
30
40
50
60
Current (mA)
Figure 10: (a) Electroluminescence spectrum of a GaN/AlGaN MQW LED at 20 mA. (b) Light output-current-voltage data for this larger device.
21
5. PERFORMANCE OFInGaN/AlInGaN LEDS FOR370 nm^»620 J I / \ jf \ / l /2500K ; ? ^Ij630 t ': 7 ' ~X'\' f "'330DK ......~s..r --^r"
/ :/ /\ '6000K!
**
J^V
,. Ji/ ..
400
\I^.
,
^^iw.
5O(IY,Gd)/0BCCe
700
excitation wV>
i 0.8
v\\
0 0.6
v\\
4
f °-
\\\
1 0.2
\^V\
250
350
450
8245
7ÖE4
550 7153
650 TO2~
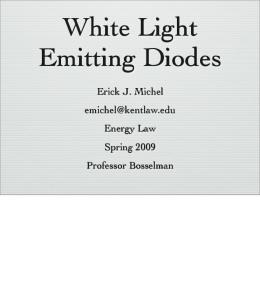
Fig.8: Emission (upper part) and excitation (lower part) spectra of YAG:Ce phosphors shift with increasing Gd content to the red.
— CIE1931 —Planckian locus ^ HPLED,T=25C ■ HPLED,T=105C A Phosphors
0 520 B
■
fjjj
♦55a \NJ:
: I510
: ^«206 :
1%5. 590
\
^B500
8db 10.000K
V
r /[//'; /2500K
;
/1 5000K :
:
^490
\
W
i
480
«%j«0n Tl^—
Fig.9: In a pcLED one has the choice of some LED wavelengths for each phosphor (left part) and for any LED wavelength several phosphors are possible (right part).
36
nm 800
1.2
varying the phosphor amount yielded Fig.9c. 1-phosphor pcLED
100 80 60 40
1 phosphor pcLED
100
;
P7193
; -^r^-
■
«60
;
P7118 AAA»J»»-
: ^**^^ A
M A
g40
\
20
20
\ CCT.K ■
.—,—.—,—I—,—1—.—,—1—,—,—,—,—1
4000
6000
8000
'
CCT, K10000
Fig. 9b: Experimental values from lamps made with one phosphor, and LEDs of various wavelengths.
4000
6000
8000
10000
'
'
i
'
12000
'
'
■
I
14000
Fig.9c: Experimental values - varying the phosphor content
To convey some feeling for the matter to readers, who are not familiar with color science, Fig. 10 shows some spectra, and Table 3 gives values of the respective CCT and Ra.. It is obvious, that it is difficult to reach good color rendering at low CCT. Customer satisfaction in Scandinavia, where CCT below 3000°K are most preferred will be difficult to reach, while in Japan with preferred values of 6000°K this solution will satisfy most wishes. Table 3: pcLED from 460 nm LED + YAG:Ce (Fig. 10) opt. power fraction, CCT, °K Ra LE, lm/W LED|phosphor 12|88 3540 70 350 18|82 3860 73 330 22|78 4110 76 318 26|74 4490 79 304 31|69 5270 82 286 460 nm + YAGCe
70
; 5270K: Ra=82
60 _
60
4110K: Ra=76
g 40 c n
3860K: Ra=73 3540K: Ra=70
| 30 20
4490K: Ra=79
fAir~'" /
^""
10 -^—,—,—]—,—,—,—,—j—,—,—,—,—j—,—
'
IL
■•*—i
Having highlighted the temperature dependence of color coordinates in mcLEDs Fig.l 1 presents similar data for the 1-phosphor converted LED (1-pcLED), which are supplemented by Table 4. Really the change with temperature is almost as pronounced as in mcLEDs, and by no means negligible. One might wonder whether customers will cope with it. Of course incandescent shows the same red shift with dimming, which one can achieve, if it is designed into the pcLED.
Of course certain assumptions had to be made about the temperature dependence of the LED and of the conversion efficiency of the phosphor. Both were based on measurements taken on the two components separately. The experimental spectra of the pcLED do not well compare to the simulations, as shown in Fig.l lb. The question about the reason for the discrepancy can tentatively be answered by looking more closely into the shift and broadening of Fig. 10: With YAG:Ce it is possible to achieve good CRI values (Ra>80) at CCTs above 5000°K only; see Table 3 also.
37
the LED spectra with temperature and the decreasing overlap with the absorption spectrum of the phosphor. We will come back to this aspect. Table 4: )cLED from 460 nra LED + YAG:Ce, varying junction temperature, Tj (Fig.l 1) Junction temperature Tj, °C
CCT, °K
Ra
LE, lm/W
25 45 65 85 105
4490 4550 4610 4680 4750
79 79 80 80 81
304 302 301 299 298
Fig.l 1: The temperature variation of the pcLED depends on the phosphor chosen; it is sensible in this case, but rendering improves with increasing temperature
Fig lib: Experimental values on 1-phosphor lamps in dependence on temperature, CCT and Ra given in the legend
As further improvements of color rendering are very possible, it seems a good idea to think about other phosphors. What the YAG:Ce does, as probably no other material, is to provide an extremely broad spectrum.. Ce + has the unique feature to combine the action of a dipole-allowed 5d-4f radiative transition, which is strongly lattice coupled (and therefore phonon-broadened) and crystal field dependent, with an additional 'broadening' by its spin-orbit split ground state. The two-peak structure is washed out by the other broadening influences. By this double action the emission band is much broader than the 460 nm + TG:Eu + SrS:Eu width, which for instance Eu2+ exhibits J17560K 2930K: Ra=93 (another example of an allowed 5d-4f 3060K: Ra=93 2930 K 3350K:Ra=93 transitions). So, Ce3+ appears to be the 3970K: Ra=93 -1-1 ? 8 ultimate choice for a 1-pcLED, and the host 5620K: Ra=93 « 257560K:Ra=90 is right to shift excitation and emission into S 2015the right position. 10Adding a second phosphor or a third color can 5 vastly improve the color properties of the system. Very much alike the situation in the mcLED the 700 nm 80 500 6 00 4130 blue from the diode can be complemented by a Fig. 12: The spectra show the variety of CCTs, green from one phosphor and a red emission from obtainable with excellent rendering by the combination a second phosphor. If the phosphors are 'right', of two highly balanced phosphors; see also Table 5. this could be the ultimate choice. The problem 30
38
lies in finding the right combination, which is excitable by the same blue diode emission. It is not evident, that a solution to this problem exists, which furthermore gives a good color rendering. But really there is a combination and it is Eu2+ in 4.E-0S SrGa2S4 for green (TG:Eu) and the same dopant in SrS for red (SrS:Eu2+). Their emission spectra are shown together with emission of a well exciting LED in Fig.12. In the CIE1931 color space the combination looks as depicted in Fig. 13. It is 500 600 700 nm soo obvious, that the corners of the triangle are not too far from the preferred mcLED combination of Fig. 12b: Experimental results on 2-phosphor Fig.5. No incident, as the spectral widths are also pcLED exhibit Ra>85 for all CCT obtained, 3200 ■ comparable. Table 5 shows some power fractions 4400 K in this case. of the spectral components, which lead to the Ra values at the respective CCTs. No doubt, de-luxe lighting can be achieved, based on this system. 2-phosphor pcLED
8.E-06
A reality check produced the experimental spectr a shown in Fig. 12b, the variety of which is due to the varied amounts of each phosphor in the lamps. Fig. 12c gives the (expected) good rendering behavior of the generated light for a whole bunch of wanted correlated color temperatures. This could have easily been extended to higher color temperatures but the present understanding is, that general indoor lighting will give a preference to the 'warm' whites. And as pointed out before, good rendering in the high CCT range can be achieved with one phosphor. The slight undershoot of the expectations, expressed in Table 5, Fig. 12c: Experimental makes of 2-phosphor which gives the simulated results of Ra lying above LEDs show the expected excellent rendering for 90, has yet to be explained. As tentatively as the all wanted color temperatures possible reason for the disagreement between Fig.l 1 and 1 lb it could be the incomplete account taken of the consequences of shift and broadening of the LED emission, which causes these differences. Table 5: 2-pcLED from 460 nm LED + TG:Eu + SrS:Eu (Fig.12,13) opt. power fraction, LE, Im/W CCT, °K Ra B|G|R 325 93 10|32|58 2935 325 3062 93 12|33|55 322 14|34|52 3351 93 320 3973 93 19|35|46 299 5616 93 29|36|35 90 290 7561 35|37|28 An often-asked question is to the amount of efficiency one has to pay for the many advantages of pcLED. We know of no published systematic investigations of this problem. The major difficulty lies in the inevitable (at the present state of the art) variation of the output or efficiency of individual chips, even of one wafer. So, the only possibility, which we saw, was a statistical approach:
39
manufacturing from the same wafer in the same way many — CE1931 pcLED and many reference — Plarckian locus blue LED. A comparison of the «. HPLED,T=25C outputs of the two groups will ■ HPLED,T=105C yield the conversion efficiency. 4 Phosphors O see Table 5 This was done some years ago with 5-mm lamps of conventional (HP) design. The result is summarized in Fig. 14. Obviously the gross conversion efficiency is 58%. As the relative standard deviations in either of the groups are about 10%, this result can be well trusted. Comparing the experimental values with principal margins, one has to state that there is a quantum deficit between the exciting photons and the emitted.ones. As the emitted are a broad distribution it Fig. 13: CIE diagram illustrating the two-phosphor de-luxe pcLED. All depends slightly on the CCT, correlated color temperatures are possible with Ra>90.. The color points but a conservative value for of Table 5 have evidently no tint. this factor in the energy efficiency is 84%. The quantum efficiency of YAG:Ce , and of SrGa2S4:Eu has been reported to be >95% . The product of these values yields an upper margin of 80%. So, evidently there is room for improvement. The losses presently encountered are not well investigated and will be the object of (many) further papers. white/blue It is, however, tempting to try an estimate 5-, r2-5 of the luminous efficiency on about as ■ 4 -2 reliable a basis as the one used for the mcLED. The values are best guess 5 3. - 1.5 | values, extrapolated from much too few E [gfKF Gl^tD apod D
■
1 11 in
10
current [mA]
Figure 2. Total output power (a) and external quantum efficiency (b) of our NRC-LED's compared to a conventional LED, i.e. an LED with a fiat top surface and no rear reflector.
71
and the external quantum efficiency of unpackaged NRC-LED's versus the injection current, and compares their performance to that of conventional reference LED's. The mesa diameter of the LED's is 45 /im, and the diameter of the current aperture is 29 /an. The emission wavelength is 870 nm with a FWHM of « 30 nm.
4. SURFACE SCATTERING For a better understanding of the light extraction mechanism in NRC-LED's we have investigated the internal scattering of light at the textured surface. As we know of no theory which can describe the scattering at surfaces roughened by natural lithography with the structure sizes employed for NRC-LED's, we have introduced a novel technique to experimentally determine the directionality of internal scattering. This directionality cannot be mesured with an external detector, as the light scattered into angles larger than the angle of total internal reflection will not be coupled out of the semiconductor and will thus not reach an externally positioned detector. Thus, we have integrated an InGaAs detector onto the bottom side of the GaAs substrate in order to detect the light scattered at the textured top surface (see Fig. 3). Previously, we have demonstrated that this method allows the reliable measurement of the angular distribution of light transmitted from air through the textured surface into the GaAs.13 Figure 3(a) shows the measurement technique. The textured top surface is illuminated from the bottom by light from an optical fiber. Due to the large index of refraction of the GaAs substrate, the beam divergence from the optical fiber does not influence the direction of propagation inside the GaAs significantly, as the light is refracted towards angles < 16°. Thus, the light is incident almost vertically onto the textured surface. A part of the light is transmitted, the rest of the light is scattered during its reflection at the rough surface. The InGaAs detector detects the light which is scattered into a sperical angle which is determined by the horizontal distance between the fiber spot and the location of the detector. The angular spectrum can be measured by moving the optical fiber as shown in Fig. 3(a). Only angles larger than 20° are accessible, as the external illumination cannot occur through the detector. Figure 3(b) shows the measured dependence of the detected light on the fiber position. As the observed spherical angle decreases with increasing distance between the fiber spot and the detector, the amount of detected light is also decreasing with the distance. The influence of the spherical observation angle can be calculated for a complete randomization of the scattered light. The result is represented by the dashed line in Fig. 3(b). The excellent agreement between the measurement and this calculated curve shows that the directionality of the internally scattered light is almost perfectly randomized. The total amount of scattered light can be obtained by an integration of the measured curve from Fig. 3(b). Comparing the obtained optical power to the incident optical power and the transmitted optical
I
Textured surface Detector
!
"1 ■■—
j
in' 10
^v
— measured • - random scattering
3
«j c
:
"^v^ I
1 10-4
^*SH!
,in ■ +' k2r,in - < — '\k,'out
where kViin and fcr]jn are the azimuthal and radial component inside the semiconductor, respectively, and fcout is the wave vector outside. Since outcoupling requires both components to be small only a negligible part of fight is emitted directly below the active area. The major part of the generated light undergoes total internal reflection and is guided to the taper using an effective back-side reflector. Since the azimuthal component is inversely proportional to the distance from the center it is kept small simply by restricting the active area. The radial component is reduced by successive reflections at the taper surface. Therefore, each initial elementary ray can contribute to the optical output power. A more detailed description is presented in7 where rough design rules are given.
90
In Light-Emitting Diodes: Research, Manufacturing, and Applications IV, H. Walter Yao, Ian T. Ferguson, E. Fred Schubert, Editors, Proceedings of SPIE Vol. 3938 (2000) • 0277-786X/00/$15.00
tapered ring
Figure 1. The upper part indicates the simplified cross-sectional structure of the circularly symmetrical device investigated. The semiconductor has a shape of an extremely fiat truncated cone, which is covered by a mirror. The light is guided radially towards a taper where it is redirected. Outcoupling is only effective when light hits the taper surface with small azimuthal wave vector component kv. The lower sketch indicates that this condition is simply met by restricting the cross section of the active area.
\
'/P
' I *
light emission
3. DEVICE PROCESSING Fig. 2 shows the processing route to form the tapered structure. After MBE growth a few hundred nm thick pedestal with the outer diameter corresponding to the intended device is wet chemically etched. Photoresist is deposited and circularly structured with a slightly smaller size. In a reactor with a well defined temperature and organic solvent concentration the photoresist reflows to the edge of the pedestal and takes a lens shaped form due to surface tension.8 Using ion beam etching with low selectivity the structure is partially transferred into the semiconductor. The remaining photoresist is removed leading to a flat top surface surrounded by a tapered ring as shown in the SEM picture in Fig 3. For further processing we refer to Fig. 4. A GeNiAu metallization is deposited on the outer n-type part of the taper serving as n-contact. Since the reflectivity of the contact metallization is low only a small fraction, more precisely a quarter of the ring is covered by the metal. The p-type contact is realized as a small circle on the center of the top surface. Moderate p-doping and high n-doping levels of the cladding layers prevent current spreading in a)
b) 200nmAIAs
C)
n-GaAs
InGaAsQWs
p-GaAs
d)
! i.:-
L.:.—^*.i*«-*^_^. -. _
•.
Figure 2. Processing steps to achieve a tapered structure. After wet-etching of a 300 nm pedestal in the upper p-type GaAs cladding layer (a) a structured photoresist (b) becomes lens-shaped after treatment in a solvent atmosphere (c). Using chemical-assisted ion-beam etching (CAIBE) the structure is partly transferred into the semiconductor.
91
the active layer. Light generation occurs in an area just slightly larger than the p-contact size. For passivation of the pn-junction at the taper surface we use polyimide layers which are opened at the central p-contact area. As shown later, outcoupling is improved by thin polyimide layers. However, the typical thickness of 400 nm is not sufficient to passivate the n-contact. Therefore, we have to avoid lateral overlap of the following mirror metallization with the n-contact, as indicated in Fig. 4b. Fig. 4c illustrates that a second thicker passivation layer is used to cover the n-metallization. The thickness of a top metallization is galvanically increased to form a quasi substrate. After gluing the wafer upside down on a glass carrier, the substrate is chemo-mechanically thinned down to 50 fj.m. Finally the substrate is selectively etched with an H202:NH40H solution where the pH is adjusted to 8.1.9 In this way the n-contact appears at the surface and can be used for independent addressing current supply.
p-doped flat surface active region n-doped taper AlAs (etch stop)
Figure 3. SEM picture of a structured semiconductor. a)
b) n-contact
p-contact
polyimide
Au mirror
■ir^:±>im*'W-rm>wymz*
d)
c) 1. + 2. polyimide
polyimide
p-contact
galvanic metalization
n-contact
InGaAs QWs
Au mirror
galvanic metalization
r;."'r~»^r'S!STrS:7^.~ä'»»..
Figure 4. Remaining processing steps: (a) n- and p-contact are deposited, (b) an Au mirror is deposited onto a first passivation layer, (c) a homogeneous metallization is deposited onto a second passivation layer and galvanically enhanced, (d) substrate and etch stop layer are removed.
92
4. OPTIMIZATION OF EFFICIENCY Early devices based on lateral taper outcoupling have shown quantum and wallplug efficiencies of about 15%.7 Here we want to show our systematic improvement of the device characteristics. We consider p-type contact, advanced passivation technique, lateral device size, and number of active quantum wells. For measurement of the optical output power we use an integrating sphere. The spectrum is recorded with a conventional spectrum analyzer. For simple calibration we take the sensitivity of the photodiode-sphere system at the peak wavelength. Since the spectrum has a large short wavelength tail this method is not very precise. The calculated efficiencies are therefore not very accurate but nevertheless should give a good indication of the relative influences of various processing methods. For comparison a state-of-the-art device was analyzed at OSRAM, Regensburg, using a calibrated power meter which takes the shape of the spectrum into account. As shown in Section 5 this analysis leads to optical output powers being about 10% larger than in preliminary measurements. The efficiencies given in this section may therefore be only 90% of calibrated figures.
4.1. P-type contact Since lateral current confinement is realized by suitable doping of n- and p-layers, the p-contact has to be close to the active area. The usual Ti/Pt/Au contact metallization shows low reflectivity, i.e. 40% for a Ti thickness of 10 nm10 or 17% for a thickness of 15 nm (own measurements). Therefore we expect considerable re-absorption of fight lowering the efficiency. In order to estimate the influence, a sample was partially covered during Ti/Pt/Au p-contact deposition. Subsequently we deposited pure Au onto the primarily unmetallized structures. In this way same processing of the remaining steps is ensured. Fig. 5 compares output characteristics of both kinds of devices. The influence on the IV-characteristics is negligible. While the Ti/Pt/Au-contacted devices have maximum quantum efficiencies r\q of 15% the high reflectivity of Au raises quantum efficiencies up to 18%. It is to be mentioned that Au can diffuse in GaAs and therefore reduce long term stability. A better choice might be a highly reflective non-diffusing material with good adhesion.
15
o10 c -->ts4i.ar/>jS'4jJ' •■'
In-Spec 100.0%
Sebwc 0,0 X
:5023 < 1.044 a [5.246!
Above: 0.0 %
Peak Lambda
Avge : 501.7 Sid Oev: 0.868': (4.355) In-Spec 108,0%
Bebw 0.0%
Peak Lambda
544.0 534.0
-'Avge : 501.3 Sid Dev. 0.969 Ä (4.858) In-Spec 100,0%
Above: 0.0%
Below: 00%
Above: 0.0 X
ivge : 503.7 Id Dev: 1.219 % (6.141) In-Spec 100.0 2
Below: 0,0 2
Above; 0.0%
Fig. 4: 300 K PL spectra of a full loaded run of a MQW structure with mean emission wavelength of about 500 nm. std. dev. on a single wafer is about 5nm and wafer to wafer std. dev. of 3 nm.
104
Investigations of disorder in InGaN light-emitting diodes Milan Pophristica, Stephan J. Lukacsa, Frederick H. Long*3, Chuong Tranb, Ian T. Fergusonb department of Chemistry, Rutgers University, Piscataway, NJ 08854 b
EMCOPvE Corporation, Somerset, NJ 08873
ABSTRACT We have used time-resolved photoluminescence (PL), with 400 nm (3.1 eV) excitation, to examine InxGai_ light-emitting diodes (LEDs) before the final stages of processing at room temperature. We have found dramatic differences in the time-resolved kinetics between dim, bright and super bright LED devices. The lifetime of the emission for dim LEDs is quite short, 110 ± 20 ps at photoluminescence (PL) maximum, and the kinetics are not dependent upon wavelength. This lifetime is short compared to bright and super bright LEDs, which we have examined under similar conditions. The kinetics of bright and super bright LEDs are clearly wavelength dependent, highly non-exponential, and are on the nanosecond time scale (lifetimes are in order of 1 ns for bright and 10 ns for super bright LED at the PL max). The non-exponential PL kinetics can be described by a stretched exponential function, indicating significant disorder in the material. Stretched exponential lifetimes are consistent with a distribution of lifetimes. Typical values for ß, the stretching coefficient, are 0.45 - 0.6 for bright LEDs, at the PL maxima at room temperature. We attribute this disorder to indium alloy fluctuations. From analysis of the stretched exponential kinetics we estimate the potential fluctuations to be approximately 75 meV in the super bright LED. Assuming a tunneling based hopping mechanism, the average distance between indium quantum dots in the super bright LED is estimated to be 20 Ä.
xN/GaN
Keywords: InGaN, photoluminescence, disorder, indium alloy fluctuations, stretched exponential kinetics
1. INTRODUCTION Recently there has been world-wide interest in the use of nitride semiconductors (e.g., GaN, InN, and A1N) for opto-electronic devices such as lasers and light-emitting diodes. The large changes in physical properties such as band gap, crystal structure, phonon energy, and electronegativity difference between GaN and GaAs, demonstrate that nitride semiconductors are fundamentally distinct from traditional III-V semiconductors. In spite of the impressive progress made in recent years in the development of LEDs and lasers1, significant work needs to be done in terms of the optimization of device performance. In order to achieve this goal, the physics underlying the operation of these devices must be better understood. Furthermore, new diagnostic techniques for the characterization of materials and devices will greatly aid in the long-term commercialization of this technology. It has been recognized that under typical growth conditions there is a positive enthalpy for indium mixing in 2 GaN .Electron microscopy and cathodoluminescence of InGaN has demonstrated the existence of nanometer and micron scale regions of high indium concentration3. It has been hypothesized that the nanoscale regions of high indium concentration are critical to LED operation1. We have previously used time-resolved photoluminescence (TRPL) to investigate indium concentration fluctuations, in InGaN/GaN multiple quantum wells and LEDs4'5. In
Correspondence: Email
[email protected], telephone 973-539-5500
In Light-Emitting Diodes: Research, Manufacturing, and Applications IV, H. Walter Yao, Ian T. Ferguson, E. Fred Schubert, Editors, Proceedings of SPIE Vol. 3938 (2000) • 0277-786X/00/$15.00
105
this paper we discuss the result of time-resolved photoluminescence obtained from a set of LEDs with different quantum efficiencies.
2. EXPERIMENT The light emitting diodes were grown by metal organic chemical vapor deposition at EMCORE Corp. The average indium mole fraction was about 11 %. LEDs consist often layers of Ino.11Gao.g9N, each 35 Ä thick, and nine layers of GaN, each 45 A thick. The whole structure was on c-plane sapphire with 3 microns of unintentionally doped (n-type 5xl016/cm3) GaN as a substrate. The LEDs studied in this work were grown under slightly different conditions, leading to large changes in brightness. After final processing, the electroluminescence from samples was in order of 100 uW, 400 uW and > 2 mW. Based on the electroluminescence efficiency we divide samples in three groups: dim, bright, and super bright LEDs. An amplified and doubled Ti-sapphire laser from Coherent Corporation operating at 250 kHz was used. TRPL measurements were performed with a Hamamatsu streak camera (model C5680). The frequency doubling was done using a beta-barium borate (BBO) crystal. The excitation pulse was at 400 nm (3.10 eV) for timeresolved PL. Calibrated neutral density filters adjusted the excitation power used in the experiments. The typical response time was 60 ps and was determined by electrical jitter in the triggering electronics. The laser power used was 1.6 mW, 2.56 uJ/cm2. The experimental setup is illustrated in Fig. 1.
sample
BBO
laser
filter
Figure 1. Experimental apparatus
The choice of using 400 nm (3.10 eV) excitation was deliberate. At this wavelength, there is not sufficient energy to excite the GaN barrier layers or the p-type and n-type layers on both sides of the multiple quantum well. By selective excitation of the InGaN active layer, we can neglect the important effects of carrier diffusion on the time-resolved photoluminescence. We have discussed some of these effects elsewhere .
106
3. RESULTS AND DISCUSSION 3.1. Lifetime measurements Time-resolved PL data for dim, bright and super bright LED are shown in Fig.l. The lifetime of the emission for dim LED is quite short, 110 ± 20 ps at PL maximum, and the kinetics are not dependent upon wavelength. The short lifetime and low PL intensity of dim LED are due to fast non-radiative recombination processes, which are dominant in this case. This lifetime is short compared to bright and super bright LEDs, which we have examined under similar conditions. The kinetics of bright and super bright LEDs are clearly wavelength dependent, highly non-exponential, and are on the nanosecond time scale. The lifetimes are on the order of 1 ns for bright and 10 ns for super bright LED at the PL max. Such long times are consistent with carrier localization in regions of high indium concentration.
2000
4000
6000
8000
1
Time [ps] Figure 2. TRPL from a) dim, b) bright and c) super bright LED.
3.2. Stretched exponential decays The non-exponential PL kinetics of bright and super bright LEDs, can be described by a stretched exponential function, equation 1, where ß is between 0 and 1 and I(t) is the PL intensity as a function of time, x is the stretched exponential lifetime and ß is the stretching coefficient.
/(0 = /0exp(-(V)
(1)
Stretched exponential decays are consistent with disorder and have been observed in wide variety of physical systems7'8. There is growing evidence from our group LEDs4'5 and others9'10 that stretched exponential decays correctly describe the PL decays from InGaN under a variety of conditions. In the case of InGaN, the dominant source of disorder is alloy disorder. Results of fitting the time-resolved PL from a super bright LED to equation one are shown in Figs. 3 and 4. Both the stretched exponential lifetime and stretching parameter are dependent upon the emission wavelength. The existence of stretched exponential decays is consistent with a broad distribution of lifetimes, which must be included in the theoretical modeling of LEDs. The trends observed in Figures 3 and 4 are typical of a series of InGaN LEDs examined. The wavelength dependence of ß, the stretching parameter for the super bright LED is shown in Fig. 3. We note that ß is maximum at the PL maximum and
107
decreases at both higher and lower emission energies. Similar observations have been made by us in a series of multiple quantum wells5. O.6O-1 0.55■
0.500.45CO.
■
■
■
■
0.400.35-
■
0.30■
0.25-
■
n or\
400
450
500
550
X[nm] Figure 3. Analysis of the time-resolved PL from super bright LED. The stretching parameter ß is clearly wavelength dependent. The stretching parameter is largest at the PL maximum of 480 nm and decreases on both the high and low energy sides of the spectra.
10 c
400
450
500
550
X [nm] Figure 4. Analysis of the time-resolved PL from super bright LED. The stretched exponential lifetime is observed to dramatically increase as the emission wavelength is varied from 420 to 500 nm. The PL maximum is at 480 nm. Note that the vertical axis is a log scale.
By analogy with previous simulations of localized excited states in other disordered semiconductors, the wavelength dependence of ß and t, Figs. 3 and 4, imply that excited state migration is important in InGaN LEDs". The same simulations have demonstrated that, without excited state migration, ß would be expected to be wavelength independent1'. 3.3. Distribution of lifetimes The occurrence of stretched exponential decays is consistent with a distribution of lifetimes. Mathematically, a distribution of single exponential lifetimes is written as a convolution integral, where p(x) represents the distribution of lifetimes.
I(t) =
108
\dxe -t 115 P(r)
(2)
This integral is mathematically equivalent to a Laplace transform. In the case of stretched exponential kinetics the equation is written / exp(-(-) ') = W""Xr) is „
(3)
J
Therefore by using an inverse Laplace transform, one calculates the distribution of lifetimes for stretched exponential kinetics. This calculation can be done numerically, and is shown in Figs. 5 and 6. When ß, the stretching parameter is one, the lifetime distribution is a delta function. As ß becomes smaller, the distribution becomes broader. Note that the probability density, xp(x), for the lifetime distribution is plotted on the vertical axis. ,—,—„-, ,,,,, -—
,,„
|
-
1* Ü.1-
7
^y //
H Q.
^"^^r^. \
//
0.011
1F-30.1
\
\ 4'
\
i
r
0.92"1 0.9 0.8 10.7
i i ■ r, ,
1
" '
T/TS
■ *■ ■ "i
10.6 r
10
0^
V
\).5
\ 100
Figure 5. Distribution of lifetimes for a series of different stretching parameters, ß.
100 Figure 6. Distribution of lifetimes for ß = 0.5, note linear vertical scale. This distribution is consistent with the room temperature operation of the InGaN superbright LEDs.
109
3.4. Estimate of distance between InGaN quantum dots Fig. 3 clearly demonstrates that the stretched exponential lifetime is strongly dependent upon wavelength or emission energy. The data can be successfully fit to an exponential dependence oft on emission energy, where co is the emission frequency and E0 is a parameter that depends upon the potential fluctuations associated with the disorder12.
r(M*exp(-^)
(4)
For the super bright LED, E0 was found to be 570 meV, which is much greater than the thermal energy. Similar results were obtained for several bright and super bright LEDs. It can be shown that equation 4 is consistent with a tunneling mechanism12. We conclude that the carriers produced in the TRPL experiments migrate between different indium quantum dots by a tunneling mechanism. We can relate E0, an experimental parameter, to the average quantum dot size using a simple model. This can be estimated by equation 5 a = ^((Eb)/me)U2 EQ
(5)
where Eb is the potential difference between the InGaN quantum dot energy and the InGaN conduction band, and me is the electron effective mass. By using equation 5, the average tunneling distance can be estimated to be approximately 20 Ä12. Therefore the TRPL data confirms the existence and importance of nanometer scale indium alloy fluctuations on the operation of super bright LEDs. Similar results have been obtained for a series of LEDs. 3.5. Temperature dependence Often the temperature dependence of a decay rate is given by an exp(-AE/kbT), where AE is the barrier height. If the material is disordered, on would expect a distribution of barrier heights. If the distribution of barrier heights is sufficiently large, one would expect to observe stretched exponential decays. This can be shown to be correct by considering a distribution of barrier heights, which is larger than kT, the thermal energy. In this case, it can be shown that stretched exponential decays occur, with ß equal to
ß = T/T0
(6)
where T0 is the width of the barrier distribution in units of temperature8. Therefore temperature dependent measurements of ß, the stretching parameter, allow for the direct determination of the width of the potential fluctuations associated with indium allow disorder. Temperature dependent measurements of ß shown in Fig. 7 suggest that the potential fluctuations associated with the disorder are approximately 75 meV, which is much bigger than thermal energy at room temperature (25 meV). This result implies that the excited states are heavily localized in the LED. Furthermore, the magnitude of the potential fluctuations in the super bright LED are much larger than the previously examined 300 A InGaN film, 25 meV6.
110
0.600.55J
CO.
0.500.450.40J
... 300 320 340 360 Temperature °K
Figure 7. The temperature dependence of ß at the PL maximum for the super bright LED
3.6. Importance of piezoelectric fields It is well known that piezoelectric fields are large in nitride semiconductors and can influence optical properties. In a previous study, we examined a series of MQWs with the same physical structure but very different PL spectra and dynamics5. Because the piezoelectric fields are determined by physical structure, the changes in PL spectra were attributed to the dominance of indium alloy fluctuations in our samples. Theoretical calculations suggest that the piezoelectric fields are too small to cause the large PL linewidths in our experiments13. Furthermore, the large PL linewidths in the InGaN LEDs are hard to explain with piezoelectric fields, especially when compared to GaN, where similar piezoelectric fields are expected. In addition we mention that nanometer scale fluctuations in local indium concentration would be expected to produce variations in the local strain, thereby producing random local piezoelectric fields that would be another source of disorder. 4. CONCLUSIONS In summary, we have used TRPL to examine wafers of InGaN LEDs before the final stages of processing. We have found that in the bright and super-bright LED examined, PL lifetimes at room temperature were on the nanosecond timescale. The PL kinetics were strongly dependent upon the emission wavelength and were well described by a stretched exponential. Both observations are strong experimental evidence for the importance of disorder in actual light emitting diodes. An analysis of the data based on this hypothesis confirms the existence and importance of nanometer scale indium alloy fluctuations on the operation of super bright LEDs.
ACKNOWLEDGEMENTS We would like to thank EMCORE Corporation for partial support of this work.
111
REFERENCES 1. S. Nakamura and G. Fasol, The Blue Laser Diode, Springer, New York, 1997. 2. I.-H. Ho and G. B. Stringfellow, "Solid Phase immiscibility in GalnN," Appl. Phys. Lett. 69, pp.2701-2703, 1996. 3. M. D. McCluskey, L.T. Romano, B. T. Krusor, D.P. Bour, N.M. Johnson, and S. Brennan, "Phase separation in InGaN/GaN multiple quantum wells," Appl. Phys. Lett 72, pp. 1730-1732, 1998. 4. M. Pophristic, F. H. Long, C. Tran, I. T. Ferguson, and R. F. Karlicek, Jr., "Time-resolved photoluminescence measurements of InGaN light-emitting diodes," Appl. Phys. Lett. 73, pp.3550-3552, 1998. 5. M. Pophristic, F. H. Long, C. Tran, I. T. Ferguson, and R. F. Karlicek, Jr., "Time-resolved photoluminescence measurements of quantum dots in InGaN multiple quantum wells and light-emitting diodes," J. Appl. Phys. 86, pp.1114-1181,1999. 6. M. Pophristic, F. H. Long, C. Tran, I. T. Ferguson, and R. F. Karlicek, Jr.,"Time-resolved photoluminescence measurements of InGaN light-emitting diodes, films and multiple quantum wells," Proceedings of SPIE 3621, pp.64-72, 1999. 7. M. F. Shlesinger, "Fractal Time in Condensed Matter," Ann. Rev. Phys. Chem. 39, 269-290, 1988. 8. H. Scher, M. F. Shlesinger, and J. T. Bendler, "Time-scale invariance in transport and relaxation," Phys. Today 44,pp.26-34, 1991. 9. A. Vertikov, I. Ozden, and A. V. Nurmikko, "Diffusion and relaxation of excess carriers in InGaN quantum wells in localized versus extended states," J. Appl. Phys. 86, 4697-4699, 1999. 10. T. Y. Lin, J. C. Fan, and Y. F. Chen, "Effects of alloy potential fluctuations in InGaN epitaxial films," Semiconductor Science & Technology 14, pp.406-411, 1999. U.S. Sawada, N. Hamada, and N. Ookubo, "Mechanisms of visible photoluminescence in porous silicon," Phys. Rev. B 49, pp. 5239-5245, 1994. 12. J. C. Vial, A. Bsiesy, F. Gaspard, R. Herino, M. Ligeon, F. Muller, R. Romestain, and R. M. Macfarlane, "Mechanisms of visible-light emission from electro-oxidated porous silicon," Phys. Rev. B 45, pp. 14171-14176, 1992. 13. A. N. Cartwright,/V7'vate communication.
112
Optical properties of AIN/sapphire grown at high and low temperatures studied by variable angle spectroscopic ellipsometry and micro Raman scattering C. H. Yana, H. Yao*a, A. C. Abareb, S. P. Denbaarsb, J. J. Klaassenc, M. F. Rosamond0, P. P. Chowc, J. M. Zavadad aUniversity of Nebraska, Center for Microelectronic and Optical Material Research, and Department of Electrical Engineering, Lincoln, NE 68588 ^University of California at Santa Babara, CA C
SVT Associates, Eden Prairie, MN dlJS Army European Research Office, London, UK
ABSTRACT Variable angle spectroscopic ellipsometry (VASE) and micro Raman scattering have been employed to study the optical anisotropy and optical constants of A1N films grown at high and low temperatures (HT and LT). The A1N films were grown by metalorganic vapor phase epitaxy (MOVPE) and molecular beam epitaxy (MBE) on c-plane sapphire (a-Al203) substrates, respectively. Anisotropie optical phonon spectra of A1N have been measured along two directions so that the optical axis of A1N is either perpendicular or parallel to the polarization of the incident beam. Nonzero off-diagonal elements Aps and Asp of Jones matrix in the reflection VASE (RVASE) measurements indicate that the of A1N is slightly away from surface normal due to substrate miscut. The ordinary optical constants of both HT A1N have been determined spectroscopic ellipsometry at small angles of incidence so that the extraordinary response is greatly reduced. The film thickness along with the surface overlayer was determined via the VASE data analysis as well. Keywords: A1N, sapphire, Raman scattering, spectroscopic ellipsometry, optical anisotropy, optical constants. 1.
INTRODUCTION
The wide band gap A1N along with GaN and InN, are the important building blocks for both high temperature electronic devices and short wave-length optical emitters.1'2 A1N films grown on c-plane sapphire usually have wurtzite crystal structure (a-AIN), which is anisotropic (uniaxial). There are some valuable optical property studies have been carried out on textured3 and single crystal' A1N films by various kinds of techniques. For instance, prism-coupling3,4 can give very accurate values of reflective index at several discrete wavelengths but lacks spectroscopic information. Transmittance and reflectance5can obtain spectroscopic data but do not have enough sensitivity on surface overlayer since it does not contain the phase information. Ellipsometry, on the other hand, is an ideal choice for measuring the spectroscopic optical constants and structural parameters of thin films, especially when the films have interface or surface roughness. In this work, the ordinary optical constants of both HT and LT A1N thin films were accurately determined by transmission variable angle spectroscopic ellipsometry (TVASE) and reflection VASE (RVASE). The extraordinary optical response from the uniaxial A1N films was greatly reduced by using small angle of incidence. Small angle of incidence is also good for minimizing the error caused by the substrate miscut that can result in non-zero off-diagonal elements of Jones matrix. Surface and interface roughness were carefully considered in the VASE model analysis using the effective medium approximation (EMA).6 Correspondence: Email:
[email protected]; Telephone: 402-472-5914; Fax: 402-472-4732
In Light-Emitting Diodes: Research, Manufacturing, and Applications IV, H. Walter Yao, Ian T. Ferguson, E. Fred Schubert, Editors, Proceedings of SPIE Vol. 3938 (2000) • 0277-786X/00/$15.00
113
2.
Theory
2.1 Raman Scattering The irreducible representation of Wurtize A1N optical phonons is:
T = A1(z) + 2B1 + E1(x,y) + 2E2,
(1)
for phonon propagating along or perpendicular to the optical axis . Where x, y, z in parentheses represents the directions of phonon polarization. A] and E[ modes are polar modes and each split into a propagation-parallel longitudinal optical (LO) and a propagation-perpendicular transverse optical (TO) mode. The A] and E\ modes are both Raman and infrared active, two E2 modes are only Raman active, and Bj modes are both Raman and IR silent. Therefore, there are total six active Raman phonon modes in the A1N crystal. 2.2 Generalized Ellipsometry The variable angle spectroscopic ellipsometry is designed to accurately determine the values of two standard ellipsometry parameters i|/ and A, which are related to the complex ratio of reflection (or transmission) coefficients for light polarized parallel (p) and perpendicular (s) to the plane of incidence.8 For isotropic material systems,
p = -£ = tan(y/)e'A
(2)
The electric-field reflection coefficient at an incident angle of is defined as rp (rs) for p (s)- polarized light. They are the diagonal elements of Jones matrix.
m.
sample
rv
0
0
rc
(3)
The \\i and A are not only dependent on dielectric functions, also on the surface condition, sample structure, and other properties such as the optical anisotropy. Generalized ellipsometry was first introduced by Azzam and Bashara.9 The recent developments makes this technique more complete and powerful.10'" In a word, the Generalized ellipsometry is a technique which can be used to determined all the elements of Jones matrix of arbitrarily anisotropic and homogeneous layered systems with nonscalar dielectric susceptibilities. For the anisotropic material system, the non-diagonal elements of Jones matrix are not necessary to be zero. In the reflection VASE configuration,
[/] sample
r
r
r
r
pp ps
sp
(4)
ss
By using the same approach with considerably more algebra involved, we can still predict the \j/ and A values, but the Fourier coefficients related to \|/ and A become more complicated.12 The generalized ellipsometric parameters are defined as below.
114
An£=^ = tan^£efA"£ r ss
(5)
Aps=-^ = tany/vse Ps r VV
(6)
'sp
iA = tanySfre sp
(7) 'ss where the Aps and Asp describe how much amount p- or s-polarized light becomes s- or p-polarized light after the reflection, respectively. If the optical axis is strictly perpendicular (perfect c-plane situation) to the electric field of the incident beam, the Jones matrix is stricctly diagonal. While it may not true for real A1N films grown on nominal c-plane sapphire substrates since the substrates are usually miscut within 1°. The off-diagonal elements Aps and Asp are dependent on sample positions, angles of incidence.
ASp -
3.
Experiments
The Raman spectra were taken at room temperature with a SPEX 1877E triple spectrometer equipped with a liquid-nitrogen cooled CCD camera. The excitation light source was the Coherent Innova 300 Ar+ laser operating at 488 nm with the output power kept at 150 mW. A back scattering geometry was employed for all the Raman measurements. Two identical thin A1N films (about 130 nm thick) were grown at high temperature (1070°C) side by side by MOVPE on two c-plane sapphire substrates with polished and unpolished backsides to serve the transmission type and reflection type VASE measurements. About 20 nm thick LT (525°C) GaN nucleation layers were deposited before the HT A1N growth. Another two films were grown by MBE at high (800°C) and low (400°C) temperatures with different thickness, respectively. The very thin (-36 nm) LT A1N film was grown on a one-side polished c-plane sapphire. The thickness of the MBE grown HT A1N film is about lum. Both isotropic and anisotropic mode VASE measurements were performed in the energy range of 0.75eV to 6.5 eV with a 0.02 eV increment at room temperature. The range of angle of incidence is from 20° to 80° for reflection VASE, and 0° to 30° for transmission VASE. 4.
Results and discussion
4.1. Optical phonons of A1N films Raman scattering is a nondestructive technique used to detect the lattice vibration modes related with crystal orientation and symmetry. A series of Raman scattering measurements have been carried out on various kinds of A1N samples. The optical phonon spectra of a lum thick A1N film grown on c-plane sapphire at back-scattering geometry Z(Y, Y + X)Z are shown in Fig. 1(a). The solid line was obtained from the front surface, in which the optical axis of A1N (and sapphire substrate) is perpendicular to the incident polarization (Y). Three A1N related optical phonon were observed under such condition including 656 cm"1 E2 (high), 888 cm"1 Ai (LO), and a 246 cm"1 E2 (low) which is not shown in this figure. The other two phonons of 577 cm"1 Eg (LO) and 750 cm"1 Eg (LO) are due to the sapphire substrate. The dash line in Fig. 1(a) was obtained from the side cross-section surface in which the A1N optical axis is parallel to the polarization of the incident laser beam. There are three new phonons appeared, 612 cm"' Al (TO), 670 cm"1 El (TO), and 909 cm"1 El (LO). All the above six optical phonons measured from A1N film are in good agreement with the theoretical calculation based on the rigidion model.13 The comparison is listed in Table 1. Fig. 1 (b) is a phonon line-width comparison of HT and LT A1N films. The solid line represents the thin LT A1N (36 nm) grown by MBE; the dash line represents the thin HT A1N (130 nm) grown by MOVPE. The broadening of A1N E2 (high) may be due to the high-density structural defects (such as group HI vacancies) in LT material and the misfit dislocations due to the large lattice mismatch. It is observable that the A1N E2 (high) in both thinner films moves to lower frequency comparing with the A1N E2 (high) in Fig. 1 (a). This may be caused by the partial strain relaxation in stead of full relaxation in a thin lattice-mismatched film even for a thickness of 130 nm. Table 1. Zone-center optical phonons in wurtzite A1N, in cm"1. Mode Theory This work
A, (LO) 885 •
888
A, (TO)
E, (LO)
E, (TO)
E2 (low)
E2(high)
614 612
923 909
668 670
252 246
660 656
115
—I (a)
1
1
"i
r
612A1(TO) AIN 670 E1 (TO)
3
sapphire Focus on surface, ±E Focus on cross-section, ||E
'55 c
656 E2 high
909E1(LO) 577 Eg(LO) JV_ j
500
888A1(LO)
I
600
700
800
900
1000
-1,
Raman Shift (cm ) (b)
3 >» *•>
'55 c 0)
-v^i •*»'
■AIN(LT)/Sapphire ■ AIN(HT)/GaN(LT)/Sapphire .
500
600
I
700 800 1 Raman Shift (cm" )
.
900
Fig. 1. Optical phonons of HT and LT AIN films, (a) 1 \im thick MBE grown HT AIN film on c-plane sapphire substrate. Solid line and dash line represent that is perpendicular and parallel to the incident polarization E, respectively, (b) HT and LT thin MOVPE grown AIN films on c-plane sapphire substrates. Solid line represents 36 nm thick LT AIN film; dash line represents 130 nm thick HT AIN film.
116
4.2. VASE data analysis For ideal c-plane samples, its off-diagonal element of Jones matrix must be zero as we pointed out in the theory part. But for real nominal c-plane samples, since there is a small miscut (usually within 1°) on the substrate, the off-diagonal elements
60
1
1
i
.
|
i
|
i
1
i
■
1
i
-
(a)
-
i i
-QT
■ ■ ■ ■
Exp AnE 60° - - - Exp Aps 60° - - - Exp Asp 60°
40
D) 0
0
if1 i'
~
i)1
i»
5H 20[--
\ >' fwZ
-
\ '• / i
i
- -1— - —U — Yi- \
\V/ 1
\i \ n
—1-—■'.'V^Jil.—..L
-
i iifi ,W"' V
'>w'l'W '
Photon Energy (eV) 60 (b)
Exp AnE at 5.48 eV Exp AnE at 2.40 eV Exp Aps at 5.48 eV Exp Aps at 2.40 eV Exp Asp at 5.48 eV
Angle of incidence (degree) Fig. 3. Anisotropie mode RVASE data of HT AIN/c-sapphire grown by MOVPE. (a) 4* as a function of photon energy at 60° angle of incidence; (b) ¥ as a function of incident angle at 2.40 and 5.48 eV.
117
may not vanish completely, as shown in Fig. 2. Fig. 2 (a) is an anisotropic mode RVASE data obtained from a 130 nm MOVPE grown AIN/c-sapphire sample. It was taken at 60° angle of incidence, which is near the pseudo Brewster angle. It can be seen clearly that the off-diagonal elements Aps and Asp are not negligible. The incident angular dependent measurements were made at certain wavelengths (1.4 and 5.48 eV), as shown in Fig. 1 (b). The angular increment was lc. The off-diagonal elements are detectable in the angle range of 50° to 70°, but they are negligible at the angle of incidence below 40° or above 80°. Therefore, small angle of incidence (0_
(a) HTAIN
7.0
• K-K Model Fit Exp Data
cT
6.05.0I
I
I
I
^—h-+-
i
(b) LT AIN
6.0
• K-K Model Fit Exp Data
u
5.0-
4.0
2
3
4
5
Photon Energy (eV) Fig. 7. Kramers-Kronig consistency check AIN dielectric functions, (a) HT AIN; (b) LT AIN. Table 2. K-K fitting parameters for HT and LT AIN dielectric functions. Fitting Parameters Pole (HT AIN) Pole (LT AIN)
122
E, 7.87 eV 7.76 eV
A, 17.27 13.23
_ offset
2.29 2.17
5.
Summary
The optical anisotropy nature of A1N films grown on c-plane sapphire substrates was revealed by Raman scattering and generalized variable angle spectroscopic ellipsometry. Optical phonons measured from a 1 (im thick HT A1N agrees very well with the theoretical prediction. Optical constants of HT and LT A1N are determined by TVASE and RVASE along with the structure parameters. The broadening in E2 phonon and long absorption tail indicate that LT A1N has very high defect density due to low temperature growth and large lattice-mismatch. Acknowledgments This work was supported by US Army Research Office under contract No. DAAG55-98-1-0462. References 1.
H. Morkoc, S. Strite, G. B. Gao, M. E. Lin, B. Sverdlov, and M, Burns, "Large-band-gap SiC, III-V nitride, and II-VI ZnSe-based semiconductor device technologies," J. Appl. Phys. 76, pp. 1363-1398, 1994. 2. S. Nakamura, T. Mukai, and M. Senoh, "Candela-class high-brightness InGaN/AlGaN double-heterostructure bluelight-emitting diodes," Appl. Phys. Lett. 64, pp. 1687-1679, 1994. 3. E. Dogheche, D. Remiens, A. Boudrioua, and J. C. Loulergue, "Growth and opticalcharacterization of aluminum nitride thin films deposited on silicon by radio-frequency sputtering," Appl. Phys. Lett. 74, pp. 1209-1211, 1999. 4. X. Tang, Y. Yuan, K. Wongchotigul, and M. G. Spencer, "Dispersion properties of aluminum nitride as measured by an optical waveguide technique,"^/. Phys. Lett. 70, pp. 3206-3208, 1997.. 5. J. F. Muth, J. D. Brown, M. A. L. Johnson, Z. Yu, R. M. Kolbas, J. W. Cook Jr., and, J. F. Schetzina, "Absorption coefficient and reflective index of GaN, A1N, and AlGaN alloys," MRS Internet J. Nitride Semicond. Res., 4SI, G5.2 1999. 6. D. E. Aspnes, J. B. Theeten, and F. Hottier, "Investigation of effective-medium models of microscopic surface roughness by spectroscopic ellipsometry", Phys. Rev. B 20,3292, 1979. 7. T. Azuhata, T. Sota, K. Suzuki and S. Nakamura, "Polarized Raman spectra in GaN," J. Phys.: Condens. Matter 7, pp. L129-L133, 1995. 8. R. M. A. Azzam and N. M. Bashara, Ellipsometry and Polarized Light, North-Holland, Amsterdam, 1977. 9. R. M. A. Azzam, and N. M. Bashara, "Generalized ellipsometry for surface with directional preference: application to diffraction gratings," J. Opt. Soc. Am. 62, pp. 1521-1523, 1972. 10. D. W. Berreman, "Optics in stratified and anisotropic media: 4x4 matrix formulation," J. Opt. Soc. Am. 62, pp. 502510, 1972. U.M. Schubert, "Polarization dependent parameters of arbitrarily anisotropic homogeneous layered systems," Phys. Rev. B, 53, pp. 4265-4274, 1996. 12. M. Schubert, B. Rheinlander, J. A. Woollam, B. Johs, and C. M. Herzinger, "Extension of rotating analyzer ellipsometry to generalized ellipsometry: determination of the dielectric function tensor from uniaxial Ti02,"J. Opt. Soc. Am. A13, pp. 875-883, 1996. 13. G. H. Wei, J. Zi, K. M. Zhang, X. D. Xie, "Zone-center optical phonons in wurtzite GaN and A1N," J. Appl. Phys. 82, pp. 4693-4695, 1997. 14. C. H. Yan, H. Yao, J. M. Van Hove, A. M. Wowchak, P. P. Chow, and J. M. Zavada, "Ordinary Optical Dielectric Functions of Anisotropic Hexagonal GaN Film Determined by Variable Angle Spectroscopic Ellipsometry," to be published. 15. C. M. Herzinger, B. Johs, U.S. Patent 5,796,983, issued Aug 18, 1998. 16. G. A. Slack and T. F. McNELLY, "Growth of high purity A1N crystals", J. Cryst. Growth, 34, pp. 263-279, 1976. 17. H, Yao, B. Johs, and R. B. James, "Optical anisotropic-dielectric response of mercuric iodide", Phys. Rev. B, 56, 9414 9421, 1997.
123
The Novel Processing for Improving Optical Property of InGaN/GaN MQW Light Emitting Diode C. H. Huang3, K. Y. Hsieha, H. S. Hwungb, L. W. Tuc institute of Materials Science and Engineering, National Sun Yat-sen University, Kaohsiung, Taiwan b
Military Academy, Kaohsiung, Taiwan
c
Dept. Of Physics, National Sun Yat-sen University, Kaohsiung, Taiwan
ABSTRACT The optical property and microstructure of InGaN/GaN MQW before and after annealed has been investigated by using photoluminescence (PL) and Transmission Electron Microscope (TEM) technique. The photoluminescence intensity of InGaN/GaN MQW LED annealed within A1N powder can be enhanced by 5 times compared with the as-grown one. The diffused Al converted the InGaN/GaN into AlGaN/InGaN. Less dislocation density in the annealed film and more carrier collection ability due to the band gap difference between InGaN/GaN and InGaN/AlGaN can be applied to explain the astonished result. This simple process can improve the optical property of GaN/InGaN QW LED without spending heavy cost in thin film growth. Keywords: GaN, InGaN, quantum well, photoluminescence, diffusion* annealing
1. INTRODUCTION Recently, group-IH nitride compound semiconductors have attracted much attention due to its large direct band gap range from 1.9eV(InN)' to 6.2eV(AlN)2 . The emitted luminescence wavelength for these compound semiconductor is between red to violet spectral region. Thus this unique physical property has provided a widely application in optical and electrical devices such as full-color LED displays or high power, high temperature transistor.
In 1994 Nakamura announced the first
3
high brightness blue GaN based LED .since then the enormous fund and colossal research activity are tracked and move forward very fast. Since the LED has a longer lifetime, high efficiency, less energy needed. It is expected that the daylight lamp will be replaced by LED in the near future. In the early research, it is difficult to find out a suitable substrate to grow GaN. Sapphire (A1203) is the most common substrate. It have 16% lattice constant mismatch with GaN4. Such a large mismatch causes the stresses existed in the interface layer resulted
in
a high density dislocation in GaN layer. Several researchers try to grow buffer layer with A1N5
and GaN6 on sapphire in order to reduce the density of the dislocation , however the high density dislocation still can not avoid. Kato et al. developed using ELOG method to limit the dislocation in some area and get better quality in selective area7. It is reported that the intensity of the blue LED is not directly related with the density dislocation, but the life time of the LED will be affected with the dislocation density 8. In this paper, we report a simple process to enhance the optical property of InGaN/GaN LED without spending too much effort on sample growth. Even the low quality of the GaN films Email:
[email protected]; Telephone: 886-7-525-2000 ext 4066; Fax: 886-7-525-4099
124
In Light-Emitting Diodes: Research, Manufacturing, and Applications IV, H. Walter Yao, Ian T. Ferguson, E. Fred Schubert, Editors, Proceedings of SPIE Vol. 3938 (2000) • 0277-786X/00/$15.00
still can be improved after post annealed. The experiment results show that the optical property can be improved 5 times compared with the sample without annealed process.
2. EXPERIMENT The sample used in this study was grown on a (0001) oriented sapphire (A1203) substrate by metalorganic chemical vapor deposition (MOCVD) technique. The structure of these samples consist of 4 urn thick GaN buffer layer, 5 pairs of InGaN/GaN MOW and a 0.5 urn GaN cap layer. Two different In content were choosen. One is around 17% the other is 30%. The thermal process was performed in cleaned and etched quartz ampoules (approximately 3.5-4 cm3), evacuated to 10'6 Torr, under different ambients (Ga, A1N, or no-overpressure), where sufficient gallium(5mg) or AlN(5mg) was included to provide an excess overpressure of Column III or column V atoms. The annealing temperatures ranged from 750-950°C and the annealing time was fixed at four hours. Spontaneous emission under various excitation energy densities were measured at 300K under the excitation of a continuous wave He-Cd laser (325nm). In order to compare the relative intensity of each set experiment, the as-grown sample is measured first and then the system operating parameters will be maintained to continue the following measurement. The specimen for cross-sectional microanalysis was prepared by mechanical thinning and ion milling with Ar+ at 77K. Bright field images were observed using a TEM (Jeol 200CX) operated at 200Kev. EDX measurements were performed with high resolution TEM (Jeol 3010) operated at 300KeV.
3. RESULTS AND DISCUSS Figure 1 shows a PL spectra(300K) form a InGaN/GaN MQW before and after thermal annealing with different annealing temperature in a no overpressure environment. The oscillation interference of the photoluminescence curves is due to the roughness of the sample surface. The main PL peak of the as-grown sample is located at 475nm. It was found that the peak was shifted to 460 ran (blue shift) after 750 C annealed process. The higher temperature annealed the more shift of the main peak.
The intensity of the PL was reduced with increasing annealing temperature. The blue shift of the PL can be
explained with the interdiffusion of group III (Ga and In) took place after thermal annealed in the quantum well region. The lower In content in the well, the shorter photoluminescence wavelength was emitted. The degraded intensity of the PL spectrum is due to the degraded crystal quality which was damage without any cap layer protection during thermal process. The column V atoms can easily leave away the surface and create more nonradiation recombination center.
Figure 2
shows another PL spectra from the same InGaN/GaN sample with different annealing temperature. However, this time the annealing environment was changed in a gallium over pressure condition. The blue shift was occurred again. The intensity of the PL spectrum was also reduced with increasing annealing temperature. Compared with figurel and figure 2, it was found that the displacement of the PL peak energy was retarded when the annealing environment was in the gallium overpressure. The similar results have been reported in GaAs/AlGaAs system9. The Column III vacancies played a important role. The concentration of the column III vacancy affected the interdiffusion coefficient of the column III atom in the well. The more column III vacancies generated from the surface the quick interdiffusion of the column III occurred10. In a gallium overpressure condition, the concentration of the column III vacancy is less than that with no over pressure
125
condition. Therefore, it can be expected that the blue shift of the PL peak will has less extent when the annealing process was performed in a gallium overpressure condition. Figure 3 displays a stack PL spectrum that emitted from a InGaN/GaN MQW after in a A1N annealing environment for different annealing temperature. This figure shows the total different result compared with the previous figures. Firstly, the main peak of each PL spectra did stay in the same position. Secondly, the intensity of PL for high temperature annealing at 850°C was increased 5 times compared with the as gown one. The annealing process enhanced the optical property dramatically. In order to reveal this unusual result, the structure analysis and the EDX measurement were performed by cross-sectional TEM.
Figure 4 and figure 5 show the 0002 bright field images of the LD structure which were a as-grown
one and a thermal annealing under A1N condition respectively. Both of these micrograph were taken from the [0 1 10] crystal axis. Apparently, the density of dislocation shown in the figure 4 is higher than those in the figure 5. It indicated that the number of the dislocation can be reduced after the thermal process applied. The dislocation in the sample that annealed with A1N power became to merge together. It is well known that the dislocation is one kind of defects. It can play as a nonradiation center. The less dislocation existed, the more carriers can be applied in a radiation process. The decrease of the number of the dislocation would be one of the reasons to explain why the intensity of the PL emitted from the InGaN/GaN MQW can be improved after high temperature annealed with a A1N powder. The other reason for explaining the enhancement of the PL intensity is that the A1N molecular was broken into Al and N atoms due to the thermal energy and then the Al atom diffused into the quantum well. This action converted the InGaN/GaN into InGaN/AlGaN. According to the previous report, the energy bang gap of the InGaN and AlGaN can be written as11,12 E
gJn,Ga,.JN (*) =
xE
g,InN
+ 0- ~ X)Eg ,GaN ~ bX(l ~ *)
E
g.MIGal.,N (y) = y£s,MN+(* - y)Eg ,GaN - tyQ- - y)
The band gap discontinuities of the InGaN/GaN and the InGaN/AlGaN is quite different. Before the thermal process, the band gap difference was decided by GaN and InGaN. Once the Al diffused through the interface of the InGaN/GaN. The GaN could be added some Al and changed into AlGaN. Small amount of Al can cause the band gap difference have a big change. It is noted that the LED structure consisted of 5 pairs InGaN/GaN MQW sandwiched by two GaN layers. These two GaN layers have the functions of the optical confinement and the carrier collection. The larger band gap difference between the well and the barrier existed, the more superior optical property appeared. In this case, the original barrier layer of this LED structure is GaN. After the annealing, the barrier is changed into AlGaN. The increase of the band gap discontinuities enhanced the ability of the optical property of this LED. In order to identify the Al atom was indeed diffused into the LED layers. EDX measurement for Al atomic percentage was applied. Seven points have been measured. There were two points located in the cap layer region, three points were probed in the multiple quantum well region and the other two points were shot in the GaN buffer layer. The result was shown in the Table 1. From the Table 1, it was found that the aluminum atom distributed uniformly all over the layer and the atomic percentage is around 12. The In atom was not detected in the buffer layer. Most of the In atoms stayed inside the quantum well. This indicated that the In had not out diffusion at all. It is very common that there will be a impurity concentration gradient existed if any impurity diffusion process is applied. However, in this experiment the aluminum distribution is very uniform. There is no concentration difference. The aluminum diffused
126
into the sample through the dislocation will be the better explanation for the results. In order to make sure that the experiment of the enhancement of the PL intensity emitted from InGaN/GaN MQW under A1N powder annealed can be repeated. Another LED sample that has the same structure but with diffenent In content(30%) in the well was employed. The result is shown in the figure 6. The optimum annealing temperature for this sample was at 900°C. The intensity of the PL peak is twice larger than that as-grown sample. Although the factor of intensity increase is not as large as the previous result, the behavior of PL intensity enhancement is very consistent. When the annealing temperature reached at 950"C, the PL intensity decreased. It is due to the degraded crystal after thermal process.
4. CONCLUSION The optical property and microstructure of InGaN/GaN MQW before and after annealed has been investigated by using photoluminescence (PL) and Transmission Electron Microscope (TEM) technique. The photoluminescence intensity of InGaN/GaN MQW LED annealed within A1N powder can be enhanced by 5 times compared with the as-grown one. The diffused Al converted the InGaN/GaN into AlGaN/InGaN. Less dislocation density in the annealed film and more carrier collection ability due to the band gap difference between InGaN/GaN and InGaN/AlGaN can be applied to explain the astonished result. This simple process can improve the optical property of GaN/InGaN QW LED without spending heavy cost in thin film growth.
REFERENCE 1.
Yuichi Sato, and Susumu Sato, "Growth and some properties of InxGa,.xN thin films by reactive evaporation," Thin Solid Films 261, pp. 87-89, 1995.
2.
J. Siwiec, A. Sokolowska, A. Olszyna, R. Dwilinski, M. Kaminska and, J. Konwerska-Hrabowska, "Photoluminescence properties of nanocrystalline, wide band gap nitrides (C3N4, BN, A1N, GaN)," NanoStructured Materials 10, pp. 625-634,1998.
3.
Shuji Nakamura, Takashi Mukai, and Masayuki Senoh, "Candela-class high-brightness InGaN/AlGaN doubleheterostructure blue-light-emitting diodes," Applied Physics Letters 64, pp. 1687-1689,1994.
4.
William A. Melton and, Jacques I. Pankove, "GaN growth on sapphire," J. Crystal Growth 178, pp. 168-173,1997.
5.
H. Amano, N. Sawaki, and I. Akasaki, "Metalorganic vapor phase epitaxial growth of a high quality GaN film using an A1N buffer layer," Applied Physics Letters 48, pp. 353-355,1986.
6.
S. Nakamura, Y. Harada, and M. Senoh, "Novel metalorganic chemical vapor deposition system for GaN growth," Applied Physics Letters 58, pp. 2021-2023,1991.
7.
Y. Kato, S. Kitamura, K. Hiramatsu, and N. Sawaki, "Selective growth of wurzite GaN and ALGa,.xN on GaN/sapphire substrates by metalorganic vapor phase epitaxy," J. Crystal Growth 144, pp. 133-140,1994.
8.
P. Kozodoy, J. P. lbbetson, H. Marchang, P. T. Fini, S. Keller, J. S. Speck, S. P. DenBaars, and U. K. Mishra, "Electrical characterization of GaN p-n junctions with and without threading dislocations," Applied Physics Letters 73, pp.975-977,1998.
127
9.
R. M. Kolbas, Y. L. Hwang, T. Zhang, M. Prairie, K. Y. Hsieh. And U. K. Mishra, "Enhanced suppressed interdifrusion of lattice-matched and pseudomorphic HI-V heterostructures by controlling Ga vacancies," Optical and Quantum Electronics 23, pp. s805-s812, 1991.
10.
Michael C. Y. Chan, Elaine M. T. Cheung, and E. Herbert. Li, "A tunable blue light emission of InGaN/GaN quantum well through thermal interdifrusion," Material Science and Engineering B59, pp. 283-287, 1999.
11.
Shuji Nakamura, "III-V nitride-based light-emitting diodes," Diamond and Related Materials 5, pp. 496-500, 1996.
12.
H. Wang, G. A. Farias, and V. N. Freire, "Graded interface effects on the carriers confinement in single GaN/AlxGa,. XN
wurtzite quantum wells," Solid State Communications 110, pp. 587-592,1999.
Energy (eV)
350
375
400
425
450
475
500
525
550
575
600
Wavelength (nm)
Figure 1 Photoluminescence spectra (300K) from an InGaN/GaN.multiple quantum well before and after thermal annealing at different annealing temperature (750, 800, 850°C) for 4 hours in a no overpressure enviroment.
Energy (eV) 3.4 _l
3.2 I
3.0 I
2.8 I
2.6 1
2.4 I
2.2 L_
Standard +Ga 750C degree +Ga 800C degree +Ga 850C degree
-V 500000 3
-5£ 400000 'w
c
B £
300000
8C 8
200000
350
375
400
425
450
475
500
525
550
575
600
Wavelength (nm)
Figure 2. Photoluminescence spectra (300K) from an InGaN/GaN.multiple quantum well before and after thermal annealing at different annealing temperature (750, 800, 850°C) for 4 hours in a gallium overpressure environment.
128
Energy (eV) 3.2
3.0
2.8
2.6
2.4
— ... — ...
450
2.2
Standard +AIN 750C degree +AIN 800C degree +AIN 850C degree
500
Wavelength (nm)
Figure 3
Photoluminescence spectra (300K) from an InGaN/GaN.multiple quantum wells before and after thermal annealing at different
annealing temperature (750, 800, 850°C) for 4 hours in a Al and N atom rich environment. It is noted that the PL intensity increased 5 times for annealing at 850°C compared with that the as gown one sample.
Energy (eV) 3.0
2.8
2.6
# 30000
20000
450
500
Wavelength (nm)
Figure 6 Photoluminescence spectra (300K) from an InGaN/GaN.multiple quantum wells before and after thermal annealing at different annealing temperature (750, 800, 850°C) for 4 hours in A1N annealing environment. The In content in this sample is larger than the previous sample.
129
Figure 4 Cross-sectional TEM micrograph of a GaN-capped InGaN/GaN MQW. High density of the dislocation was observed.
Figure 5. Cross-sectional TEM micrograph of InGaN/GaN MQW annealed with A1N powder at 850°C. The number of dislocation has been reduced. Several dislocations merged together and became a thick dislocation.line.
Table 1 The compositional variation of the InGaN/GaN MQW after 850°C annealed in a A1N rich environment. The aluminum content is uniformly distributed.
EDX point location Point 1 (cap layer) Point2 (cap layer) Point3 (MQW) Point4 (MQW) Point5 (MQW) Point6 (GaN buffer) Point7 (GaN buffer)
130
Al atom. % 12.08 12.31 12.02 11.85 11.92 12.27 12.49
Ga atom.% 88.22 87.55 87.84 87.59 87.21 87.92 87.56
In atom.% -0.30 0.14 0.15 0.55 0.87 -0.19 0.05
Optical Properties of InN Thin Films Vladislav Ya. Malakhov Dept. of Functional Electronics Materials, Institute for Problems of Materials Science, 03142 Kiev
ABSTRACT The basic optical properties of low temperature plasma enhanced chemical reactionary sputtered (PECRS) InN thin films are presented. Optical absorption and reflectance spectra of InN polycrystalline films at room temperature in visible and near infrared (NIR) regions were taken to determine direct band gap energy (2.03 eV), electron plasma resonances energy (0.6 eV), damping constant (0.18 eV), and optical effective mass of electrons (0.11). In addition the UV and visible reflectance spectra have been used to reproduce accurately dielectric function of wurtzite InN for assignments of the peak structures to interband transitions (1.5-12.0 eV) as well as to determine dielectric constant (9.3) and refractive index (>3.0). The revealed reflectance peaks at 485 and 590 cm"1 respectively in IR spectra are connected with TO and LO optical vibration modes of InN films. Some TO (485 cm"1) and LO (585 cm"1) phonon features of indium nitride polycrystalline films on ceramics were observed in Raman spectra and also discussed. The excellent possibilities of InN polycrystalline layers for potential application in optoelectronic devices such as LEDs based InGaAIN and high efficiency solar cells are comfirmed. Keywords: InN polycrystalline films, optical properties, solar cells 1. INTRODUCTION Escalating interest in recent 10 years to III group nitride semiconductors with direct band gaps (> 6.0 - 2.0 eV) reflects their potential application in photonic devices such as LEDs, lasers, full colour displays, and high efficiency solar cells1"6. The extensive utilization of InGaAIN film compositions as active layers in high performance photonic devices has faciliated these accomplishment due to its tunability of the energy band gap covering the visible to near UV light spectrum. Optical properties of InN thin films obtained by different methods have been studied in numerous works8' 10"2j including ones of the author. However some optical and electric parameters such as dielectric and optical constants, energy gap, effective mass of carriers as well as phonon wavenumbers await for further more accurate definition. A lack of single crystalline, stoichiometric samples explains the situation around mentioned above data. Any structural and thermal properies of InN have not been studied for epitaxial films on lattice-matched substrates. The development of advanced growth techniques (e.g. MOCVD, PIMBE or PLD)1' 6' 16 have resulted in promissing improvements in the structural, electrical and optical properties. For this reason presented paper demonstrates some original optical data obtained for InN thin polycrystalline films synthesized earlier and nowadays by low temperature plasma enhanced chemical reactionary synthesis (PECRS) technique. 2. EXPERIMENTAL DETAILS Since a dissociation temperature of InN is about 650 °C7 therefore a low temperature growth technique is required. In our case the PECRS system to synthesize InN thin films was used8. Intensive Ti-wire evaporation used as getter was carried out during all the time of deposition process to reduce oxygen contamination inside of reactor as well as in growing films. High quality smooth surfaces of Si, quartz, fluorite and compound ceramics were used as substrates. In the time of films growth substrates temperature was about 320 °C due to intensive ion bombardment of a top electrode (anode) during sputtering process. The surface morphology including a microstructure of cross-section of the films were investigated by Philips SEM5V scanning electron microscope and by AFM as well. The film thickness was changing in the range 1001600 nm and was measured by means of optical microscope-interferometer as well as by estimation of fractured edge dimension in SEM cross-section image. Auger spectrometer JAMP-10 was used to determine chemical composition of sputtered InN films. The crystalline structure parameters of obtained films were determined using of X-ray diffractometer
In Light-Emitting Diodes: Research, Manufacturing, and Applications IV, H. Walter Yao, Ian T. Ferguson, E. Fred Schubert, Editors, Proceedings of SPIE Vol. 3938 (2000) • 0277-786X/00/$15.00
131
DRON-3 employing Cu(K„) radiation and also by means of standard electronograph EG-100a. The reflectance and transmittance measurements in visible and near infrared (NIR) regions (25000-200 cm"1) have been carried out with help of Bruker IFS66 Fourier transform spectrometer (FTIR) and Carl Zeiss M40 grating spectrometer respectively. The Raman spectrometer Dilor XY equipped with microscope (Olympus BH-6) was used for study of phonon spectra of nitride films. A horizontal and vertical polarisation configuration of the incident and scattered Kr+ laser light (647.1 nm) with power of 20 mW entering the sample surface were used there.
3. RESULTS AND DISCUSSION X-ray diffraction pattern of IriN layer deposited on ceramic substrate demonstrates that several intensive peaks appear there including free In peak and also ones connected with ceramic but most strong diffraction peak corresponding to the InN (002) plane suggests some textured crystalline structure of the films where the c axis is perpendicular to the plane of substrate. Fig. 1 displays of the RHEED investigation of natural surfaces of InN layers deposited on ceramics versus defferent deposition time.
a) b) c) Figure 1: RHEED patterns from wurtzite InN film surfaces synthesized at different deposition time: a) 5 min., b) 8 min., c) 15 min. Some textured structure appears soon there (Fig. lc) and characterizes a structural quality of sputtered InN films. These results testify that any outsider phases except of InN and In ones were found inside films. Therefore most likely explanation of high oxygen concentration presented there is such when some quantity of chemicaly unactive oxygen molecules incorporate to voids between graines as shown in9 and other part of oxygen is probably binded in amorphous indium oxide. The AFM images of natural surface morphology of InN film on ceramics are shown in Fig. 2. Digital Instruments HanoScop*
Scan size Scan rat*
10.00 M" 0.2IS2 Hz
Hiwtbvr of sa«pI*E Inagt Data Data seal»
2SG Hvisht 100.00 n»
NancScop* Tapping AFH Scan siz* 10.00 tin 5*tpoint 1.477 U Scan rat* 0.2501 Hz Nu*b«r or sanpl** 2S6
vi*M angl*
$."«** I
■jjj- light angl*
#
X 2.000 iM/ilw 2 499.993 nit/JIv 1» 574
°
U
*
Figure 2: AFM images of natural surface of InN films synthesized on ceramic substrates at different deposition time : a) 5 min.; b) 10 min. It is clear a surface texture with a pyramidal form of grains which are of dimensions about 400 nm across and 1600 nm in vertical direction respectively.
132
The transmittance spectra in visible spectral range are used to determine the band gap energy of InN thin films on CaF2 (fluorite) substrates. In this procedure the band gap energy can be derived from absorption coefficient a of InN by: a(E) = a0 ■ (E - Eg), E > Eg
(1)
It is clear that the absorption coefficient or the product a-d should be measured or derived most accurately. For a thin film on a substrate this is not as stright forward as it is for a free standing film. In our case we have a highly transparent substrate (fluorite - s) and a highly absorbing layer (InN -1) for the situation of our samples at photon energies larger than the gap energy. Thus an assumption that multireflections will only occur in the substrate holds and the transmittance may be written as the sum of the contributions of this multireflections: T = =
£T • (1-RJ
• CD, ■ (1-Rl!5) • s - KjiS)]. As this is a geometric series eqv. 3 may be written as: T = (1-RO • O, • (1-R,,S) • (1-RS) • 29 (relative)
1.0
Figure 3. HRXRD (004) rocking curves and numerical simulations of SQW and SLS NL device wafers. The SLS sample IC720 is relaxed with respect to the InAs substrate and this precludes a simulation using dynamic diffraction theory. However the observations of 5 orders of satellite diffraction peaks attest the good structural quality of the SLS away from the InAs-SLS interface (where the misfit dislocation density is expected to be high). In conjunction with asymmetric (115) reflections the SLS parameters are determined to be 105 A InAs / 105 A InAs083Sb017, somewhat less than the target alloy composition of InAs0.75Sb0 25, and the emission will occur at wavelengths shorter than the 300K design wavelength of ~8 urn. The SLS is determined to be 70 % relaxed with respect to the InAs substrate. 2.3. Electroluminescence measurements For forward bias electroluminescence measurements 600 urn diameter mesa etched LED's were fabricated using conventional wet-etch photolithography and a Cr/Au annular contact evaporated on the top of each device. The etch was stopped after the QW layer but before the barrier layer in order to protect these Al-containing layers from oxidation. Later experiments indicated that device performance was not sensitive to the etch depth, although no long term trials have been performed to date. Larger area devices were required for negative luminescence measurements on the SLS sample IC720, and this was achieved by cleaving 2x2 mm squares from the wafer after contact evaporation had been performed. The resulting 9x9 array of annular contacts that formed the top contact probably does not represent the optimal geometry for this large area device. No passivation layers or AR coatings were applied to any of the devices studied. Packaged devices were attached to the cold finger of a cryostat for measurements in the range 10-325 K. Current pulses up to 1.5 A, duration 6 us and PRF 20 kHz were used to drive the devices. Luminescence was passed through a BOMEM DA3.02 spectrometer fitted with CaF2 windows and reflecting optics onto either a 77 K CMT Ocutoy= 12 um) photoconductive or 77 K InSb (Ä.cutoff- 5.5 um) photovoltaic detector, depending on the device emission wavelength.
147
Absolute device output powers were determined at room temperature using only the detector (calibrated to a blackbody standard) and no other optics in order to avoid spectrometer losses. Emission was spatially and spectrally integrated and this reference datum used to scale the cryostat spectra. 3. DEVICE RESULTS 3.1. "Barrier"- SQW devices Electroluminescence spectra at 10 K from the SQW devices under low forward bias are shown in Fig. 4. The spectra are dominated by two distinct emission peaks, the lower energy feature we attribute to recombination in the QW and the higher feature at 400-425 meV to recombination in the surrounding InAs region. The lower QW emission energies from the sample IC653 and its control sample IC675 are consistent with greater Sb content in the QW. QW emission from the control sample IC692 (IC675) occurs at an energy some 37 (45) meV lower than the "barrier" sample IC693 (IC653) despite their similar QW parameters. The FWHM of the control samples (IC675, IC692) QW peaks are also much narrower than those observed in the corresponding "barrier" samples (IC653, IC693, IC694), and the overall intensities are over an order of magnitude lower so that broad impurity related luminescence is visible. The above is all consistent with a lower injected electron density in the QW of the control samples compared to the "barrier" samples, indicating that the barrier is effective in confining carriers at these temperatures.
wavelength (urn) 4 T
3
id 3
«5.
Energy (meV)
c
B _c _l
LU !
is-
w
250
300 350 Energy (meV)
400
450
Figure 4. Normalised 10 K low injection spectra for the SQW LED's with Io=100 mA.
300
350 400 Energy (meV)
Figure 5. Electroluminescence spectra (plotted on a semilogarithmic scale) of SQW + AlAsSb "barrier" LED IC653 as a function of injection current at (a) 10 K and (b) 300 K.
As the bias current density is increased the "barrier" samples exhibit further pronounced blue shift and broadening due to band filling in the QW. Fig. 5(a) showing 10 K spectra of IC653 under increasing bias current, demonstrates that this blue shift may be as large as 56 meV (corresponding increase in FWHM from 22 to 70 meV) and shows the QW spectral profile becoming more asymmetric. Near the electron subband edge, the QW joint density-of-states is determined by random local variations in the QW width and/or alloy composition and this yields symmetric spectral profiles. At higher bias currents the
148
electron quasi-Fermi level moves higher into the electron subband and these band edge states no longer dominate the QW spectral profile which becomes more asymmetric as a result. The temperature evolution of the device spectra are studied under high pulsed injection currents (I0=600 mA) found under typical operating conditions, and these are shown in Fig. 6 (a)-(d). The y-axis scaling is identical for each graph so relative emission intensities may be compared. Several initial observations can be made;
200
250 300 350 400 Emission Energy (meV)
450
200
250 300 350 400 Emission Energy (meV)
450
100
150 200 250 300 Emission Energy (meV)
350
200
250 300 350 400 Emission Energy (meV)
450
200
250 300 350 400 Emission Energy (meV)
450
200
250 300 350 400 Emission Energy (meV)
450
Figure 6 (a) -(e). Luminescence spectra from SQW and SLS NL devices as a function of temperature (10-300 K). (a) In all cases electroluminescence (both QW and InAs related) from the "barrier" SQW samples (IC653, IC693 and IC694) is much greater than that from the control samples (IC675, IC692). (b) QW electroluminescence intensity from the "barrier" samples is comparable at all temperatures. Whilst the InAs electroluminescence intensity is also similar for the "barrier" samples near room temperature, at low temperatures IC693 (asymmetric 0.1 um/0.9 um InAs cladding layers) emits significantly less InAs-related luminescence than the other two "barrier" samples (both symmetric 0.5 um/0.5 um InAs cladding layers). (c) For many of the samples the InAs related recombination exhibits a complex temperature dependence typically characterised by a rapid fall as the temperature is initially increased followed by a recovery at higher intermediate temperatures. (d) It is worth noting that electroluminescence from the lattice mismatched SLS device IC720 exhibits only a single peak characteristic of the SLS, and that its intensity is of the same order of magnitude as the QW peaks of the "barrier" devices. It suggests good optical quality in the active region and hence that the p-SLS layer is effective in blocking the propagation of misfit dislocations from the SLS-InAs interface to the undoped SLS active region. The SLS feature has lower FWHM- 23 meV (T=10 K) compared to the "barrier" samples, consistent with an absence of band filling in the 4 um-thick undoped active region.
149
T
i > i ■ i ■ i ■ i
■ i ■ i ■ i ■ i
IrV^s
0
1 I.1 I ■ I ■ I ■ I ' I ' I J
(1)QW Efficiency, r^ " I p InAs Efficiency, TV,™" _ ■as 0J 10 r C c (0 x:
10
irVv
ü
//'^V. ^
▼
•v
c "o
\ (3) SUM Efficiency
V \ V
4
=3
■•
(0 O"
~m E |j 0.1
s*%
--▼-▼
\ S*
-I
+\ X;
;r^
^A-A v
V
v/
H$"
/ ^A..
p*
I I I I I
▼ A
IC653SQW+AIAsSb barrier IC675SCWCONTRa IC692SOA/CCMRa -:
• ■
IC693SCW+lnAlAs barrier IC694SCWV+1nAIAs barrier
X
0.1
:
J_i_
0 50 100150200250300 0 50 100150200250300 0 50 100150200250300 Temperature (K)
Temperature (K)
Temperature (K)
Figure 7. Internal quantum efficiencies per channel (QW and InAs related luminescence) for the SQW LED's as a function of temperature. In order to more fully analyse the interdependence between the 2 principle radiative channels in the SQW devices the internal quantum efficiency (assumed proportional to the carrier recombination rate in each channel) is calculated for each channel. This procedure removes the effect of different photon energies for the 2 emission peaks and peak broadening effects as the temperature is increased. Output power is corrected for the 18 % contact obscuration and we assume an internal to external efficiency ratio of l/n(n+l)2«72, and neglect free carrier re-absorption effects in the top n+ contact layer. A curve fitting procedure is used to separate QW from InAs peaks where they are not separately resolved (typically near room temperature) and the quantum efficiency for each channel (riintQW and r|intInAs) obtained by integrating over these peaks after dividing by photon energy. Results for r)intQW and T)im,nAs and the total (summed) efficiency are shown in Fig. 7. r)intQW for the "barrier" samples IC653, IC693 and IC694 all decrease exponentially with increasing temperature, this behaviour may be somewhat empirically represented by a parameter T0 (where r|(T)=r|(0)exp(-T/T0)) and we have T0(653)= 110 K, T0(693)= 93 K and T0(694)= 72 K. Initially r)intQW for the control samples IC675 and IC692 increases with T, probably as the result of increasing diffusion lengths and thus increasing carrier concentration in the QW (supported by a rapid broadening in the QW emission profile that is characteristic of band filling effects described earlier). Thereafter the control samples -nintQW both fall exponentially and are described by T0(675)= 89 K and T0(692)= 52 K. The higher T0 of the "barrier" SQW devices compared to their respective control samples demonstrates a clear improvement in device performance. The T)intQW for the "barrier" samples are always greater than those for the control samples at a given T. The T0 values themselves are the result of a complex interdependence of processes determined by diffusion lengths, thermal escape rates from the QW and non-radiative (Auger and Shockley-Read) recombination rates in the quantum well and surrounding InAs. That the T0 values for the shorter wavelength (and thus shallower well) control sample T0(IC692)= 52 K is less than that for the longer wavelength (deeper well) QW T0(IC675)=89 K; that this trend is also mirrored by the
150
"barrier" devices (irrespective of the actual barrier material), and that similar wavelength samples possess similar T0's suggest that thermal escape from the QW rather than Auger recombination is the limiting factor for efficient high temperature operation at the operating wavelengths considered here. Sample
IC653 (BARRIER)
IC675 (CONTROL)
IC692 (CONTROL)
IC693 (BARRIER)
IC694 (BARRIER)
IC720 (BARRIER)
T.(K)
110
89
52
93
72
127
Table 2. T0 parameters determined from exponential decay of QW electroluminescence as a function of temperature. Further evidence for thermal escape of carriers from the QW as the temperature is increased is evident from r|imInAs. The mid-T range increase in r|intInAs is believed to be attributable to carriers having sufficient thermal energy to escape from the QW and recombine in the surrounding InAs region. For the deeper well (longer wavelength) samples IC653 and IC675 (control) this transfer of carriers out of the well begins at higher temperatures (125-175 K) than for the shallower well (shorter wavelength) devices IC693 and IC694 (in the range 100-150 K) For the shorter wavelength (k~ 4.1 urn) "barrier" samples IC693 / IC694 studied here the total 300 K power output is 108 uW, corresponding to r\mt= 2.5 % and a factor of 7 greater than the \~ 4.1 urn control sample IC692 with rjint= 0.4 %. Of the total EL output 11-14 uW (12-13 % of the total emission) originates from the QW compared to 1.5 uW for the control, a factor of 7 improvement. Overall 300 K power output from the longer wavelength (k~ 4.7 um) "barrier" sample IC653 is slightly less than the shorter wavelength "barrier" samples (84 uW against 108 uW) but the fraction of electroluminescence originating from the QW is actually increased at 27 uW (32 % of the total emission). This reflects the beneficial effect of deeper quantum wells in reducing thermal escape. For the corresponding X~ 4.7 urn control sample IC675 the total power output is 7.6 uW with a similar fraction originating from the QW. The r\int= 2.1 % for the longer wavelength "barrier" sample IC653 is a factor 3.4 greater than that found in the control. 3.2. Negative luminescence (NL) devices We have previously reported initial NL results from devices containing an InAs / InAsSb SLS active region that emitted at 4.2 urn.19 These initial devices had relatively short operating wavelengths, thin (1 urn) active regions and NL efficiencies TINL < 20 % (where r^ is defined at a given temperature by the ratio of maximum NL power (Fig. 9) to that of a BB at the same temperature). Here we extend the operating wavelength and investigate the feasibility of growing thicker (~ 4 urn) SLS active regions in order to offset the reduced absorption co-efficient at longer wavelengths. With the SLS composition of IC720 yielding an effective 300 K bandgap at ~ 6.8 um the available blackbody emittance is 3.4 mWcm"2. Room temperature (FB) positive and (RB) negative luminescence spectra from a 4 mm2 device are shown in Fig. 8 at a bias current I0=l A. A contact obscuration factor of 11.5 % has been taken into account, although the non-optimal top contact geometry may result in current crowding beneath the contacts that would cause a deterioration from the true spectral emittance values shown. The theoretical limit corresponding to a 300 K blackbody has been included for reference. The negative luminescence operating wavelength has been extended to X=6 urn. A useful feature of negative luminescence operation, namely the increase in output power with temperature, is evident in Fig. 9. This contrasts conventional FB operation where the output is seen to decrease with increasing temperature in the range 270-300 K (reducing slope of positive luminescence branch of Fig. 9). Temperature dependent variations of output power currently constitute a major obstacle to the successful implementation of LED's into low cost gas sensing systems where expensive temperature stabilisation hardware must be avoided. AC bias schemes utilising both positive and negative luminescent device operation may eventually prove useful in this respect. The peak spectral emittance in RB (at A,=6 um) is -0.5 uW/cm2 meV, about the same as the earlier X= 4.2 urn NL device (0.45 uW/cm2 meV).19 The present device is operating at longer wavelengths where more of the 300 K blackbody spectrum is available and so there is a consequent reduction in r)^ (1.1 % at the peak of the NL spectrum, climbing to -5% at shorter wavelengths) compared to the earlier X= 4.2 um device. However, that the emittance has not decreased despite a substantial increase in the operating wavelength highlights the potential of this operating mode.
151
9 8 7
6
Wavelength (um) 5 4
3 „«■ IC720 4mm2 device 10 MS pulses© 10 kHz
IC720 T=300K 2 1.0 4mm device
-T=270K -T=280K -T=290K -T=300K -T=310K -T=320K
0.5
§0.0 CO
S
I
-0.5 300K Backbody,■■"
litrit
-LO^
150
200
250 300 Energy (meV)
350
400
Negative luminescence
•1500-1000 -500
0
500 1000 1500
Peak current (mA)
Figure 8. Positive and negative luminescence from SLS NL device IC720 at 300K, and negative luminescence efficiency.
Figure 9. FB and RB L-I curves for SLS NL device IC720 in the temperature range 270-320 K. FB power output decreases while RB power increases as the temperature is increased.
The reduction in r\^ occurs despite the present device incorporating a thicker active region to offset the reduction in absorption co-efficient as the active region wavelength is increased. This suggests that the present device T^ is being limited by leakage currents that act to reduce the extraction process and limit the reduction in np product in the active region. We believe that the dominant mechanism negating the extraction process in RB may be the generation of minority holes, possibly by a CHHL Auger process, in the top n+ SLS layer. Suitable wide bandgap n-doped layers, such as short period n-InAs / AlSb superlattices, may prove beneficial in reducing this leakage current and improving device performance. 4. CONCLUDING REMARKS Further improvements in SQW LED device performance have been realised by incorporating electron confining barrier layers. Both compressively strained ALAs002Sb09S and In0g3Al017As barriers under tensile strain have been successfully grown into SQW devices whilst maintaining pseudomorphic growth to the available InAs substrates. Room temperature quantum efficiencies have been improved by factors by up to 7. Negative luminescence operation has been extended to X=6 urn in the InAs / InAsSb SLS system without any reduction in emittance compared to earlier K= 4.2 um devices. NL device performance appears to be limited by leakage currents originating in the top n+ contact layer that act to limit the extraction process. The use of wide gap n-doped contact layers may bring significant improvements in this respect.
152
ACKNOWLEDGMENTS Financial support from the UK Engineering and Physical Sciences Research Council and a European Community Marie Curie Fellowship (JH) are gratefully acknowledged. REFERENCES 1. 2. 3. 4. 5. 6. 7. 8. 9.
10.
11.
12.
13. 14. 15.
16. 17. 18. 19.
A. Müller, M. Beck, J. Faist, U. Oesterle, M. Ilegems, "Electrically tunable, room-temperature quantum-cascade lasers" Appl. Phys. Lett. 75 (11), pp 1509-1511,1999 G. Strasser, S. Gianordoli, L. Hvozdara, W. Schrenk, K. Unterrainer, E. Gornik, "GaAs/AlGaAs superlattice quantum cascade lasers at A, * 13 pm",Appl. Phys. Lett. 75 (10), pp 1345-1347,1999 J.L. Bradshaw, R.Q. Yang, J.D. Bruno, J.T. Pham, D.E Wortman, "High-efficiency interband cascade lasers with peak power exceeding 4 W/facet", Appl. Phys. Lett. 75 (10), pp 2362-2364,1999 C.L. Felix, W.W. Bewley, I. Vurgaftman, L.J. Olafsen, D.W. Stokes, J.R. Meyer, MJ. Yang, "High-efficiency midinfrared "W" laser with optical pumping injection cavity", Appl. Phys. Lett. 75 (19), pp 2876-2878, 1999 S.D.Smith, A.Vass, P. Bramley, J.G. Crowder, C.H. Wang, "Comparison of IR LED gas sensors with thermal source products.", IEE Proc.-Optoelectron. 144 (5), pp 266-270,1997 A.A. Popov, V.V. Sherstnev, Y.P. Baranov, C. Alibert, "Powerful mid-infrared light emitting diodes for pollution monitoring" Electron. Lett. 33 (1), pp. 86-88, 1997 A. Krier, H. Gao, V. Sherstnev, Y. Yakovlev, "High power 4.6 um LED's for CO detection", Electron. Lett. 35 (19), pp. 1665-1667, 1997 T. Ashley,"Electronic and optoelectronic devices in narrow-gap semiconductors", Inst. Phys. Conf. Ser. No. 144, pp 345-352, 1995 CH.Wang, J.O.Crowder, V.Mannheim, T.Ashley, D.T.Dutton, A.D.Johnson, G.J.Pryce and S.D.Smith, "Detection of N02 using a room temperature operation mid-infrared InSb light emitting diode", Electron. Lett. 34 (3), pp 300-301, 1998 P.J.P. Tang, H. Hardaway, J. Heber, C.C. Phillips, M.J. Pullin, R.A. Stradling and W.T. Yuen," Efficient 300 K lightemitting diodes at X~5 and ~8 um from InAs / In(As,.xSbx) single quantum wells", Appl. Phys. Lett. 72 (26), pp 34733475, 1998 Y. B. Li, D. J. Bain, L. Hart, M. Livingstone, C. M. Ciesla, M. J. Pullin, P. J P. Tang, W. T Yuen, I. Galbraith, C. C. Phillips, C. R. Pidgeon and R. A. Stradling, "Band Alignments and offsets in In(As,Sb)/InAs Superlattices". Phys. Rev. B. 55 (7), pp. 4589-4595,1997. M.J. Pullin, H.R. Hardaway, J.D. Heber, C.C. Phillips, W.T. Yuen, P. Möck, "Room-temperature InAsSb strained-layer superlattice light-emitting diodes at \.=A2 urn with AlSb barriers for improved carrier confinement", Appl. Phys. Lett. 74 (16), pp 2384-2386, 1999 C.R. Pidgeon, CM. Ciesla, B.N. Murdin, "Suppression of non-radiative processes in semiconductor mid- infrared emitters and detectors", Prog. Quantum. Electron. 21 (5), pp 361-419,1997 M.E. Flatte, C.H. Grein, T.C. Hasenberg, S.A. Anson, D.-J. Jang, J.T. Olesberg, T.F. Boggess, "Carrier recombination rates in narrow-gap InAs/Ga,.xInxSb-based superlattices" Phys. Rev. B 59 (8), pp 5745-5749, 1999 W.W. Bewley, C.L. Felix, E.H. Aifer, I. Vurgaftman, L.J. Olafsen, J.R. Meyer, H. Lee, R.U. Martinelli, J.C. Connolly, A.R. Sugg, G.H. Olsen, M.J. Yang, B.R. Bennett, B.V. Shanabrook, "Above-room-temperature optically pumped midinfrared W lasers", Appl. Phys. Lett. 73 (26), pp 3833-3855, 1998 S.S. Bologov, V.K. Malyutenko, A.P. Savchenko,"Charge-carrier exclusion in InAs", Semiconductors 31 (5), pp 444445, 1997 T. Ashley, C.T. Elliot, N.T. Gordon, R.S. Hall, A.D. Johnson, G.J. Pryce, "Negative luminescence from In,.xALSb and CcLHg^Te diodes", Infrared Phys. 36, pp 1037-1044,1995 L.J Olafsen, I. Vurgaftman, W.W. Bewley, C.L. Felix, E.H. Aifer, J.R. Meyer, J.R. Waterman, W. Mason, "Negative luminescence from type-II InAs/GaSb suprlattice photodiodes", Appl. Phys. Lett. 74 (18), pp 812-814, 1999 M. J. Pullin, H.R. Hardaway, J.D. Heber, C.C. Phillips, "Type-II InAs / InAsSb strained-layer-superlattice negative luminescence devices", Appl. Phys. Lett. 75 (22), pp 3437-3439, 1999
153
Native oxided AlAs current blocking layer for AlGalnP high brightness light emitting diodes WANG Guohong*, MA Xiaoyu, ZHANG Yufang, WANG Shutang, LI Yuzhang, CHEN Lianghui National Engineering Research Center for Optoelectronics Devices Institute of Semiconductors, Chinese Academy of Sciences ABSTRACT Native Oxide AlAs layer were employed to block the current injection from the top anode. The luminous intensity exceeded 75mcd of the LED chip with native oxide AlAs layer sandwiched 5pm AlGaAs current spreading layer under 20mA current injection. Electrical and optical properties the LED chip and plastically sealed lamp were measured. Aging of the LED chip and lamp were performed under 70°C and room temperature, Experiment results shown that there is no apparent effect of the native oxided AlAs layer and the process on the reliability of the LED devices. Keywords: Native Oxided AlAs, Current blocking layer, AlGalnP, High Brightness Light Emitting Diodes. 1.INTRODUCTION High-brightness visible light-emitting diodes(LEDs) are becoming increasingly important and have numerous potential applications, such as in the field of optical display system, traffic signal and automobile lamp. The quaternary AlGalnP alloy, which can be precisely lattice matched to GaAs substrate, have a direct bandgap ranged from 1.88 to 2.30eVm, with different aluminum composition, Mass production of AlGalnP high-brightness LEDs has been realized by using multi-wafers metal organic chemical vapor deposition (MOCVD) system recently. One of the problem in the InGaAlP LEDs was a restriction of light extraction efficiency caused by light absorption of top anode, Because the current injection concentrate under the anode. Thick current spreading layer, transparent anode'21 and reverse biased pn junction current blocking layer131 were considered to reduce the current injection under anode. But these measurements whether lead to large cost or make fabrication process difficulty. In this article native oxide AlAs layer sandwiched 5um AlGaAs were employed to block the current injection from the top anode, The fabrication process is simple and cost less. 2.STRUCTURE OF THE DEVICE The Schematic cross sectional structure of the device was shown in fig.l, The epilayers were grown by LP-MOCVD on GaAs substrate, In sequence the device consist of 0.2um GaAs buffer layer, 10 pairs AlAs(525nm)/GaAs(500nm) DBR for reflection of light toward absorptive GaAs substrate, DH structure active region with 1pm n-CAloyGao^osInosP lower confinement layer,
* Emailaddress:
[email protected] This work is supported by "High Technology 863 Plan".
154
In Light-Emitting Diodes: Research, Manufacturing, and Applications IV, H. Walter Yao, Ian T. Ferguson, E. Fred Schubert, Editors, Proceedings of SPIE Vol. 3938 (2000) • 0277-786X/00/$15.00
0.5 um i-(AlxGa1.x)0.5lno.5P and lurn p-(Al07Ga03)05In05P upper confinement layer. For current spreading and the blocking of the current injection under the top anode 0.1 um AlAs sandwiched in 5um Al08Gao.2As. Contact layer was O.lum p+ GaAs doped lel9cm"3. In the center of the top anode lOOum2 square oxidation window were etched. Selective oxided AlAs region is larger than the top anode to block current injection shown as the dashed arrow. 4A native oxide AlAs
4B oxidation window 49
anode
48
p+-GaAs
47
p-Al08Ga02As
46
p-AlAs
45
p-Al08Gao2As
44 43
p-(Alo.7Gao.3)o.5In0.5P i-(AlxGa1.x)05In05P
42
n-(Al0.7Ga0.3)0.5In0.5P
4C 10 pairs AlAs/GaAs DBR 41A GaAs buffer layer 41 n-Substrate 40
Cathode
Fig. 1 Schematic cross sectional structure of the device
3.MATERIAL GROWTH AND DEVICE FABRICATION AlGaAs/AlGalnP material were grown on GaAs substrate with orientation (001) off (lll)A 6° by AXITRON AIX 200 MOCVD system, TMGa,TMAl,TMIn were used as group III elements precursors, PH3 and AsH3 were used as group V element precursors. For AlGalnP material growth the V/III ratio was 100. DEZn and SiH4 were used as p-typed and n-typed dopants respectively. The growth temperature was 700°C-750°C, The total hydrogen flow was 71. The oxidation window was formed by lithograph after top anode deposition, Then AlogGaojAs current spreading layer was etched with H2S04:H202:H20=3:1:1 solution at room teperature., This solution only etch AlGaAs and stop at the surface of AlGalnP. Au/Zn/Au was used as p-type , 100um circle top anode was formed by lithography. AlAs Oxidation process were performed after anode pattern lithograph. High purity N2 through 80°C deionized water bath were used as oxidation gas, The oxidation were processed under 500°C with different time to check the current blocking effect variantion. AuGeNi was used as n-type contacts, The wafer was sawn to 300X300um2 square dice bounded on copper heat sink for measurement. 4.DEVICE PROPERTIES AND DISCUSSION The device optoelectronic properties are strongly depend on the oxidation time, The oxidation speed is slowed down with oxidation time increase (shown in fig.2 ), The oxidation pattern is square when the oxidation time is less than 30 minutes, but when the oxidation time increased the oxidation pattern is rounded at the corner of the square because of the oxidation
155
speed is slowed down.
i
o X
'
i
■o
3" P
3
'
i
'
i
_—-——■—"
^^
P
3 D.
i
80-
oo
'
Hl-
40-
/ / / / / / /
c 3 Oi
G> 3
n
$ 3 o
20-
2D
4)
8)
80
Oxidation time (minutes) Fig.2 Oxidation depth d variation with oxidation time
Oxidation time (minutes) Fig.3 Luminescence Intensity (20mA)variation with oxidation time
Fig.3 shows the device luminescence intensity variation versus oxidation time, We found that the luminescence intensity increases slow at first 20 minutes and tends to saturation when the oxidation time is longer than 60 minutes. When the oxidation time is less than 20 minutes the oxidation depth is less than 30(im, so the blocking layer is still under the top anode. When the oxidation is longer than 60 minutes, the oxidation blocking layer is larger than the top anode, so the current injection region is far away from the top anode, Light from active region almost cant reach the top anode. As the oxidation depth increase the hole injection from anode need longer path to reach active layer combine 8 T> with electron, so the series C3 0) resistance increases, This caused the device operation voltage increasing with the •co E oxidation time increase. O Fig.4 shows the operation 40 60 80 voltage under 20mA Oxidation time (minutes) versus oxidation. Compare with FigADevice operation voltage under 20mA Fig.3, we think the optimized versus oxidation time oxidation time is around 60 minutes, under this condition the light extraction is tend saturation and the operation voltage is acceptable. Fig.5 compared the reliability for different oxidation time under 70°C 20mA, Experiment results shows no apparent decreasing after oxidation process.
156
0.15
No. 14 with oxidation block layer
0
o
Q_
0.10
c o '(/) co *E in 0.05 -
ro (U
DC
No. 14 without oxidation
0.00 50
100
150
200
250
Aging Time (hrs) Fig.5 Device reliability for different oxidation time under 70°C 20mA a:20, b:30, c:40, d:60, e:100 (minutes) SUMMARY Native Oxide AlAs layer was successfully employed to block the current injection from the top anode. The luminous intensity exceeded 75mcd of the LED chip with native oxide AlAs layer sandwiched 5urn AlGaAs current spreading layer under 20mA current injection. This result can be compared with LEDs which have thick GaP current spreading layer grown by VPE[4). Electrical and optical properties of the LEDs, The results show that oxided AlAs depth must be well controlled to optimum the operation voltage and light emitting efficiency. Aging properties of the LED shown that there is no apparent effect of the native oxided AlAs layer and the process on the reliability of the LED devices. REFERENCES: [1] G.C.Chi,Y.K.Su,M.J.Jou,W.C.Hung "Window Layer for Current Spreading in InGaAlP Light-Emitting diode"
lAppl.Phys. 76(5) 1. 1994„
[2] J.F.Lin M.C.Wu M.J.Jou et.al. "Highly reliable operation of Indium tin oxide AlGalnP orange light-emitting diodes" Electronics Letters. Vol.30 No.21 p.1793 .994. [3]
Hideto Sugawara, Kazahiko Itaya and Genichi Hatakoshi, "Hybrid-Type InGaAlP/GaAs Distributed Bragg Reflectors for InGaAlP Light-Emitting Diodes", Jpn.J.Appl.Phys. Vol.33 (1994)p.6195-6198.
[4] K.H.Huang J.G.Yu. J.G.Yu etal. "Twofold efficiency improvement in high performance AlGalnP light-emitting diodes in the 555-620nm spetral region using a thick GaP window layer"
Appl.Phys.Lett.61(9)31 1992.p.l045.
157
158
SESSION 6
Novel Structures and Materials
159
Invited Paper
Substrate Removed 850nm RCLED's and Small Core (63/125jxm) Plastic Optical Fibers for Optical Data Communication. Thierry Coosemans#, Ronny Bockstaele, An Van Hove, Kris Naessens, Joff Derluyn, Luc Vanwassenhove, Peter Van Daele, Ingrid Moerman, Roel Baets University of Gent-EVEC, Department of Information Technology, Gent, Belgium, B-9000 ABSTRACT Current developments in computer technology give rise to increasing data communication over relatively short distances at backplane- and inter MCM interconnect level. It is foreseen that electrical interconnect will not be able to accommodate the necessary data traffic in advanced data processing systems in the future and hence a bottleneck will be created. A potential remedy for this interconnect problem is the use of parallel optical datalinks. In this paper we propose small diameter step index plastic optical fiber ribbons in combination with high efficient resonant cavity LED's as a cheap and feasible option for these optical links. A design for such an optical link is presented with special attention for the optical pathway. Experimental results on the optical properties of the used POF are shown. We describe the development of RCLED's at 850nm specially designed for efficient coupling into POF. We measured a RCLED to POF coupling efficiency up to 40%. Additionally we report on the technologies used for the fabrication and assembly of the optical pathways and finally some experiments were carried out on the first realized assemblies. Keywords: Resonant Cavity LED's, Plastic Optical Fiber, Parallel Optical Datalink,
1. INTRODUCTION. Increasing component density, chip size and clock frequencies may create a bottleneck in electrical interconnections of data processing systems over a few years. Parallel optical interconnect with direct access to any location within a CMOS chip, has been proposed as a solution to the problems inherent to the electrical interconnect '. Resonant Cavity LED's are suitable light sources for that kind of interconnect systems since they can be integrated into large 2D arrays. Moreover, they have a high efficiency at low current (no threshold), a low thermal and electrical resistance and they emit light vertically. In addition they are reliable, eye-safe, and relatively cheap. The cost of the optical link is indeed a dominating factor in realization of such optical interconnect systems. Therefore the use of polymer optical fibers (POF's) is extremely attractive: it is a very cheap product and moreover a quick end facet termination technique has been developed: the POF's are simply cut with a hot knife. In this way time the time consuming (and hence expensive) process of polishing the end facet, necessary in the case of glass fibers is avoided. In addition POF's exhibit smaller bending losses due to their large numerical aperture. Consequently compact optical links are possible. Moreover the large numerical aperture allows to capture a relative large part of the emitted light of the RCLED. Nowadays POF's with a diameter of 125nm are available what permits us to use the standard channel pitch of 250nm. Compact optical connections using a 4 X4 POF array bent over 90° have been reported 2'3. The fact that POF has a higher loss than glass fiber is of little importance since we consider interconnect distances that vary between a few centimeter and 1 meter. In this paper we propose the use of 850nm substrate removed RCLED's in combination with small diameter (63/125p.m) step index POF for parallel optical links on backplane- and inter MCM interconnect level. We illustrate the optical properties of POF with some experimental results. We describe the development of these RCLED's specially designed for a maximal power coupling into the POF. In addition the power coupling between RCLED's and POF is studied wit special attention for the alignment tolerances. Further on the realization of the optical pathways in the optical links is discussed. The design of these optical pathways is based on plates with grooves in which the POF's are fixed. These grooves are made with laser ablation in polymethyl metacrylate (PMMA) plates. After fixing the POF's in the grooves, the plates are aligned and stacked in order to create a 2-dimensional POF array. We developed a
160
In Light-Emitting Diodes: Research, Manufacturing, and Applications IV, H. Walter Yao, Ian T. Ferguson, E. Fred Schubert, Editors, Proceedings of SPIE Vol. 3938 (2000) • 0277-786X/00/$15.00
versatile and flexible alignment method we called "virtual" alignment. First experimental results on the assembly are shown and discussed. Large part of the work has been done in the framework of the European Community ESPRIT-OIIC project4,s. The aim of this project is to realize several demonstrators in which parallel optical links interconnect FPGAs (Field Programmable Gate Arrays). In this way a 3D stack of interconnected gates with low latency and large programmability flexibility is realized.
2. 63/125 um STEP INDEX PLASTIC OPTICAL FIBERS. Since step index POF has been reported for the first time in 1968 by Dupont it has been evolving rapidly 6. Nowadays low loss graded index fibers are introduced in WDM systems7, home networks8 and automotive systems9. Most of the available POF has a large core (>300p,m) what results in low loss (and hence cheap) connectors. However for compact parallel chipto-chip interconnect links a standard pitch of 250)xm is adequate. Hence a POF with a core diameter of 63fim and an overall diameter of 125nm is a compatible choice. Moreover, reducing the core diameter allows the use of smaller detector diameters what increases the data transmission speed. For that purpose PMMA POF has been purchased at ASAHI chemical and the geometrical and optical properties were studied. In addition extensive work was done on the end facet termination of POF ' . Several techniques were studied and evaluated. All the samples used for the experimental work reported in this paper are terminated with "hot knife cutting": a 110°C warm knife edge is used to cut the POF's. 2.1. Geometrical properties. The POF's have been measured on their core an cladding diameter: we found an average core diameter of 63^m with standard deviation of 2.36|am. This variation on the core diameter can cause some limited losses on the transmission efficiency while coupling a POF to a RCLED/detector or to another POF. For example, even in the case of perfect alignment two butt-coupled POF's will still suffer an average transmission loss of 0.18dB caused by difference in core diameter. For the overall diameter a value of 122.6 jam was found, with a standard deviation of 5.8pim. How this will influence the coupling efficiency has not been investigated yet, but it will depend on the shape of the grooves in which the POF's are fixed. Also the core-cladding concentricity will influence the coupling efficiency, but it has not been investigated neither. 2.2. Absorption losses. Absorption losses are one of the main drawbacks of the use of POF. As opposed to glass fiber having losses of few dB per kilometer, POF's have losses in the order of few dB per meter, (fig 1). Moreover 18 the low loss wavelength domain is 16 situated between 400 and 850nm.This is 14 m 12 one of the reasons why we chose 850nm ■o c 10 as the emitter wavelength. However, for o H optical links of maximal 1 meter the IS 3 H C absorption losses are acceptable. The 2 4 absorption loss at 850nm has been < 2 measured with a cut back method: a 0 o o o value of 2.8dB/meter was found. o in r-- o IO
Wavelength [nm]
Fig. 1: Absorption spectrum for a PMMA step index fiber.
161
2.3. Numerical aperture and bending losses. The numerical aperture of the POF is specified at 0.5. This has been verified experimentally: the numerical aperture was calculated from a far field emission pattern of a 1 meter long POF. A value of 0.5 was found indeed. A high numerical aperture decreases the bandwidth of the link. But here again for small distances this is irrelevant. On the other hand this relatively high NA permits low bending losses. In order to verify this, POF's were bent and the transmission losses were measured. Bending radii down to 2 millimeter did not cause any losses. Moreover we looked at the influence of bends on the mode distribution in the POF. Therefore a 360° bend (radius 2mm) was introduced in a 50cm long POF. As can be seen from figure 2 the far field emission pattern is only slightly disturbed. This implies that the efficiency of the Fig 2: Far field emission pattern of a 50cm long POF. The curve with the POF to detector coupling at the end of the optical squares gives the field without a bend, the curve with the triangles gives the link is independent of any bends in the POF. field after a 360 degrees bend. Neither is there any risk of crosstalk at detector level induced by bends.
3. 850nm SUBSTRATE REMOVED RESONANT CAVITY LED'S. Standard planar LED's have a low efficiency due to the total internal reflection at the semiconductor-air interface. However, if the active layer is sandwiched between 2 mirrors, the resonant cavity effect alters the radiation pattern, resulting in a more directed beam and smaller emission spectra n"13. These devices are called RCLED's. Compared to standard LED's, more power is emitted within the solid angle of escape, resulting in increased extraction efficiency. This effect has been used to increase the total extraction efficiency, up to values of 22 % for 980 nm RCLED's14. Other techniques for increasing the efficiency of LED's include the use of surface roughening as in the case of the non resonant cavity LED. Over 17% overall efficiency at high speed has been reported15. For the considered POF based optical link, RCLED's at 850nm were developed. This emission wavelength has the advantage of allowing the detection by integrated Si detectors. However, the GaAs substrate of the through-substrate emitting devices has to be removed completely, as it is highly absorbing. This substrate removal is achieved by a combination of a mechanical polish and a wet chemical etching technique. The RCLED is designed is such a way that a maximum amount of power is launched into the numerical aperture of POF, at the lowest possible drive current. 3.1. Structure and performance of the RCLED's. The RCLED structure is shown in fig 3. The active layer (3 GaAs quantum wells embedded in Al2oGa80As barriers) is gold mirror/ p-contact
p++ GaAs contact layer phase matching layer A120Ga80As cavity with 3 GaAs quantum wells
üHv-rz*
AlAs/GaAs DBR
.
,
(removed substrate )
.
,-t ,:iiSßK.---
III
Fig 4: Flip-chipped 8X8 RCLED array. Fig3: The bottom emitting 850nm RCLED.
162
sandwiched in between a metal (gold) top mirror and DBR outcoupling mirror. The cavity thickness is chosen to match the cavity resonance wavelength with the intrinsic spontaneous emission wavelength. The active layer is placed at the anti node position of the internal standing wave profile. Simulations were done to optimize the layer structure of the RCLED for coupling to POF and to determine the optimal cavity detuning and number of DBR pairs. In a first run, a AlAs/GaAs DBR was chosen, to minimize the penetration depth of the outcoupling mirror and thus maximize the extraction efficiency. The devices were realized in 8x8 array and flip-chipped on glass and semiconductor carriers (fig4), then they were characterized. The overall extraction efficiency was rather poor: only 5 % was achieved. This was contributed to the absorption losses in the GaAs-Iayers of the DBR. The bandgap energy of GaAs is about 870nm, and the emitted 850nm light is absorbed very fast. Therefore, a new experiment was started, with a All5Ga85As/AlAs DBR. The layer structure was again optimized for maximal coupling to POF. The design also includes a high Al content layer, to be oxidized selectively to form a current window. Figures 5 and 6 show the measured optical power and voltage drop as function of the current, for 50|i,m diameter RCLED's (70|0.m mesa diameter). The 8x8 array was highly non-uniform. This is contributed to a non-optimized substrate removal process. However, some important conclusions can be made. The best overall quantum efficiency was about 9 %. Only one device did not work at all, but only 33 % of the devices had the large efficiency. Three devices have a very small saturation current (max efficiency at 2mA), and also a larger voltage drop. This can be explained by cracks in the RCLED-film. The voltage drop over the LED's after the substrate removal process increases, for example from 1.8 to 3.1 V at 2mA drive current. This is contributed to an increased lateral resistance, because of the absence of the substrate. A 2\xxa All5Ga8JAs layer under the etch stop layer can enhance the mechanical stability (cracks) and the current spreading. Currently we are investigating this solution as well as an improved etching mechanism.
Figure 5 : Measured (P,I) curves of 50 um RCLED (70um mesa).
Figure 6 : Measured (V,I) curves of 50 um RCLED (70um mesa).
3.2. Coupling efficiency and alignment tolerances. The coupling efficiency of RCLED's to POF was experimentally tested. RCLED's with a mesa of 70um were butt coupled with the 63/125iim POF. Up to 40% of the emitted power is coupled into POF. This can be explained by the fact that since the substrate is removed, the end facet of the POF is very close to the emitting area of the RCLED. Hence almost all the light emitted by the RCLED falls on the end facet, and all the light within the NA of the POF is captured. A maximal ratio coupled power in POF/drive current of 16uWatt/mA was found (at 1.8mA drive current) Another key element in the design of an optical link is the alignment tolerance of the RCLED to POF coupling. Therefore a RCLED with a mesa of 52|j,m was butt coupled with the 63/125|jm POF and a lateral offset was introduced (fig 7). As can be seen from figure 8, a misalignment of +/- 15pm is allowed with negligible penalty. For higher offsets the efficiency decreases dramatically.
163
50.00% u c 40.00%
0)
30.00% O)
c 20.00% a. ■3 O 10.00%
o
0.00%
Fig 7: Lateral offset of a RCLED to POF coupling.
40
50
60
70
Offset ((im) Fig 8: Coupling efficiency for a butt coupled POF and RCLED (mesa 52um).
4. OPTICAL PATHWAYS. Besides the development of RCLED's a lot of our research work has been focused on the development of the optical pathways for the parallel link. 2D-arrays of POF's need to be assembled in order to interconnect 2D arrays of RCLED's and detectors. Alignment structures need to be developed for efficient coupling of these POF arrays to the RCLED/detector arrays. The construction of these structures is based on PMMA plates with grooves at a pitch of 250nm in which the POF's are fixed (fig 9,10) By stacking the plates at a pitch of 250p:m a 2D POF array is created (fig 11). These grooves are made with laser ablation (ArF excimer laser, 193nm). During the stacking the plates are aligned with a method we called "virtual" alignment. No master tool is needed and hence the method is versatile and can be used to align devices with different shapes without having to adapt the alignment setup. In a first step we develop a 4X8 POF patchcord (fig 12). In a further step we will develop more complicated structures containing a router function.
jm
Fig 9: PMMA plate with grooves at 250p.m.
Fig 11: Plates are stacked at 250p.m.
164
Fig 10: POF's are fixed in grooves.
Fig 12: A 4X8 POF patchcord.
4.1. PMMA plates with POF's. 4.1.1. Laser ablation. Laser ablation can be defined as controlled local removal of material through laser pulse - substrate interaction. A substrate is irradiated with a high power (0.07 - 4 J/cm2) laser beam. The light interacts with the material and particles are ejected
/Iw/
^E7
/ Fig 13a: Material is irradiated.
Figl3c: Particles are ejected.
Figl3b: Light is absorbed locally.
(figl3). In this way a microhole is created. This technique has several advantages: it is a non-resist technique, it does not require severe conditions, nor on the ablation environment and neither on the substrate. However the material should be highly UV absorbing. Finally, it is a very versatile and fast prototyping technique. Different materials were irradiated with two different excimer lasers (193nm (ArF), 248nm (KrF)). PMMA plates irradiated at 193nm generated the best results. Very steep sidewalls (78°) and low RMS roughness (0.33|J,m) at the bottom of the grooves were obtained (fig 14). The grooves are ablated with mask method; the laser light passes a mask containing the pattern of four grooves. While the laser is irradiating the material with consecutive pulses (frequency lOHerz), the sample is translated. Since a large area is irradiated and since 4 grooves are ablated simultaneously the whole procedure takes only about 15minutes for a plate with 8 grooves of 1cm long.
Hm
Figl3d: Microhole is realized.
* MdMiäL,.12
:,;X58,,500Wm,;
2? SEI
Fig 14: Laser ablated grooves in a PMMA plate.
4.1.2. POF's in grooves. In a second step the POF's need to be fixed in the grooves. Therefore a special setup has been build (fig 15). A 1X8 array POF's is tended at pitch of 250)^m by two MT ferrules. These are standard commercially available ferrules for 1X8 glass fiber arrays. Two plates are positioned on a translation table. The table is moved upwards and the POF's are pushed into the MTferrule
1X8 POF array
Plates with grooves.
MT ferrule
t
Fig 15: Setup for fixing the POF's in the grooves.
165
grooves, then the POF'S are fixed with UV-curing glue. Finally the POF's are cut with a hot knife (110°C) (fig 16). Critical points in the procedure are the actual pushing of the POF's in the grooves: the POF's need to be positioned at the bottom of the groove. Otherwise the precision of the ablation technology will be lost. Also the hot knife cutting needs to be done with great care in order not to destroy the ablated structure.
Fig 16: POF's glued in plate with grooves.
4.1.3. Experimental results. Measurements were done on some plates with fixed POF's: the position of the fiber cores was determined with a scanning experiment. By scanning the POF'S with a RCLED and measuring the transmitted power through the fiber on can find the position of the fiber core. We found an average pitch of 248|im with a standard deviation of 6pm (fig 17). The average Y
o Q o^yo o o o e Y axis
Average Y position
Xaxis
Fig 17: Position of POF cores in plate. position was calculated. The average distance between the POF cores and this average Y position was 1.3|0.m with a standard deviation of 4.8p.m. These deviations seem quite large but one should consider that the core-cladding non-concentricity and the variation on the core diameter contribute to this Camera 1 Camera 2 phenomenon to a considerable extent. 4.2. Creating 2D POF arrays. 4.2.1. "Virtual" alignment. After fixing the POF's in the grooves the plates need to be stacked at a pitch of 250um. A special setup has been built for this purpose, (fig 18) Essential are the precise translations of the object table and the use of two independently movable cameras. This allows us to avoid the use of master tools. The principle of "virtual" alignment is explained in figure 19. Important for a good functioning is a good adjustment of the setup before the actual alignment is done. E.g. the crosshairs of the cameras need to be parallel with the translations (x,y) of the objecttable. This has to be adjusted with high precision. After the plates are aligned they are fixed with UV-curing glue.
166
Holder (x,y,z,a)
Objecttable, precise x,y translations, a rotation Fig 18: "Virtual" alignment setup.
Fig 19a: The plate positioned at the objecttable is looked at with the two cameras.
Fig 19b: The comers of the plate are positioned on the crosshairs.
.250um Fig 19c: The plate is moved over an exact distance of 250um.
Fig 19d: The second plate (on the holder) is brought in the vicinity of the first plate.
Fig 19e: The second plate is positioned on the crosshairs and hence it is at 250um of the first plate. Afterwards the plates are glued.
Fig 19f: By repeating the procedure an m X n array is obtained.
4.2.2. Experimental results. Some plates were stacked and glued as can be seen in figure 20. Since the plates had a thickness of about 270|im we stacked them at 280^m. Then the position of the POF cores was determined with the same scanning method as described above. Following results were found (fig 21): the distance between the average y positions of both rows of POF cores (yav) was 279.5nm. The angle between both POF rows was 0.15°. The offset between two adjacent POF's on the same vertical line (Ax) was 4jirn with standard deviation 7[mi. Here again one should consider that the geometrical properties of the POF themselves contribute to the results of this experiment. Fig 20: Stacked plates with POF's.
o o-e-e-ö-^-^-e-e •■■■•■ U Kj-kS-^J-^^; p.^..^..y................ ""v^*^
»* •«■