Limiting the Power Consumption of Main Memory Bruno Diniz, Dorgival Guedes, Wagner Meira Jr. Federal University of Minas Gerais, Brazil
∗
Ricardo Bianchini Rutgers University, USA
[email protected]
{diniz,dorgival,meira}@dcc.ufmg.br
ABSTRACT The peak power consumption of hardware components affects their power supply, packaging, and cooling requirements. When the peak power consumption is high, the hardware components or the systems that use them can become expensive and bulky. Given that components and systems rarely (if ever) actually require peak power, it is highly desirable to limit power consumption to a lessthan-peak power budget, based on which power supply, packaging, and cooling infrastructures can be more intelligently provisioned. In this paper, we study dynamic approaches for limiting the power consumption of main memories. Specifically, we propose four techniques that limit consumption by adjusting the power states of the memory devices, as a function of the load on the memory subsystem. Our simulations of applications from three benchmarks demonstrate that our techniques can consistently limit power to a pre-established budget. Two of the techniques can limit power with very low performance degradation. Our results also show that, when using these superior techniques, limiting power is at least as effective an energy-conservation approach as state-of-the-art techniques explicitly designed for performance-aware energy conservation. These latter results represent a departure from current energy management research and practice.
Categories and Subject Descriptors B.3 [Memory structures]: Miscellaneous
General Terms Design, experimentation
Keywords Main memory, power and energy management, performance
1.
INTRODUCTION
The constant quest for higher performance and greater functionality has been producing hardware components and systems that consume significant amounts of power when fully utilized. Due to ∗ This research has been supported by NSF under grant #CCR0238182 (CAREER award), CNPq, FAPEMIG, and FINEP, Brazil.
Permission to make digital or hard copies of all or part of this work for personal or classroom use is granted without fee provided that copies are not made or distributed for profit or commercial advantage and that copies bear this notice and the full citation on the first page. To copy otherwise, to republish, to post on servers or to redistribute to lists, requires prior specific permission and/or a fee. ISCA’07, June 9–13, 2007, San Diego, California, USA. Copyright 2007 ACM 978-1-59593-706-3/07/0006 ...$5.00.
these high peak power consumptions, the power supply, packaging, and cooling infrastructures of these components and systems are becoming expensive and bulky. Modern high-end processors are an example of this trend, as they may consume in excess of 100 Watts when fully utilized, requiring expensive packaging and bulky heat sinks to prevent thermal emergencies. Another interesting example is hand-held devices, which are limited in their capacity by the bulky packaging that would be required by faster processors and larger memories. As a final and more extreme example, large data centers incur extremely high costs in provisioning power and cooling infrastructures for peak power consumption. Given that hardware components and systems rarely (if ever) need to consume their peak power, it is cheaper to design packaging and cooling infrastructures for the “common-case” power consumption. Some processors have been designed this way, e.g. the Pentium 4. They do not limit their power consumption, but slow themselves down when temperatures increase beyond a pre-defined threshold. This approach works well but the supply of power is provisioned to withstand the processors’ peak power consumption. A different approach is to limit power consumption at all times to a less-than-peak power budget. This approach allows for tighter provisioning of the power supply infrastructure, as well as cheaper packaging and cooling. For this reason, this approach is more appropriate for scenarios where the supply of power is limited (e.g., hand-held devices), expensive to over-provision (e.g., data centers), or can be reduced due to unit failures (e.g., blade systems with multiple power supplies). In this paper, we study techniques for limiting the power consumption of the main memory of a stand-alone computer. The reason for this focus is four-fold. First, memory capacities (and associated power consumptions) have been increasing significantly to avoid accesses to lower levels of the memory hierarchy in servers and desktop systems or enable the execution of more sophisticated applications in hand-held devices. Second, regardless of the environment, the memory subsystem is typically highly under-utilized in the sense that only a few devices need to be active at the same time. Third, if the power consumption of entire computers is to be limited with minimal performance degradation, we need to develop strategies to manage all subsystems intelligently, not just the processors. Fourth, since the low-power states of memory devices retain the data they store, limiting memory power can also benefit systems where the supply of power, packaging, and cooling infrastructures have already been provisioned: for a given system, it enables increases in memory size without the risk of violating the system’s specifications, e.g. without demanding more power than the supply can provide. We propose and evaluate four techniques, called Knapsack, LRUGreedy, LRU-Smooth, and LRU-Ordered, that dynamically limit
Power State/Transition Accessing Active Standby Nap Powerdown Active → Standby Active → Nap Active → Powerdown Standby → Active Nap → Active Powerdown → Active Standby → Nap Nap → Powerdown
Power (mW) 1167 300 180 30 3 240 160 15 240 160 15 160 15
Delay – – – – – 1 memory cycle 8 memory cycles 8 memory cycles +6 ns +60 ns +6000 ns +4 ns +∼0 ns
Table 1: RDRAM power states, consumptions, and overheads. memory power consumption by adjusting the power states of the different memory devices, as a function of the load on the memory subsystem. We also propose energy- and performance-aware versions of our techniques, while studying the tradeoffs between power budgets, energy consumption, and performance. Our evaluation is based on detailed full-system simulations of nine applications from three types of systems: MediaBench benchmarks, representing the workloads of hand-held devices; SPEC CPU2000 benchmarks, representing the workloads of desktop systems; and a client-server benchmark, representing the workloads of server systems. Most of our study assumes RDRAM-based memory subsystems for the ability to control the power state of each memory chip independently. However, our techniques are also applicable to DDR SDRAM technologies and their module-level, multi-chip access and power control; the techniques can treat entire DDR modules as they do single RDRAM chips. To demonstrate the generality of our techniques, we also discuss some results for DDR2 SDRAM subsystems. Our results demonstrate that the techniques can consistently limit power consumption. Our results make two main contributions: • They demonstrate that two of the techniques, Knapsack and LRU-Ordered, can limit power with very low performance degradation. • They show that, when using these techniques, limiting power is at least as effective for energy conservation as state-ofthe-art techniques explicitly designed for performance-aware energy conservation. The last contribution is particularly interesting in that limiting the power consumption to a less-than-peak budget is quite different than the current approaches to energy conservation. Specifically, energy conservation approaches send devices to increasingly lower power states without any constraints on the power consumption, i.e. during execution, power consumption may (and often does) reach the peak. Our work shows that limiting power is enough for significant energy savings with minimal performance degradation; sending devices to very low-power states may actually be counterproductive. Thus, our work paves the way for a new approach to energy conservation, representing a departure from current energy management research and practice.
2.
LIMITING POWER CONSUMPTION
In this section, we present techniques for limiting the power consumption of the main memory subsystem to a less-than-peak budget. Our techniques leverage the fact that modern memory devices have multiple low-power states that retain the stored data.
Each power state consumes a different amount of power, whereas the transitions between states involve different energy and performance overheads. As an example, Table 1 lists the power states, their power consumptions, and transition overheads of RDRAM memory chips [22, 31], each of which can be transitioned independently. Memory accesses (to cache-line-sized memory blocks) can only occur in active state, although the data is retained even in powerdown state. The idea behind our techniques is to have the memory controller adjust the power state of the memory devices so that their overall power consumption does not exceed the budget. We assume that the budget is pre-defined by the user or the manufacturer of the system containing the memory. Obviously, the budget has to be high enough that at least one device can be accessed at any time. Our techniques reserve enough power for active devices to be accessed. Thus, adhering to the power budget means that, when a memory device that is not in active state needs to be accessed, the controller may need to change the state of one or more other devices. The main challenge is to design techniques to guide the memory controller in selecting power states, so that it can avoid exceeding the budget while minimizing transition overheads. In particular, when the power budget is relatively low, some applications may suffer performance degradations; nevertheless, it is important to minimize these degradations by intelligently selecting power states. Because the memory subsystem is a major energy consumer in several environments (e.g., server systems [21]), another important challenge for the state-selection techniques is to adhere to the power budget while enabling as much memory energy conservation as possible without excessive performance degradation. Thus, instead of keeping the power consumption just below the budget, the techniques can reduce power consumption further, as long as the resulting performance degradation is acceptable. Again, we assume that the user or the manufacturer of the system pre-defines a maximum acceptable performance degradation resulting from energy conservation. In the next four subsections, we introduce our techniques. The unifying principle behind the techniques is that they represent different approaches to solving the well-known Multi-Choice Knapsack problem (MCKP) [25], as we explain below. The Knapsack technique is the optimal static approach, whereas the others are dynamic heuristics that differ in how they form and traverse a list of recently accessed memory devices. (Note that an optimal dynamic technique would consider, at each decision point, the sequence of future memory accesses. Because this sequence is not available in practice, we do not consider such a technique.) The fifth subsection describes extensions to the techniques that enable energy conservation without excessive performance degradation. The last subsection discusses the complexity and overheads our techniques impose on the memory controller.
2.1 Knapsack This technique is based on the observation that the goal of limiting power consumption to a pre-established budget is equivalent to the MCKP. The budget represents the knapsack’s capacity, whereas each memory device and potential power state represent an object. Objects are grouped by memory device, so that each group contains objects representing all the potential power states of the device. The weight of each object is its power consumption, whereas the object’s cost is the performance overhead of transitioning from its power state to active state. The goal is to pick one object from each set (i.e., a power state for each memory device), so that the potential performance degradation (i.e., the average device activa-
Non−Active chips 0
N
2
head (least recent)
Non−Active chips N
0
N
3
0
N head (least recent)
Active chips head (least recent) tail (most recent) 3 A
1 A
(a)
Active chips head (least recent) tail (most recent) 1 A
2
N
N
tail (most recent) 3 A
1 A
tail (most recent) 0
N
2 A
3 A
1 A
2
(a)
N
(b)
(b) head (least recent)
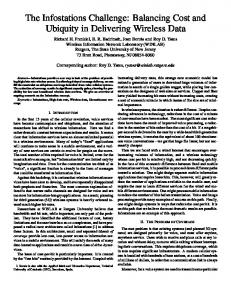
Figure 1: Illustration of Knapsack.
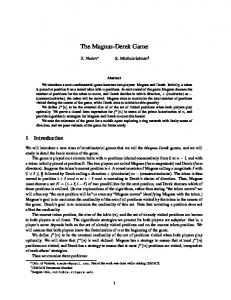
tion delay) is minimized under the constraint that the power budget is not exceeded. Typically, the optimal solution is the one in which the most memory devices can be in active state. Based on this formulation, our Knapsack technique computes the optimal configuration of power states for a given power budget. Specifically, the configuration determines the number of devices that should be in each state. For example, assuming the RDRAM information in Table 1 and 4 memory chips, the optimal configuration would be 1 chip in active state and 3 chips in nap state for a power budget of 1399 mWatts. (1399 mWatts = 25% of the range between the lowest possible budget, 1176 mWatts, and the highest possible budget, 2067 mWatts, plus the lowest budget. However, out of these 1399 mWatts, the difference between the accessing and active power consumptions, 867 mWatts, is reserved to allow a chip to be activated. Thus, the actual 25% power budget for 4 RDRAM chips is 532 = 1399 - 867 mWatts. Henceforth, the absolute values we list for the power budgets already exclude the 867 mWatts.) For a budget of 755 mWatts (50% of the same range mentioned above plus 1176 mWatts minus 867 mWatts), the best configuration would be 2 chips in active state and 2 chips in nap state. The computation of the optimal configuration is performed offline, so that the memory controller can be initialized with the configuration information. Although the MCKP is NP-hard, the number of memory devices is typically small enough that even a brute force solution is feasible. For example, our executions for 16 memory devices take only a few minutes to explore all the possible configurations. However, when the number of devices is moderate to large, a heuristic algorithm (and likely more search time) is required. For now, we use brute force. Regardless of how the optimal configuration is computed, the initialization of the memory controller assigns the states described in the configuration to each device randomly. To guarantee that the power budget is not exceeded at run time, Knapsack manages power states dynamically as follows. When the memory device to be accessed, the “target” device, is already in active state, no action is taken; it can be accessed without transitioning any other devices. When it is in a low-power state, an active device is selected to transition to the current power state of the target device. After this transition occurs, the target device can be activated and accessed. This approach maintains the invariant that the number of devices in each state is always as determined by solving the MCKP offline. To account for the locality of accesses across the different devices, Knapsack selects the active device to be transitioned to a low-power state using an LRU queue. Specifically, the LRU active device is selected as the victim. Figure 1 shows a detailed example of the Knapsack technique. We assume 4 RDRAM memory chips and a power budget of 755 mWatts. The figure shows one box per chip, listing the chip number on the left and its current power state on the right (A = active, S = standby, N = nap, and P = powerdown). Figure 1(a) illustrates the configuration when chip 2, currently in nap state, needs to be
0
P
tail (most recent) 3
N
2
N
1
A head (least recent)
(c)
0
P
tail (most recent) 3
N
1 A
2 A
(d)
Figure 2: Illustration of LRU-Greedy. accessed: chips 0, 3, and 1 are in nap, active, and active state, respectively. Chips 3 and 1 are on the LRU queue of active chips. This is one of the optimal configurations for this number of chips and power budget. Because the total power consumption is 660 mWatts at this point, simply activating chip 2 would violate the budget. To remain at an optimal configuration after chip 2 is activated, Knapsack changes the state of the LRU active chip (chip 3) to that of chip 2 and then allows the access to proceed, leading to the configuration in Figure 1(b). The main problem with Knapsack is that it is only feasible when the number of devices is small enough that a heuristic algorithm can produce a close-to-optimal solution within a reasonable amount of time. Furthermore, every time a change in power budget is desired, Knapsack involves a recomputation of the configuration. Because recomputing the configuration may be time-consuming when the number of devices is relatively large, we next describe three techniques that do not rely on finding an optimal or close-tooptimal configuration: LRU-Greedy (Section 2.2), LRU-Smooth (Section 2.3), and LRU-Ordered (Section 2.4). As we mentioned above, the techniques leverage an LRU queue of memory devices. The main difference between them is the way each one traverses the LRU queue and which devices are included in it.
2.2 LRU-Greedy LRU-Greedy tries to keep as many devices as possible in active state. It involves a single data structure kept by the memory controller, the LRU queue of memory devices. All changes to the queue are performed dynamically, as accesses arrive at the controller. Specifically, when a device is about to be accessed, it is removed from the LRU queue. At this point, we have two possible scenarios: (1) if the target device is active, the controller moves it to the end of the queue and proceeds with the access; and (2) if the target device is in a low-power state, the controller calculates whether activating it would violate the budget. If not, the controller moves it to the end of the queue, activates it, and allows the access to proceed. If so, one or more other devices will have to change states before the access can proceed. The distinguishing feature of LRU-Greedy is how its traverses the LRU queue to decide on these state changes. Specifically, LRUGreedy starts with the LRU memory device, sending it to the shallowest power state that would satisfy the budget. If changing the state of the LRU device alone is not enough, it is left in powerdown state and the process is repeated for the next device on the queue, and so forth, until the budget is finally satisfied. Figure 2 illustrates the operation of LRU-Greedy in the same scenario as Figure 1. Figure 2(a) illustrates the status of the queue
head (least recent) 0 head (least recent) 2
N
N
tail (most recent) 3
A
1
A
tail (most recent) 0
N
3 A
Non−Active chips (Ordered queue) head
tail 0
1 A
2
N
2
N
head (least recent) 0
P
(b)
3 A
S
2
N
1
N
0
N
1 A
Active chips (LRU queue) head (least recent) tail (most recent) 1
A
(a)
tail (most recent) 3
tail 3
N
Active chips (LRU queue) head (least recent) tail (most recent)
(a)
Non−Active chips (Ordered queue) head
2
A
(b)
S head (least recent)
(c)
0
P
tail (most recent) 3
S
1
S
2
Figure 4: Illustration of LRU-Ordered.
A
(d)
Figure 3: Illustration of LRU-Smooth. when chip 2, currently the LRU chip, needs to be accessed: chips 2, 0, 3, and 1 are in nap, nap, active, and active state, respectively. Again, because the total power consumption is 660 mWatts at this point, simply activating chip 2 would violate the budget. Thus, Figure 2(b) shows the queue after chip 2 is removed from it. Since chip 2 will consume 300 mWatts when activated, the chips still on the queue can consume at most 755 - 300 = 455 mWatts. LRUGreedy then traverses the queue to reduce the consumption below this value. Figure 2(c) shows the queue after chip 0 is sent to powerdown state and chip 3 is sent to nap state. These changes bring the consumption of the queue to 333 mWatts. Finally, Figure 2(d) shows the queue after chip 2 is activated and moved to the end of the queue, leading to a consumption of 633 mWatts. The memory access can proceed at that point.
2.3 LRU-Smooth The LRU-Smooth technique tries to keep more devices in shallow low-power states, rather than fewer devices in deeper power states as in LRU-Greedy. To accomplish this, LRU-Smooth traverses the LRU queue differently than LRU-Greedy when the target device is in low-power state and activating it would violate the power budget. Specifically, LRU-Smooth goes through the LRU queue (from the LRU device to the MRU device) sending each device to the next lower power state (and eventually returning to the front of the queue, if necessary) until the set of devices in the queue consumes less power than the budget minus the power consumption of one active device. Figure 3 illustrates how LRU-Smooth works in the same scenario as Figures 1 and 2. Figures 3(a) and 3(b) are the same as in LRU-Greedy. However, as Figure 3(c) depicts, LRU-Smooth switches chips 0, 3, and 1 to powerdown, standby, and standby. These changes bring the consumption of the chips on the LRU queue to 363 mWatts. At that point, chip 2 can be inserted back, activated, and accessed, for a final consumption of 663 mWatts.
2.4 LRU-Ordered LRU-Ordered addresses the problems of LRU-Greedy and LRUSmooth at the same time. The idea is to assign low-power states evenly (as in LRU-Smooth) but avoid sending active devices to low-power mode if possible (as in LRU-Greedy and Knapsack). This is accomplished by creating an additional data structure: a priority queue (implemented as a heap) for the memory devices that are in low-power states. The queue is ordered by how shallow the power mode is; devices in shallower states are selected to go to deeper states first. For this reason, we refer to it as the “ordered” queue. The LRU queue is then reserved for active devices only.
In more detail, LRU-Ordered operates in a similar manner to LRU-Greedy and LRU-Smooth. The differences are (1) the handling of the two queues; and (2) the actions that are taken when the target device is in low-power state and activating it would violate the power budget. The handling of the queues is done in the obvious manner. When (2) occurs, the controller first moves the LRU active device to the front of the ordered queue. Then, it repeatedly sends the device at the top of the heap to the next lower power state until the overall power consumption is lower than the budget minus the power consumption of one active device. Figure 4 depicts how LRU-Ordered works in the same scenario as Figures 1, 2, and 3. Figure 4(a) shows the ordered (top) and LRU (bottom) queues when the access for chip 2 arrives, whereas Figure 4(b) shows the configuration after chip 3 is downgraded to nap state and the access is allowed to proceed. The final configuration consumes 660 mWatts and is actually optimal for this number of chips and power budget.
2.5 Performance-Aware Energy Conservation Memory energy conservation is an important goal in many environments. For example, because batteries should last as long as possible in battery-operated devices, conserving memory energy in these devices is beneficial. More interestingly, in the two IBM p670 servers measured in [21], memory power represents 19% and 41% of the total power, whereas the processors account for only 24% and 28%; conserving memory energy is key for these servers. With these different environments in mind, we should conserve as much energy as possible (beyond the conservation that comes naturally from the lower power budget), at the same time as limiting power consumption. Thus, we developed versions of our techniques that conserve additional energy, as long as doing so does not degrade performance beyond a pre-established threshold.
2.5.1 Memory Energy Conservation Our approach for conserving additional energy is simple: the memory controller is responsible for sending a device to a lower power state when the device has been idle at the current state for the state’s “break-even” time. The break-even time is defined as the time it takes for the energy consumption in the current state to equal the energy it would take to go down to the next lower power state and then immediately go up to active state. Assuming the RDRAM states and transition costs from Table 1, the break-even times for the transitions from active to standby, standby to nap, and nap to powerdown are 14 ns, 69 ns, and 3333 ns, respectively. Our energy conservation approach uses the break-even time as the transition threshold time. This same power-management approach has been used in a number of previous papers on memory energy conservation, e.g. [20, 29]. Given our approach to energy conservation, we modified our techniques as follows:
Knapsack. We modified this technique to compute (still offline) the optimal configurations for all possible numbers of active devices, i.e. from 1 to the total number of devices in the system, and store them in a table at the memory controller. However, instead of trying to minimize the average transition delay, we modified the technique to minimize the average delay ∗ power 2 , giving more importance to low power than low transition delay. (This metric should not be confused with execution-time energy ∗ delay 2 , which is often used to compare energy conservation techniques when performance is a key concern.) With the optimal configuration information, the memory controller dynamically changes configurations when the number of active devices is about to change, i.e. (1) when an active device’s transition threshold elapses and the device is about to be sent to the first low-power state; or (2) when the target device is in low-power state and activating it would not violate the power budget. In those situations, the controller looks up the best configuration for the new number of active devices and adjusts states accordingly. The adjustments are made so that the smallest possible number of state changes is performed. When activating a device would violate the budget, the basic strategy of exchanging power states is used. LRU-Greedy, LRU-Smooth, and LRU-Ordered. The small modification we made to these techniques is the same. Whenever the threshold time associated with the current state of a device expires, the new state of the device (the next lower power state) is recorded. In case of LRU-Ordered, the new state may also cause a change in the ordered queue. The energy-conserving versions of our techniques have the label “EC” appended to their names.
2.5.2 Performance Guarantee Guaranteeing a certain performance level in the context of a lessthan-peak power budget may not be possible. The reason is that the actual performance degradation experienced by an application depends on its memory access properties, on the power budget, and on the technique used to limit the power consumption. If the access properties are not ideal for the technique or the power budget is low, significant performance degradation may ensue. However, it is certainly possible to limit the performance degradation resulting from attempting to conserve additional energy to an acceptable percent threshold. The reason is that we have the option to stop trying to conserve additional energy when the degradation starts to exceed the threshold. (In contrast, we cannot stop respecting the power budget.) We created modified versions of our energy-conserving techniques for them to provide a soft performance guarantee. These versions have the label “EC-Perf” appended to their names. In detail, the performance guarantee is based on the notions of slack and epoch. The slack is the total sum of delays that the memory accesses are allowed to experience without violating the performance guarantee. For example, if the performance guarantee is G and the average memory access time without energy conservation is T , the average memory access time with energy conservation should be no worse than (1 + G)T . Note that, in our approach, delays in memory access time are assumed to translate directly into delays in end-performance. Although this is a pessimistic assumption for modern processors, it does make sure that our techniques do not violate the performance guarantee. An epoch defines a fixed-length interval (5M processor cycles in our experiments) of the application’s execution. At the start of each epoch, the available slack for the epoch is computed as the epoch’s fair share of the allowed slowdown plus any leftover slack from previous epochs. Because the state of the lists and memory devices
in the EC-Perf versions of our techniques can deviate significantly from their corresponding base versions, correctly maintaining the available slack during an epoch is a major challenge. To solve this problem, the EC-Perf versions compare the (list-processing and state-transition) overhead they incur on each memory access with the overhead that would have been incurred by their corresponding base versions. To determine the overhead of the base version, the memory controller “simulates” the lists and device states under the base version without actually performing any memory accesses or state transitions. The simulation is performed off the critical path of the access, i.e. while the corresponding memory block is being transferred on the bus. The slack is decreased by the difference between the overhead of the EC-Perf version and that of the base version. If the former overhead is higher, the slack decreases; otherwise, it increases. If the available slack ever becomes non-positive during an epoch, our techniques turn off energy conservation until the end of the epoch and send chips to their corresponding states in the simulation. When an epoch ends, we adjust transition thresholds listed in the previous subsection using the same approach as Li et al. [22]. Intuitively, if some slack is left unused at the end of the epoch, the thresholds are reduced. If not, the thresholds are increased. Our approach for providing performance guarantees is inspired by [22] but with three key differences. First, turning energy conservation off in our context does not mean keeping all devices in active state. Because we still need to respect the power budget, our techniques revert back to a configuration that does so. Second, again due to the less-than-peak budget, we need to identify the delays that are really caused by trying to conserve additional energy. Finally, our handling of epochs is different in that they correspond to fixed time periods (independent of the instructions executed by the processor) in our approach.
2.6 Complexity and Overheads Our techniques are simple to implement. Many memory controllers, e.g. [40], include low-power processors and highly integrated buffering resources. We assume that the controller resides in the processor chip, as in the Niagara processors from Sun and the Opteron processors from AMD. In terms of buffering, our techniques require enough space to store their one or two queues, each of which can have at most total memory devices entries. Knapsack and its variants also require space for storing the best state configurations, each of which has exactly total memory devices entries. For energy conservation, our techniques require a counter per device to account for the transition threshold. To provide performance guarantees, our ECPerf techniques require a counter for the available slack, a counter for the epochs, a counter for list-processing and state-transition overheads, buffer space for simulating their respective base versions, and a counter for the overhead of these versions. In terms of processing overheads, our techniques need to update their LRU queues whenever a memory access arrives for a device that is different than the last device accessed. LRU-Ordered and its variations also need to update the ordered queue, but only when a device changes power state. The overhead of these updates is a few pointer manipulations. In contrast, an access to a device in low-power state that can be activated without violating the budget also involves a few arithmetic/logic operations to verify that this is indeed the case. The techniques need to traverse their queue(s), but only when an access is directed to a device in low-power state and activating the device would violate the power budget. To provide performance guarantees, the available slack needs to be dynamically updated. Because the simulation of the base version must be
performed off the critical path of memory accesses, the controller must be capable of simulating base accesses while the cache lines are transferred on the bus. This can be done without impacting running time, since line transfers take (56 processor cycles in our RDRAM experiments) much longer than the simulation overhead. In our evaluation, we simulate all of these processing overheads in detail. In fact, we carefully assessed them by first implementing the required operations explicitly and then counting the number of x86 assembly instructions to which they translate. From this study, we found that updating a queue entry, removing a queue entry (after it has been found), and inserting a queue entry should take 6 instructions, 3 instructions, and 4 instructions, respectively. We assume that the controller can process one x86 instruction per cycle. Given these values, we find the list-processing overheads to be a small fraction of the latency of an actual (cache-line-sized) memory access. For example, for 8 chips and a 50% budget, the average number of list-processing overhead cycles per memory access is 9.0, 10.9, 11.2, and 12.9 for Knapsack, LRU-Greedy, LRUSmooth, and LRU-Ordered, respectively. When performance-aware energy conservation is being used, the average number of overhead cycles per memory access in LRU-Ordered is 15.0, again with 8 chips and a 50% budget. Thus, in the worst case for this configuration, the list-processing overheads represent a 16% increase in the average memory access latency of 92.1 processor cycles (in the absence of a power limitation, memory controller overheads, or energy conservation) in our experiments. In the most challenging configuration we study, with 16 chips and a 25% budget, the list-processing overheads increase to 21%.
3.
EVALUATION
3.1 Methodology Our evaluation is based on detailed full-system simulations using Simics [38] version 2.2.19, and our simulation code for the memory subsystem and the power-limiting techniques. We simulate an x86 in-order, single-core processor running at 2.8 GHz. The cache hierarchy is composed of two levels. The first level (L1) is a split, 2-way set associative, 64-KB cache with 32-byte lines and a 2cycle access time. The second level (L2) is a 4-way set associative, 256-KB cache with 64-byte lines and an 8-cycle access time. The Simics processor model we use only allows the L2 cache to have one outstanding miss at a time. Simulating one outstanding miss at a time exposes any memory access overheads associated with limiting power. Nevertheless, we do study the sensitivity of our results to the number of concurrent outstanding misses in Section 3.3. Because full-system simulations take extremely long to complete, each Simics run generates a trace of the memory accesses performed by an application. The trace is later used to drive detailed simulations of the memory subsystem under our different techniques. We simulate memories with 512 MBytes. Throughout most of the evaluation, we simulate RDRAM chips running at 1.6 GHz (Table 1). Each memory chip is capable of transferring 2 bytes per memory cycle, providing a peak transfer rate of 3.2 GB/s. Recall that we simulate RDRAM by default, but also discuss results for DDR2 SDRAM in Section 3.3. Based on the RDRAM manuals, we define that filling an L2 cache miss on a load from an active chip takes 130 processor cycles, when both a row and a column access are necessary. An L2 cache writeback to an active chip takes 88 processor cycles, again when both row and column accesses are necessary. These times include the 56 processor cycles required to transfer the L2 cache line on the memory bus. We simulate one open 2-KByte page per chip. In contrast with some RDRAM memory controllers, our techniques
do not transition a chip to standby state immediately after an access, since they are primarily intended to limit power consumption (rather than conserve energy). We use a set of eight applications from three types of systems: four from the MediaBench benchmarks [26], representing the workloads of hand-held devices; three from the SPEC CPU2000 benchmarks [6], representing the workloads of desktop systems; and a client-server benchmark, representing the workloads of server systems. We carefully selected the applications. The MediaBench applications we study are epic, gsdecode, gsmencode, and mpeg2encode. They are the longest-running applications in MediaBench. The SPEC CPU2000 applications are bzip2, gzip, and vortex with the train input set (running with ref input sets would have been impractical in terms of simulation time). The reason we chose these CPU2000 applications is that their behavior is similar under ref and train input sets [39]. In Section 3.3, we also study mcf, the most memory-bound application in the CPU2000 suite, to assess the behavior of our techniques in an extremely unfavorable scenario. Finally, the client-server application (called CS hereafter) comprises an Apache server and a client, each being simulated by an instance of Simics. Simics also simulates the network. The HTTP workload is the Clarknet publicly available Web-server trace. We run 30,600 requests of it to limit the simulation time and show results for the server. Our experiments simulate the applications and the operating system (Linux 2.6.8). Thus, the allocation of virtual pages to physical frames is done by Linux itself. We assign consecutive physical frames to the same chip until the chip runs out of space, moving on to the next chip after that. We study the effect of several parameters on the behavior of our techniques: the power limit, the number of memory chips, the maximum number of outstanding cache misses, the memory technology, whether memory energy conservation is enabled, whether performance guarantees are provided when conserving energy. The power limit is defined as a fraction of the range of possible power budgets. Specifically, the power limit is: percent budget ∗ maxpb +(1−percent budget)∗minpb−(paccess−pactive)∗access size, where maxpb is the maximum power budget (i.e., the peak power consumption), minpb is the minimum power budget (which is not the consumption of the powerdown state times the number of chips, because it must be possible to access at least one chip), percent budget is a value from 0 to 1, paccess and pactive are the power consumption in accessing and active states, respectively, and access size is the number of chips involved in each memory access. We study 25%, 50%, and 75% as values for the budget. In terms of the number of memory chips, we study 4, 8, and 16. These numbers cover the range from hand-held devices to small-scale servers. Although larger servers may use more than 16 chips, these systems also typically have multiple memory controllers, which limits the number of chips assigned to each controller [21]. In such a system, the budget can be partitioned between the controllers, each of which can enforce its fraction as in this paper. We scaled down the sizes of the caches that we simulate because the applications are run with relatively small inputs. With our settings, the CPU is stalled waiting for the memory subsystem in epic, gsdecode, gsmencode, mpeg2encode, bzip2, gzip, vortex, and CS for 9.9%, 2.2%, 13.6%, 2.2%, 20.6%, 2.6%, 3.5%, and 10.9% of the execution time (without limiting power or conserving energy), respectively. The same quantity for mcf is 55.5%. Our simulations fix the memory size at 512 MBytes to avoid introducing an extra parameter that is not as important as the others we study. Although this memory size may seem excessive for some of these applications, recall that we simulate the operating system (and its mapping of virtual pages to physical memory frames) as
Power Consumption Limitation (CS - 8 chips - 50% budget - LRU-O - PL-EC-Perf) 1400 1200
Power (mWatts)
1000 800 600 400 200 0 Time Limit
Max
Avg
Figure 5: Power limit, and maximum and average power.
well. In fact, for these applications and numbers of chips, the accesses are spread across all chips. However, there are always a few chips that receive a larger fraction of the accesses. For example, CS on 8 chips exhibits two chips that each receive around 29% of the accesses, whereas the other chips receive between 3% and 19% of the accesses. Bzip2 on 8 chips exhibits a similar behavior, where two chips receive 29% and 23% of the accesses, whereas the others receive between 1% and 18% of the accesses. Decreasing the memory size (while keeping the same number of chips) would have the effect of more evenly distributing the accesses across the chips. This effect is akin to increasing the number of chips (while keeping the same memory size), as we do in this paper. Our graphs refer to the techniques as Knap (Knapsack), LRU-G (LRU-Greedy), LRU-S (LRU-Smooth), and LRU-O (LRU-Ordered). We refer to the (base) versions that only limit power consumption as PL (for Power-Limited), the versions that also conserve memory energy as PL-EC (for Energy-Conserving), and the versions that limit power, conserve memory energy, and limit the performance degradation resulting from energy conservation as PLEC-Perf (for Performance). The degradation threshold was always kept at 3% in the PL-EC-Perf simulations. Because the parameter space comprises 7 dimensions (technique, variation, application, power limit, number of chips, maximum number of outstanding misses, and memory technology), we present figures for the interesting (2D) parts of the space. Finally, the two key metrics we consider are overall application performance degradation and memory energy savings. We do not model processor or system energy explicitly in our simulations. However, as the results in the next subsection demonstrate, our best power-limiting techniques degrade performance only slightly (≤ 2% in the vast majority of cases), i.e. the memory energy savings we report are a close estimate of the overall energy savings that are achievable. In fact, we can easily estimate the overall energy savings by assuming a particular breakdown between the energy consumed by the memory and the rest of the system (without a power limitation or energy conservation). If the memory represents M % of the total system energy, the memory energy savings is m%, and the degradation is assumed to be 0%, the overall system-wide energy savings is S% = M ∗ m/100.
3.2 Base Results Before getting into an extensive analysis of results, it is important to emphasize that our techniques are successful at limiting power consumption to the pre-established budget at all times and for all applications. As an example of the power consumption behavior
of applications under a power limit, Figure 5 plots the power consumption of part of the execution of CS under LRU-Ordered with performance-aware energy conservation (PL-EC-Perf), assuming 8 memory chips and a power limit of 1361 mWatts (50% budget for 8 chips). The figure plots the power limit, the maximum power consumption of each interval of 1M processor cycles, and the average power consumption during those intervals, as a function of time. During the second half of the slice illustrated in the figure, the performance slack is exhausted, causing the maximum and average power consumptions to concentrate close to the limit. Note that, in this region, there are still power state changes since the limit does not allow all memory chips to be active at the same time. We can also clearly see that the limit is never violated, despite the fact that power-state configurations changed a large number of times. Further, we observe that the average power consumption is close to the maximum consumption most of the time, suggesting that performance degradations should be small. The result for CS in Figure 6(left) shows that this is indeed the case. Performance degradation due to limiting power consumption. Figure 6 shows the performance degradation suffered by each application, as a function of different parameters. In Figures 6(left) and 6(middle), each degradation is computed with respect to an “unrestricted” execution that does not impose any limits on the power consumption, does not attempt to conserve energy (all chips are active all the time), and involves no memory controller overheads. In Figure 6(right), the degradations are computed with respect to the unrestricted execution with the corresponding number of memory chips. The set of three bars on the right of each graph presents the average across all applications. Figure 6(left) compares the performance degradation of the four techniques we study, assuming 8 chips and a 50% power budget. For all applications, Knapsack and LRU-Ordered degrade performance only slightly: less than 3% in all cases; less than 1% in all but one case (bzip2). Knapsack behaves so well because it optimizes performance within the available power budget. On the other hand, LRU-Ordered does well by achieving a similar effect; it attempts to avoid going down to deep low-power states, even if an active chip needs to be sent to a (shallow) low-power state. In contrast, LRU-Greedy and LRU-Smooth degrade performance more substantially; they can exhibit degradations as high as 76% and 67%, respectively. Surprisingly, these two techniques do poorly for the same applications (epic, bzip2, and vortex), despite the fact that they traverse their LRU queues very differently. At closer inspection, one can easily understand these results: neither technique is capable of effectively limiting average transition delays. Specifically, LRU-Greedy sends a few chips to deep power states, whereas LRU-Smooth sends more chips to shallow low-power states, including multiple active chips. Although neither technique does well, LRU-Smooth performs a little better than LRU-Greedy. Figure 6(middle) compares performance degradations as a function of the power budget for LRU-Ordered, again assuming 8 chips. As we would expect, increasing the budget decreases the degradations, since chips can stay in shallower power states. More interestingly, even with a small budget of 25%, LRU-Ordered degrades performance by less than 2.5%, except in the case of bzip2 (13% degradation). Knapsack achieves similar results, whereas LRUGreedy and LRU-Smooth exhibit significant degradations with the 25% budget (not shown). Figure 6(right) compares performance degradations as a function of the number of memory chips for LRU-Ordered, assuming a 50% budget. Interestingly, note that, in all but one case, degradations decrease as we increase the number of chips from 4 to 8, but increase when we go from 8 to 16 chips. Initially, we expected degrada-
Performance Degradation by Techniques
22%
5
Performance Degradation by Power Limits
16%
Performance Degradation by Number of Chips
4
4
67%
35%
31%
18%
3
2
1
3.5
3
Performance Degradation (%)
76%
Performance Degradation (%)
Performance Degradation (%)
3.5 20%
4
13%
2.5 2 1.5 1 0.5
0
3
gs
gsm
Knap
mpeg
bz
LRU−G
gz
vor
LRU−S
CS
avg
11%
2
1 0.5 0
epic
LRU−O
9%
1.5
0 epic
8%
2.5
gs
gsm
mpeg
25%
bz
gz
vor
50%
CS
avg
epic
75%
gs
gsm
4 chips
mpeg
bz
gz
vor
8 chips
CS
avg
16 chips
Figure 6: Performance as a function of technique (left), budget (middle), number of chips (right), and application. Energy Savings by Techniques
Energy Savings by Power Limits
50
Energy Savings by Number of Chips
70
50 45
60
40
30
20
50
Energy savings (%)
Energy savings (%)
Energy savings (%)
40
40 30 20
10
35 30 25 20 15 10
10 0
5
0 epic Knap
gs
gsm LRU−G
mpeg
bz
gz LRU−S
vor
CS LRU−O
avg
0 epic
gs
gsm
mpeg
25%
50%
bz
gz
vor
CS 75%
avg
epic 4 chips
gs
gsm
mpeg
bz
gz
8 chips
vor
CS 16 chips
Figure 7: Energy savings as a function of technique (left), budget (middle), number of chips (right), and application. tions to consistently decrease with increasing number of chips, so this result surprised us. Upon closer inspection, it becomes clear that our intuition missed the fact that a larger number of chips may result in a combination of more active chips but also more chips in powerdown state. As an example, note that the optimal Knapsack configuration for 8 chips dictates 4 active chips and 4 chips in nap state, whereas that for 16 chips dictates 8 active chips, 5 chips in nap state, and (the culprits for the performance degradation) 3 chips in powerdown state. To address this problem, we could change Knapsack to minimize delay 2 and change LRU-Ordered to include 2 (rather than 1) active chips in the ordered queue when the activation of a chip in low-power state would violate the budget. However, note that degradations are never higher than 11% even with 16 chips, so we did not pursue these changes. Knapsack exhibits similar trends and absolute degradations as LRU-Ordered (not shown). LRU-Greedy and LRU-Smooth exhibit much higher absolute degradations and the trends that we initially expected, as the increase in number of chips reduces their percentage of chips in powerdown state (not shown). Energy conservation due to limiting power consumption. Figure 7 shows the memory energy savings, as a function of different parameters. In Figures 7(left) and 7(middle), each amount of savings is computed with respect to an unrestricted execution that does not impose any limits on the power consumption, does not involve memory controller overheads, and does not attempt to conserve energy. In Figure 7(right), the savings are computed with respect to the unrestricted execution with the corresponding number of chips. Note that the savings depicted in these figures come exclusively from the less-than-peak budget. Figure 7(left) compares the energy savings achieved by the four techniques we study, assuming 8 chips and a 50% power budget. For all applications but bzip2, all techniques conserve substantial
energy; at least 34%. Knapsack and LRU-Ordered do well for bzip2, but LRU-Greedy and LRU-Smooth do not. In fact, the latter techniques also conserve noticeably less energy than the former ones for epic and vortex. The reason for these results is that LRUGreedy and LRU-Smooth increase execution time tremendously (thereby increasing overall energy consumption) for these applications and simulation parameters, as we illustrated in Figure 6(left). Figure 7(middle) compares energy savings as a function of the power budget for LRU-Ordered, again assuming 8 chips. As we would expect, increasing the budget decreases the savings, since chips can stay in shallower power states. The most interesting result here, though, is that the applications’ characteristics have a much weaker impact on the savings than the budgets do. The reason is that what really matters in terms of energy is the ratio between limited and unlimited power consumption. Knapsack behaves similarly to LRU-Ordered (not shown). LRU-Greedy and LRU-Smooth do so as well, with the only difference that savings actually increase for bzip2, as we increase the budget (not shown). This behavior differs from that of other applications and is explained by the fact that higher budgets produce substantially smaller performance degradations for bzip2 with these techniques. Figure 7(right) compares energy savings as a function of the number of chips for LRU-Ordered, assuming a 50% budget. As suggested by our comments above, the number of chips has a relatively small effect on the percentage energy savings due to the power limitation. Again, the exception to this observation is bzip2 with LRU-Greedy and LRU-Smooth, since using more chips also improves performance significantly (not shown). Performance-aware energy conservation under power limitations. First, note that our performance guarantee algorithm always limits the degradation caused by explicitly trying to conserve additional energy.
avg
Performance Degradation by Techniques Versions
Energy Savings by Techniques Versions
282%
10
100 90 80
237%
60%
66%
35%
1153% 67%
206%
32%
Energy savings (%)
Performance Degradation (%)
8
6
4
2
70 60 50 40 30 20 10
0
0 epic
gs
gsm
PL
mpeg
bz
gz
PL−EC
vor
CS
avg
epic
PL−EC−Perf
gs
gsm
PL
mpeg
bz
gz
PL−EC
vor
CS
avg
PL−EC−Perf
Figure 8: Performance (left) and energy savings (right) as a function of variation of LRU-Ordered and application. Perfomance Degradation for PL vs PD (PL) vs PL−EC−Perf vs PD (PL−EC−Perf) 8 13%
90
16%
80 6 Energy Savings (%)
Performance Degradation (%)
7
Energy Savings for PL vs PD (PL) vs PL−EC−Perf vs PD (PL−EC−Perf) 100
5 4 3
70 60 50 40 30
2 20 1
10
0
0 epic
gs
gsm
PL (25%) PD (PL)
mpeg
bz
gz
vor
CS
avg
PL−EC−Perf (25%) PD (PL−EC−Perf)
epic
gs PL (25%) PD (PL)
gsm
mpeg
bz
gz
vor
CS
avg
PL−EC−Perf (25%) PD (PL−EC−Perf)
Figure 9: Comparing the performance degradation (left) and energy savings (right) of PL, PL-EC-Perf, and PD as a function of application. The graphs assume 8 chips, a 25% power budget, and a 3% maximum degradation due to energy conservation. To assess the performance degradations with respect to unrestricted executions that impose no limits on power consumption, do not involve memory controller overheads, and do not attempt to conserve energy, consider Figure 8(left). It compares performance degradations as a function of the variations of the LRU-Ordered technique, assuming 8 chips, a 50% power budget, and a maximum acceptable performance degradation of 3%. The base version of LRU-Ordered is referred to as PL in the figure. These results show that PL causes the smallest degradation in performance, less than 1% on average. In contrast, the energy-conserving variation (PL-EC) causes tremendous performance degradation; more than 1500% in one case (bzip2). Similar dramatic degradations have been observed before when memory energy conservation is not performance-aware [22]. When a performance guarantee is imposed on the energy-conserving variation (PL-EC-Perf), degradations are reduced to the range 3-6% (recall that these results include the degradation coming from the power limitation and from trying to conserve additional energy). Knapsack exhibits similar behavior. In contrast, LRU-Greedy and LRU-Smooth exhibit high degradations for bzip2 and vortex, even under our performance guarantee (not shown). Figure 8(right) shows the energy savings that can be achieved by the variations of LRU-Ordered, assuming 8 chips, a 50% power budget, and a maximum acceptable degradation of 3%. The savings are computed with respect to the unrestricted executions. These data show that the PL-EC variation of our techniques can typically increase energy savings significantly, but only at the cost of the increased execution time as we just saw. In the case of bzip2, the
tremendous increase in execution time actually induces substantially lower savings. This effect is less pronounced for the other applications, as they exhibit lower degradations. The other techniques exhibit similar behaviors (not shown). When our performance guarantee is in place (PL-EC-Perf), the additional energy savings achieved by our techniques (only results for LRU-Ordered are shown) are significant compared to those of PL for all applications, except bzip2. As we discuss below, decreasing the budget also decreases the difference in energy savings between PL and PL-EC-Perf, as chips have to stay in the deeper power states a larger fraction of the time just to respect the budget. Comparing PL and PL-EC-Perf against state-of-the-art energy conservation. More importantly, the PL and PL-EC-Perf variations of Knapsack and LRU-Ordered can conserve at least as much energy as state-of-the-art techniques that conserve energy explicitly in the absence of a power limit, for equally small performance degradations. In particular, these techniques can match the energy savings of the latter approach by appropriately setting the power budget. To support these claims, Figure 9 compares the PL and PL-ECPerf variations of LRU-Ordered (with a 25% budget) against the best performance-aware memory energy conservation technique, the PD technique described in [22], for 8 chips. PD dynamically changes transition thresholds according to predicted access patterns and available slack. Note that there are two PD bars for each application: PD(PL) represents the execution where we allow PD to degrade performance by the same amount as PL with a 25% budget; PD(PL-EC-Perf) represents the execution where we allow PD to degrade performance by the same amount as PL-EC-Perf with a
25% budget. To achieve the best possible results for PD, we chose the epoch length that exhibits the highest energy savings on average for our set of applications, namely 50M processor cycles. The figure shows that PD(PL) achieves significant energy savings for most of the applications, 55% on average. In terms of performance, as intended, PD(PL) matches the degradation of PL in all cases, except bzip2. For bzip2, PD(PL) is unable to exploit the additional slack to conserve more energy. PL conserves more energy than PD(PL) in almost all cases, achieving 66% savings on average. Similar observations can be made when comparing PD(PLEC-Perf) and PL-EC-Perf. On average, our technique achieves 83% energy savings, whereas PD(PL-EC-Perf) produces 68% savings. In fact, PD(PL-EC-Perf) conserves only slightly more energy than PL on average, even though we allowed PD(PL-EC-Perf) a 3% degradation in performance beyond the degradation of PL. Comparing Figures 8(right) and 9(right) shows that the difference in energy savings between PL and PL-EC-Perf decreases significantly with lower budgets. The more we reduce the power budget or the maximum acceptable degradation, the more similar PL and PL-EC-Perf become. Despite their positive results, the behavior of PL and PL-ECPerf for bzip2 is a concern. For this budget of 25%, their performance degradations are clearly unacceptable. Although they conserve less energy than our techniques, PD(PL) and PL(PL-EC-Perf) exhibit better performance for bzip2 (less than 6% degradations). As we had already seen in Figure 6(middle), our techniques exhibit low performance degradations for bzip2 with power budgets higher than 25%. For higher budgets, PL and PL-EC-Perf can again behave better than PD for this application. These results demonstrate that, with an appropriately set power budget, PL and PL-EC-Perf are indeed superior to the best energy conservation techniques proposed to date. The key intuition here is that there is little point in (eventually) sending chips to very deep states, as in PD, if activating these chips a little later will consume a large fraction of the slack. The more states there are, the greater the potential problem is. In PL-EC-Perf this effect is not as pronounced because the power limit still has to be respected when the slack runs out. The better approach, as in Knapsack and LRUOrdered, is to keep chips at their “best”, deep-enough states, regardless of how long they stay there; energy conservation comes from the power limitation itself.
3.3 Additional Results Limiting power under greater concurrency in the memory subsystem. So far, our simulations assumed a maximum of 1 outstanding L2 cache miss. However, modern systems often allow multiple concurrent cache misses. To understand the effect that our techniques would have on systems with greater memory-access concurrency, we developed a new version of our simulator. Specifically, we implemented an idealized processor capable of issuing memory requests without ever stopping instruction execution, until a maximum number of outstanding misses is reached. In other words, the idealized processor is capable of completely overlapping instruction execution with cache misses until a cache miss occurs that would exceed the maximum number of outstanding misses. This behavior is equivalent to always predicting load values correctly [24]. Thus, our idealized processor exacerbates the amount of concurrency that the memory subsystem would see in reality. Using the new version of the simulator, we studied the behavior of LRU-Ordered with 8 chips and a 50% power budget, for systems with at most 1, 2, and 4 outstanding cache misses. Each degradation and savings was computed with respect to the (idealized) execution with the corresponding maximum number of outstand-
ing misses, no limits on power, and no energy conservation. Our results show that performance degradations associated with limiting power consumption are even smaller for systems with greater memory-access concurrency. For example, systems with a maximum of 4 outstanding misses exhibit less than 0.2% degradation from LRU-Ordered on average. The main reason for this result is that an increasing fraction of the overheads of limiting power consumption, namely controller and state-transition overheads, can be overlapped as we increase the maximum number of outstanding misses. Interestingly, the energy savings associated with limiting power are almost unaffected by systems with greater memoryaccess concurrency. The reasons are that all degradations are very small and, most importantly, the energy savings are dominated by the power budget, as we saw in Figure 7. Limiting power under high memory boundness. The applications we studied so far place light or moderate demands on the memory subsystem. To assess the behavior of our techniques for applications that are highly memory-bound, we studied mcf, the most memory-bound application in the CPU2000 suite. As one would expect, limiting the power consumption of a highly memorybound application to a low budget results in high performance degradations, especially when the number of chips is large. Specifically, assuming 8 memory chips and a maximum of 1 outstanding miss, mcf exhibits degradations of 23%, 8%, and 5% for budgets of 25%, 50%, and 75%, respectively, compared to the unrestricted execution of mcf. Despite the high performance degradation for a budget of 25%, LRU-Ordered can still achieve an energy savings of 54%. For a budget of 50%, LRU-Ordered conserves 36% energy, which is still quite significant. The EC-Perf version of LRUOrdered is not able to conserve more energy (with an acceptable degradation of 3%) than the base version. The impact of DDR SDRAM technology. To demonstrate the generality of our techniques, we applied them to DDR2 SDRAM. Specifically, we modeled DDR2 with five power states, namely accessing, active standby, pre-charge quiet, pre-charge powerdown, and self-refresh [34]. The power consumptions and transition overheads also came from [34]. We simulated memory subsystems with 2 and 8 ranks, where each rank corresponds to 8 chips that are accessed and power-managed together. The 2-rank scenario is particularly challenging, since the memory controller has little room to manage power states, i.e. any access to a different rank requires a state change. Nevertheless, the 2-rank simulations show that the performance degradations resulting from LRU-Ordered are only slightly higher, on average, than under RDRAM. For example, the DDR2 performance degradations are 3.2%, on average, with a budget of 50% and a maximum of 1 outstanding miss. An RDRAM memory subsystem with the same number of chips, a budget of 50%, and a maximum of 1 outstanding miss leads to a degradation of 3%, on average. Despite its slightly higher performance degradations under DDR2, LRU-Ordered still conserves 41% of the energy of the unrestricted execution, on average. The equivalent measure for the comparable RDRAM memory subsystem is 45%. In contrast, the 8-rank simulations show that LRU-Ordered exhibits an average performance degradation of 0.6% and an average energy savings of 43%, again assuming a budget of 50% and a maximum of 1 outstanding miss.
3.4 Summary Several interesting observations can be made from these results: • Knapsack and LRU-Ordered are clearly the best techniques for limiting power consumption. The choice between these two techniques comes down to the characteristics of the en-
vironment, such as the frequency with which one expects in-the-field changes to the power budget and the number of memory chips. LRU-Greedy and LRU-Smooth generate high overheads in most of the parameter space. • With good techniques for limiting power, the resulting performance degradations are very small for applications that impose light or moderate requirements on the memory subsystem, even for low budgets. Highly memory-bound applications require correspondingly high budgets for good performance. • The very fact that power consumption is limited translates into significant energy savings. Attempting to conserve additional energy without excessive performance degradation may require a high budget. • When using good techniques, limiting power consumption is at least as effective an energy-conservation approach, as doing (performance-aware) energy conservation explicitly. • Given the energy benefits of limiting power consumption, the power budget dominates all other parameters, including application characteristics, in determining how much energy can be conserved. • The number of memory chips and the characteristics of applications have a significant impact on the performance of the techniques for limiting power. The impact is not as high on the energy savings. • The maximum number of outstanding cache misses does not have a significant effect on the performance degradation or energy savings that our techniques produce. • Our good techniques work well for DDR2 on average, even when the number of memory ranks is small.
4.
RELATED WORK
Our work touches three main areas: limiting power consumption, managing temperature, and memory energy conservation. Next, we overview the related works in each of these areas. Limiting power. Felter et al. [10] were the only ones to consider limiting the power consumption of the memory subsystem. They proposed to continuously re-budget the available power between the processor and the memory subsystem. Their base powercontrol mechanism was a throttling scheme that limits the number of operations performed by each subsystem (instruction dispatches and memory accesses) during an interval of time; once the threshold number of operations in reached, no additional operations are performed until the next interval. Improperly selecting the interval length may cause power budget violations and unnecessary performance degradation. In [1], the authors proposed Energy per Instruction (EPI) throttling for chip multiprocessors (CMPs), as a way to minimize the execution times of multithreaded applications while limiting the power consumed by the CMP. As their base power-control mechanism, the authors used clock throttling of each processor core to manage its duty cycle. During periods of low thread-level parallelism, the CMP can spend more EPI by running the available thread(s) on fewer cores, each of which at a higher duty cycle. Conversely, during periods of high thread-level parallelism, the CMP should spend less EPI by running on more cores, each of which at a lower duty cycle.
In [18], the authors considered scaling the voltage/frequency of each core of a chip multiprocessor independently to enforce a chiplevel power budget. Power mode assignments are re-evaluated periodically by a global power manager, based on the performance and average power consumption observed in the most recent period. Our work differs from these contributions in that we focus on the memory subsystem, limit the power consumption strictly by dynamically changing memory device states (rather than limiting the number of memory accesses during an interval), and combine the power limitation with explicit energy conservation. For clusters of computers, [11, 32] used CPU voltage/frequency scaling at each node and a cluster-wide controller to limit the power consumption of the entire system. In both works, the controller was responsible for deciding how much of the power budget to assign to each node. Fan et al. [9] assessed the power consumption of data centers under different workloads and the potential benefits of limiting power consumption. Our work differs from these three studies as we focus on standalone computers from hand-helds to servers. For clusters and data centers, coarser-grained approaches that limit the power consumption across multiple computers may indeed be more appropriate than doing so on a per-server level. Still, per-server techniques may be used in guaranteeing that each server does not exceed its assigned fraction of the budget. Managing temperature. Researchers have considered dynamic thermal management of processors [2, 3, 4, 14, 17, 23, 27, 30, 33, 35, 36, 37], disks [12, 19], and data centers [13, 5, 28]. Most of these contributions apply throttling, dynamic voltage/frequency scaling, and/or activity migration when temperatures exceed some pre-established threshold. Although these works are related to our approach of limiting power consumption, they all assume that the supply of power is provisioned to withstand the peak power consumption of the different subsystems. However, there are several types of scenarios in which such an assumption cannot be made. For example, the supply of power may be limited (as in hand-held devices), expensive to over-provision (as in data centers), or can be reduced due to unit failures (as in blade systems with multiple power supplies). Our work targets these types of scenarios. Conserving memory energy. Several previous works have sought to conserve memory energy [7, 8, 15, 16, 20, 22, 29, 41]. These papers mainly address techniques for intelligently setting idleness thresholds, and data layout techniques for increasing the achievable energy savings. In particular, some works [15, 16, 20, 29] have considered page layouts that concentrate accesses on a subset of chips. We did not consider these layouts; doing so would have made it easier for our techniques to limit power with little performance degradation. Instead, we focused on the more challenging scenario that uses Linux’s own virtual/physical page mapping. Previous works have cast memory energy conservation as an MCKP [22, 42]. Our Knapsack technique was also formulated as an MCKP. However, our formulation differs substantially from previous works. For example, the PS algorithm in [22] seeks to minimize energy under a performance constraint, whereas Knapsack seeks to minimize performance degradation under a power constraint. Furthermore, PS is epoch-based and keeps all chips at statically defined power states during each epoch. The EC-Perf version of Knapsack also uses epochs, but does not restrict chips to specific power states. The base version of Knapsack does neither. Overall, our techniques differ from these previous contributions as they primarily seek to limit power consumption; they try to conserve additional memory energy in the context of this hard limit.
More fundamentally, our work demonstrates that limiting power consumption can actually be used as a very effective means of conserving energy.
5.
CONCLUSIONS
In this paper, we studied four techniques for limiting the power consumption of the memory subsystem: Knapsack, LRU-Greedy, LRU-Smooth, and LRU-Ordered. We also studied variations of the techniques that attempted to conserve energy explicitly and to limit the resulting performance degradation of doing so. Finally, we studied the impact of different parameters on the behavior of the techniques and variations. Our simulation-based evaluation led us to a number of interesting observations (Section 3.4). One important observation is that Knapsack and LRU-Ordered are clearly superior to the other techniques. Another important (and fundamental) observation is that, using these superior techniques, limiting power consumption is at least as effective for energy conservation as state-of-the-art techniques explicitly designed for performanceaware energy management. It is important to emphasize: it is not surprising that limiting power consumption also conserves energy; what is surprising is that power consumption can be limited with small enough performance degradation over a wide parameter space to make it better than techniques explicitly designed to conserve energy without excessive performance degradation. Thus, a major advantage of using our power-limiting approach is that we can limit power consumption and conserve substantial energy at the same time. Limitations and future work. So far, we have not considered multiprogramming workloads or different policies for allocating pages to memory chips. In addition, although we did study the effect of greater concurrency in memory accesses in the context of the number of outstanding cache misses, we have not explicitly considered chip multiprocessors. Finally, we presented a parameter space study of the behavior of our techniques, but did not consider how to select the ideal power budget in different scenarios. Addressing these limitations is the focus of our future work.
Acknowledgements We would like to thank Luiz Barroso, Eugene Gorbatov, Partha Ranganathan, the members of the Vice-Versa seminar, and the anonymous referees for comments that helped improve this paper.
6.
REFERENCES
[1] M. Annavaram, E. Grochowski, and J. Shen. Mitigating Amdahl.s Law Through EPI Throttling. In Proceedings of ISCA, June 2005. [2] F. Bellosa, S. Kellner, M. Waitz, and A. Weissel. Event-Driven Energy Accounting of Dynamic Thermal Management. In Proceedings of COLP, September 2003. [3] D. Brooks and M. Martonosi. Dynamic Thermal Management for High-Performance Microprocessors. In Proceedings of HPCA, January 2001. [4] P. Chaparro, G. Magklis, J. Gonzalez, and A. Gonzalez. Distributing the Frontend for Temperature Reduction. In Proceedings of HPCA, February 2005. [5] J. Choi, Y. Kim, A. Sivasubramaniam, J. Srebric, Q. Wang, and J. Lee. Modeling and Managing Thermal Profiles of Rack-Mounted Servers with ThermoStat. In Proceedings of HPCA, February 2007. [6] Standard Performance Evaluation Corporation. Spec2000. http://www.spec.org. [7] V. Delaluz, M. Kandemir, N. Vijaykrishnan, A. Sivasubramaniam, and M. J. Irwin. Hardware and Software Techniques for Controlling DRAM Power Modes. IEEE Transactions on Computers, 50(11), 2001. [8] X. Fan, C. Ellis, and A. Lebeck. Memory Controller Policies for DRAM Power Management. In Proceedings of ISLPED, August 2001. [9] X. Fan, W.-D. Weber, and L. A. Barroso. Power Provisioning for a Warehouse-sized Computer. In Proceedings of ISCA, June 2007. [10] W. Felter, K. Rajamani, T. Keller, and C. Rusu. A Performance-Conserving Approach for Reducing Peak Power Consumption in Server Systems. In Proceedings of ICS, June 2005.
[11] M. Femal and V. Freeh. Boosting Data Center Performance Through Non-Uniform Power Allocation. In Proceedings of ICAC, June 2005. [12] S. Gurumurthi, A. Sivasubramaniam, and V. Natarajan. Disk Drive Roadmap from the Thermal Perspective: A Case for Dynamic Thermal Management. In Proceedings of ISCA, June 2005. [13] T. Heath, A. P. Centeno, P. George, Y. Jaluria, and R. Bianchini. Mercury and Freon: Temperature Emulation and Management in Server Systems. In Proceedings of ASPLOS, October 2006. [14] S. Heo, K. Barr, and K. Asanovic. Reducing Power Density Through Activity Migration. In Proceedings of ISLPED, August 2003. [15] H. Huang, P. Pillai, and K. G. Shin. Design and Implementation of Power-Aware Virtual Memory. In Proceedings of USENIX, June 2003. [16] H. Huang, K. Shin, C. Lefurgy, K. Rajamani, T. Keller, E. Hensbergen, and F. Rawson. Co-operative Software-Hardware Power Management for Main Memory. In Proceedings of PACS, December 2004. [17] M. Huang, J. Renau, S-M. Yoo, and J. Torrellas. A Framework for Dynamic Energy Efficiency and Temperature Management. In Proceedings of Micro, December 2000. [18] C. Isci, A. Buyuktosunoglu, C.-Y. Cher, P. Bose, and M. Martonosi. An Analysis of Efficient Multi-Core Global Power Management Policies: Maximizing Performance for a Given Power Budget. In Proceedings of Micro, December 2006. [19] Y. Kim, S. Gurumurthi, and A. Sivasubramaniam. Understanding the Performance-Temperature Interactions in Disk I/O of Server Workloads. In Proceedings of HPCA, February 2006. [20] A. R. Lebeck, X. Fan, H. Zeng, and C. S. Ellis. Power-Aware Page Allocation. In Proceedings of ASPLOS, November 2000. [21] C. Lefurgy, K. Rajamani, F. Rawson, W. Felter, M. Kistler, and T. W. Keller. Energy Management for Commercial Servers. IEEE Computer, 36(12), December 2003. [22] X. Li, Z. Li, F. M. David, P. Zhou, Y. Zhou, S. V. Adve, and S. Kumar. Performance-Directed Energy Management for Main Memory and Disks. In Proceedings of ASPLOS, October 2004. [23] Y. Li, D. Brooks, Z. Hu, and K. Skadron. Performance, Energy, and Thermal Considerations for SMT and CMP Architectures. In Proceedings of HPCA, February 2005. [24] M. Lipasti, C. Wilkerson, and J. Shen. Value Locality and Load Value Prediction. In Proceedings of ASPLOS, October 1996. [25] S. Martello and P. Toth. Knapsack Problems: Algorithms and Computer Implementations. Wiley, 1990. [26] MediaBench. Mediabench. http://cares.icsl.ucla.edu/MediaBench/. [27] A. Merkel and F. Bellosa. Balancing Power Consumption in Multiprocessor Systems. In Proceedings of Eurosys 2006, April 2006. [28] J. Moore, J. Chase, P. Ranganathan, and R. Sharma. Making Scheduling Cool: Temperature-Aware Resource Assignment in Data Centers. In Proceedings of USENIX, April 2005. [29] V. Pandey, W. Jiang, Y. Zhou, and R. Bianchini. DMA-Aware Memory Energy Management. In Proceedings of HPCA, February 2006. [30] M. Powell, M. Gomaa, and T. N. Vijaykumar. Heat-and-Run: Leveraging SMT and CMP to Manage Power Density Through the Operating System. In Proceedings of ASPLOS, October 2004. [31] Rambus. RDRAM. http://www.rambus.com. [32] P. Ranganathan, P. Leech, D. Irwin, and J. Chase. Ensemble-Level Power Management for Dense Blade Servers. In Proceedings of ISCA, June 2006. [33] E. Rohou and M. D. Smith. Dynamically Managing Processor Temperature and Power. In Proceedings of FDO, November 1999. [34] Samsung. 512Mb E-die DDR2 SDRAM Specification. http://www.samsung.com/Products/Semiconductor/DDR DDR2/DDR2SDRAM/Component/512Mbit/K4T51083QE/ds k4t51xx3qe rev14.pdf. [35] L. Shang, L.-S. Peh, A. Kumar, and N. Jha. Characterization and Management of On-Chip Networks. In Proceedings of Micro, December 2004. [36] K. Skadron, M. Stan, W. Huang, S. Velusamy, K. Sankaranarayanan, and D. Tarjan. Temperature-Aware Microarchitecture. In Proceedings of ISCA, June 2003. [37] J. Srinivasan, S. Adve, P. Bose, and J. Rivers. The Case for Lifetime Reliability-Aware Microprocessors. In Proceedings of ISCA, June 2004. [38] Virtutech. Simics. http://www.simics.net. [39] J. J. Yi, S. V. Kodakara, R. Sendag, D. J. Lilja, and D. M. Hawkins. Characterizing and comparing prevailing simulation techniques. In Proceedings of HPCA, February 2005. [40] L. Zhang, Z. Fang, M. Parker, B.K. Mathew, L. Schaelicke, J.B. Carter, W.C. Hsieh, and S.A. McKee. The Impulse Memory Controller. IEEE Transactions on Computers, Special Issue on Advances in High-Performance Memory Systems, November 2001. [41] P. Zhou, V. Pandey, J. Sundaresan, A. Raghuraman, Y. Zhou, and S. Kumar. Dynamic Tracking of Page Miss Ratio Curve for Memory Management. In Proceedings of ASPLOS, October 2004. [42] Q. Zhu and Y. Zhou. Power-Aware Storage Cache Management. IEEE Transactions on Computers, 54(5), 2005.