Listen to your Heart Rate: Counting the Cost of Media Quality Gillian M. Wilson and M. Angela Sasse Department of Computer Science University College London Gower Street London, WC1E 6BT
[email protected] [email protected]
Abstract Networked multimedia applications, such as videoconferencing, offer great communicative opportunities. Since the financial cost of using such a service increases in line with the quality of the audio and video delivered, it is important to have assessment methods to accurately determine the level of quality a user group requires for a particular task. Currently, subjective rating scales are mainly used to assess whether multimedia quality is sufficient for a particular task, but this method alone has drawbacks. We argue that objective methods of user cost (such as stress) should be taken into account, and examine users’ physiological responses to determine the impact of different levels of multimedia quality on the user. The aims of this research are 1) to determine the optimum and minimum levels of quality which different users require for performing different tasks without significant user cost; and 2) to produce a utility function which will allow systems to adapt according to physiological responses from the user.
1
Introduction
Th number of networked multimedia applications, like multimedia conferencing (MMC), is increasing constantly. MMC facilitates communication between two or more users through audio, video and shared workspace tools in real time. Thanks to improvements in networks and computer hardware, it is widely available – even over the Internet. MMC is seen as a valuable tool for many areas, including distance learning and distributed project collaboration. It is technically possible to offer users audio and video of a high quality – at a price. Higher quality inevitably means increased financial cost for the user, who will not want to pay more than necessary for their communications. Thus, the levels of media quality at which users can complete their task effectively and comfortably are essential information for network providers and application designers. At present, the most common way of assessing multimedia quality is through subjective assessment. However, relying on subjective assessment alone has drawbacks. Therefore, this paper proposes the addition of a new method to assess the quality of networked applications: to measure physiological responses linked to stress in response to media quality. If users are experiencing stress as a result of insufficient
media quality, this should be considered as increased user cost. In the traditional Human Computer Interaction (HCI) framework for usability evaluation, user cost is considered together with task performance and user satisfaction, and we argue that all three measurements should be taken when assessing media quality thresholds. In addition, there is the possibility of feeding real-time physiological data into an application such as videoconferencing, which could then respond by increasing quality if the user was under stress, thus providing an ‘affective’ interaction between the computer and user.
2
Assessment of Media Quality
The ITU (International Telecommunications Union) subjective rating scales is the most widely used tool for assessing quality in networked multimedia applications. Assessments involve playing a short section of material, after which a 5-point quality/impairment rating scale is administered and a Mean Opinion Score (MOS) calculated. However, recent findings have raised concerns about the validity of this method in evaluating multimedia speech [24], and video. The main problems are: •
• • •
•
The scales are one-dimensional and therefore treat quality as being as a unidimensional phenomenon. This is questionable since there are many factors which are recognised to contribute to users perception of audio [12] and video [10] quality. The scales were designed to rate toll-quality audio and broadcast-quality video, but network audio and video are subject to different types of impairments. The scales are mostly concerned with determining if a viewer/ listener can detect a particular degradation in quality, whereas with MMC it is more important to determine if the quality is good enough for the task. The short duration of the materials is not representative of the changes in quality a user may experience with network audio and video. (The ITU has addressed this recently by introducing a dynamic rating scale (ITU- BT 500-8)[11] for networked multimedia assessment. ) The vocabulary on the scales (Excellent, Good, Fair, Poor, Bad) is unrepresentative of MMC quality and the scales are not interval in many languages, therefore scores obtained can be misleading.
Researchers have tried to address these to problems through unlabelled rating scales [23]; studies showed that users were consistent in their quality ratings using the scale. A dynamic software version of this scale has been developed, (QUality ASsessment Slider- QUASS), which facilitates the continuous rating of the quality of a multimedia conference [3]. The drawback with this method is that continuous rating of quality can interfere with the user’s primary task. But while specific problems associated with the scales may be addressed in this way, there are more fundamental problems associated with subjective assessment in general: users’ subjective assessments are cognitively mediated. For example, it was discovered that users accepted significantly lower levels of media quality when
financial cost was attached: the accepted quality levels were below the threshold previously established as necessary for the task [2]. Another example of cognitive mediation was given by Wilson & Descamps [26], who showed that the level of task difficulty can affect the rating given to video quality: the same video quality received a lower quality rating when users found the task difficult. Therefore, it can be concluded that users may not always be able to accurately determine/judge the quality they need to complete a particular task when contextual variables are operating. Knoche et al.. [13] argue that subjective methods are fundamentally flawed since it is not possible for people to register what they do not consciously perceive. They recommend that task performance should be used to determine whether a particular level of media quality is sufficient. In line with the traditional HCI approach to assessing usability, we argue that some measure of user cost needs to be considered together with task performance and subjective assessment.
3
Objective Measures of Users’ Responses to Quality
We set out to investigate the use of objective methods to identify when inadequate media quality is causing some type of user cost. The notion of user cost has been neglected in media quality assessment. As a starting point, we wanted to investigate if media quality could induce physiological responses commonly linked stress. Stress is a disruption in the homeostasis of an individual due to disagreeable stimuli. If a user is performing a task with low quality audio and video, he/she must expend extra effort at the perceptual level in order to decode the information. If the user has difficulty in decoding this information, then they should experience discomfort or stress, even if they can still complete their task. It is likely that any effect on task performance and user satisfaction would only arise in the long-term, as people may not realise that they are under stress in short lab-based experiments when engaged in a task (see section 6.2). Stress is being examined for the following reasons. Firstly, it is an instant, unconscious and automatic mechanism that is not under the influence of cognitive mediation. Secondly, its measurement physiologically does not interfere with task completion. Thirdly, stress is widespread in the workplace, thus any attempt to reduce its amount is beneficial. Finally, stress can have a very negative impact on people, especially those who suffer from chronic stress. Such prolonged stress can give rise to illness by having an impact on the immune system.
3.1 Measuring Stress To measure stress, the following signals have been adopted: Blood Volume Pulse (BVP), Heart Rate (HR) and Galvanic Skin Resistance (GSR). These signals were chosen as they are unobtrusive, are good indicators of stress and are easy to measure with specialised equipment (see section 3.3). The nervous system of humans is separated into the central nervous system (CNS) and the peripheral nervous system (PNS). The PNS comprises the somatic nervous
system (SNS) and the autonomic nervous system (ANS). These both interact with the CNS. The function of the SNS is to carry the messages to and from the muscles controlling the skeleton, whereas the ANS carries messages to and from the body’s internal organs. It is the ANS that is concerned with the regulation of internal structures, which are ***smooth muscle, i.e. in blood vessels and skin, heart muscle and glands. Autonomic indicates that the system is self-regulating, which means that most of its structures are not under conscious control. The ANS is divided into the sympathetic and the parasympathetic divisions. The sympathetic division activates the body’s energetic responses. When faced with a stressful situation the CNS will make the conscious decision whereas the ANS immediately mobilises itself without the need for conscious instruction. This is often refereed to as the ‘fight or flight’ response [5]. The sympathetic division prepares the body for action by e.g. speeding up the heart rate, dilating the walls of the blood vessels to speed up blood flow to the limbs and releasing glucose into the bloodstream for energy. These actions are reinforced by the endocrine system because sympathetic nerves also directly stimulate the adrenal glands to release adrenaline. When the stressful situation has passed, the parasympathetic division takes over to restore the body’s balance. The purpose of this is to conserve the body’s resources. Therefore it prompts salivation and gastric movements and encourages blood flow to the gastrointestinal system and storage of glucose by the liver.
3.2 Physiological responses under stress Heart rate is viewed as a valuable indicator of a person’s overall activity level, with a high heart rate being associated with an anxious state, and vice versa [8]. Seyle [20] linked GSR to stress and ANS arousal. GSR is also known to be the fastest and most robust measure of stress [4], with an increase in GSR being associated with stress. BVP is an indicator of blood flow: the BVP waveform exhibits the characteristic periodicity of the heart beating: each beat of the heart forces blood through the vessels. The overall envelope of the waveform pinches when a person is startled, fearful or anxious, thus a decrease in BVP amplitude is indicative of a person under stress and vice versa. Under stress, HR rises in order to increase blood flow to the working muscles, thus preparing the body for the ‘fight or flight’ response. GSR increases under stress: the precise reason this happens is not known. One theory is that it occurs in order to toughen the skin, thus protecting it against mechanical injury [25] as it has been observed that skin is difficult to cut under profuse sweating [6]. A second theory is that GSR increases to cool the body in preparation for the projected activity of ‘fight or flight’. BVP decreases under stress. The function of this is to divert blood to the working muscles in order to prepare them for action. This means that blood flow is reduced to the extremities like a finger or a toe.
3.3 Capturing physiological responses The equipment being used to measure the physiological responses is called the ProComp and is manufactured by Thought Technology Ltd. [21]. It can monitor up to eight channels simultaneously, thus the option is there for this research to build on the measure set currently being used. Additionally, the ProComp can be used for biofeedback (see section 7.2). In order to measure GSR, two silver-chloride electrodes are placed on adjacent fingers and an imperceptible small voltage is applied. The skin’s capacity to conduct the current is measured. The technique of photoplethysmography is used to measure HR and BVP. This involves a sensor being attached to a finger or a toe. The sensor applies a light source and the light reflected by the skin is measured. At each contraction of the heart, blood is forced through the peripheral vessels, which produces an engorgement of the vessel under the light source. Thus, the volume and rate at which blood is pumped through the body are detected.
4
Research Questions
There are many issues to be tackled in the course of our research. Firstly, what aspects of objective quality delivered can be stressful? Factors affecting audio and video quality due to the network, like packet loss, will be investigated along with variables dependent on the end system, such as the color depth of video. Secondly, how can stress and emotions, such as excitement about the situation or task, be separated in an experiment? This is a problem, as the physiological patterns accompanying emotions have not been mapped [4], yet recent research at MIT showed that the physiological responses of eight emotions can be distinguished between with 80% accuracy [22], which is an encouraging result. However, in the experiments used in this research, we need to ensure that any stress observed is due to the quality, as opposed to any other factors. To address this we use the following methods: • • • •
Baseline responses are measured for fifteen minutes prior to any experimentation so that a ‘control’ set of data is available with which to compare responses under quality levels, and to allow the sensors and measurements to settle down. The first five minutes of physiological responses in experiments are discarded in order to ensure that the change from baseline measurements being taken to the experiment commencing is not affecting results. The environment of the experiment is held constant to ensure that events, such as the phone ringing, are not affecting users. The tasks used are carefully designed to ensure that they are not overly stressful, yet remain engaging.
Thirdly, what physiological values indicate that a user is under stress? The responses that are significantly different from the baseline measurements and in the direction of stress are taken to indicate that the user is under stress. This accounts for
the fact that everyone has different physiological responses and baseline values. To cross-validate results, we collect subjective assessment of user cost to determine if the participants felt under stress during the experiment. Fourthly, can stress ever be viewed as beneficial to performance? It has been found that stress, in some situations, can actually enhance performance e.g. by improving memory due to the facilitating effects of adrenaline [14]. Therefore, it could be argued that stress might be beneficial in a working environment. However, a technology which is used every day and induces stress is not usable: people cannot function effectively under stress for a prolonged period and it can actually be harmful to the body (section 3) and performance e.g. prolonged stress can devastate explicit memory [14]. Fifthly, how is stress related to emotions? This question is one which is under contentious debate at present, yet for our research this is not of paramount importance. Whilst it is a very significant and interesting issue, we are more concerned with the physiological detection of stress and the implications this has for media quality requirements: determining if it is an emotion is not critical for this purpose. Finally, is this a reliable way to measure user cost? Only further research will provide the answer.
5
Affective Computing
Affective computing is a field currently attracting interest. The term refers to computing that is “related to, arises from or deliberately influences emotions” [17]. The main focus is to create computer systems that can identify, comprehend and even ‘have’ human emotions, as it is now accepted that emotions are critical in activities such as decision making, perception and learning. Research into building computers with these attributes is being conducted at the Media Laboratory of MIT (Massachusetts Institute of Technology). The main area of relevance of Affective Computing to this research is in the area of sensing human emotions. Researchers in the Media Lab, i.e. [18], are attempting to build wearable computers using discrete lightweight sensors that can be worn for long periods of time without discomfort. Such a development would be extremely beneficial to this research, as it would allow the long-term monitoring of users physiological responses in field trials in an inconspicuous manner. Additionally, it would allow the computer to obtain continuous physiological information on the state of the user upon which it could then act (see section 7). Importantly, the research being conducted at MIT is promoting the use of physiological measurements as indicators of stress.
6
Experimental Data
6.1 Pilot Trial As a starting point to our research, a small pilot trial was conducted to determine if it would be possible to detect poor audio quality physiologically. Participants listened to audio segments that had varying loss rates. GSR, BVP and HR were measured throughout the trial. We hypothesised that HR and GSR would be highest, whereas BVP would be lowest in the condition with the worst loss rates, thus indicating stress. It was not valid to perform statistical analyses, as there were only six participants. However, the mean responses showed that GSR and HR responded in the predicted direction, whereas BVP did not. It is thus possible to obtain physiological responses to poor audio quality from at least two of the signals being used. However, would statistically significant results arise in a full experiment, and do they apply to video quality?
6.2 Full Experiment Audio quality is generally more important than video [19] in MMC. This, combined with the fact that providing high-quality video is significantly more expensive than providing high-quality audio, may lead application developers and service providers to opt for lower frames rates. The can point to Anderson et al.. [1] who found that users did not register the difference between 12 and 25 video frames per second (fps) on an engaging task. Users did not notice the change in frame rate in their subjective assessment, and it had no effect on task performance. However, O’Malley et al.. [16] found that the same difference is noticed when the data are short video clips played isolation. If users do not notice the difference in frame rate when engaged in a task, does this imply that it has no effect on them? Such a finding would have positive implications for the saving of bandwidth. To investigate this issue, an experiment looking at two frame rates, 5 and 25 fps (increasing the quality difference used in [1]) was conducted. Twenty-four participants watched two recorded interviews conducted using IP (Internet Protocol) videoconferencing tools on a high-quality computer screen. The interviews were between a university admissions tutor and school pupils, who played themselves in scripted interviews. The script was designed with the assistance of an admissions tutor and aimed to emulate common exchanges of information in such interviews, whilst keeping the content minimally stressful. The interviews lasted fifteen minutes each. Participants saw two interviews at 5-25-5fps or 25-5-25fps, where each frame rate was held for five minutes, and were asked to make a judgement on the suitability of the candidates. The frame rate changed twice to ensure that no expectancy effect would arise. Audio quality was good and did not change.
Participants rated the audio/video quality using the QUASS tool. After the interviews a questionnaire was administered. This addressed how participants felt during the experiment and their opinions on the quality. Physiological measurements were taken throughout the experiment. We posited the following hypotheses: 1. There will be different physiological responses to the two frame rates: 5fps will cause more stress. 2. Participants will not register the frame rate change subjectively.
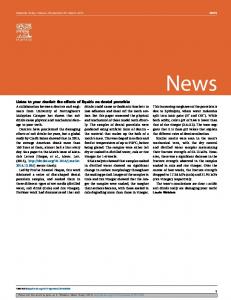
Mean beats per minute
T-tests were performed on the physiological data: 75% of participants mean GSR, HR and BVP showed a statistically significant increase in stress at 5 fps (GSR, p=0.002; HR, p=0.003; BVP, p=0.04). Figure 1 shows the mean heart rate of one participant over three frame rates. There was no statistically significant correlation between subjective (QUASS) and physiological responses. In addition, questionnaire analyses showed that only 16% of participants noticed that the frame rate had changed. Thus, both hypotheses were supported. These results are important as they indicate than when people are engaged in a task, they say they do not notice the difference between two different frame rates during or after the task, however the difference is registered physiologically. This implies that high frame rates should be provided in order to reduce user cost. In addition, acceptable quality levels required for a task and those which result in unacceptable user cost should not be determined by subjective assessment alone: we recommend that objective data is also collected.
79 78 77 76 75 74 73 72 71 70 5
25
5
Frame Rate
Fig. 1. Graph showing the mean heart rate of one participant over three frame rates
7
Conclusions and Future Work
Traditional HCI approaches to evaluation recommend that task performance, user satisfaction and user cost should be considered: we feel that in the evaluation of media quality this is particularly appropriate. This paper has shown that 1) media quality does impact physiological responses 2) subjective assessments used in isolation do not give a true indication of the impact of quality upon the user 3) user cost should be included in multimedia quality evaluation and in wider areas such as
product assessment. The research detailed in this paper will produce three substantive contributions: •
•
•
The optimum and minimum levels of some parameters of multimedia quality required for users performing tasks without significant user cost will be determined. This will aid network providers in determining resource allocation and will ultimately benefit the end-user, as their needs will be more clearly specified. This research feeds directly into the ETNA Project (Evaluation Taxonomy for Networked Multimedia Applications) [7], which aims to produce a taxonomy of real time multimedia tasks and applications. The maximum and minimum audio/video quality thresholds for a number of these tasks will also be determined. This will assist network providers and application designers, as guidelines of users’ quality requirements for specific tasks will be provided. A utility curve, a mechanism by which the network state can be directly related to the end-user, will be created. This will allow the application to receive feedback on the user. Wearable computers would be useful here to feed physiological information into an application like MMC. If the application detected that the user was under stress, it would adjust the variable of the multimedia conference causing stress in order to increase user satisfaction. If the network could not supply the optimum level of quality, then the utility curve would be consulted to provide the next best quality level and so on. If no suitable level of quality could be provided due to e.g. network congestion, the application would then inform the user and end the session. It is likely that the user would be placed under too much stress by such poor quality levels and this would ultimately affect task performance and user satisfaction. Thus, the application would be taking into account the physiological state of the user and providing an ‘affective interaction’.
Finally, a methodological contribution will be made: guidelines on the most appropriate physiological measurements to indicate a particular impairment in quality will be produced. This will pave the way for much needed further research in this area. 7.1 Moving the Research into the Field Customer service is cited as the key to the successful company of the future. The call centre industry is currently experiencing a boom, yet customers’ perceptions of services by telephone are declining. Thus, it is vital that fast accurate information with prompt solutions is provided to the customer and that a good customer relationship is formed. However, the fact that there is a 30% annual turnover in call centre staff indicates that the job can be stressful and repetitive. How can such a job be improved for the employees so that the effects ultimately pass down to the customers? Recent research at Bournemouth University looked at how elements that motivate customer services employees can be incorporated into the computer desktop. Subsequently, the MUI (Motivational User Interface) was developed between
Bournemouth University and British Telecom (BT) Bournemouth 150 call centre [15]. The MUI allows call centre operators to: • • • • •
personalize their workspace lets them know how busy they are gives them the ability to effectively manage customer information in the format in which the customer sees it incorporate elements of moral support and teamwork unleash their frustration
We are currently in discussions with BT about the possibility of utilising physiological measurements, which could include muscular-skeletal stress, in two areas. Firstly, as a method to evaluate the interface and secondly to feedback physiological data into the application. Physiological stress would be detected and measures of user satisfaction and task performance would be administered in order to determine how experienced users of the MUI worked using the new interface. These results would then be compared to those of operators using the traditional interface, in order to obtain an indication of which interface is more effective and induces the least cost for the user.
There is also the possibility of making the MUI adaptive to the physiological measurements, in effect sympathising with the user. For example, if a user was eliciting stress responses the interface could e.g. change the colour of the screen to induce calm, or bring up a web browser to allow them to have a short break from the job. The interest from the MUI team in this research illustrates the potential for moving these measurements out of MMC assessment and into user-centric technology evaluation and assessment as a whole. 7.2 More General Applications Stress is extremely common in today’s workplace. Thus, the technology that people use daily should be designed to cause them minimal stress. Some ideas of taking this research further are that it could give the user more self-awareness about their stress levels, thus encouraging them to ‘self-manage’ stress. This has links with the discipline of biofeedback, which is a technique for monitoring physiological activity and converting it into an auditory or visual message [9]. It has been shown that e.g. tension headaches and heart rate can be controlled by giving feedback without any external reward as it seems like the feedback and perceived control are intrinsically rewarding. Biofeedback is often used to decrease stress. It may also be beneficial for bosses to observe their employees stress levels, in order to make them more aware of the pressures placed upon employees. Additionally, the detection of stress could be beneficial for illnesses like RSI (Repetitive Strain Injury). For example people who do a lot of a specific activity, like typing, could wear muscle sensors to alert them to take a break and to rest before any
lasting damage is done. This would be extremely useful when it is considered that if a user is involved in an engaging task, they may not notice the stress they are under, as was illustrated in our full video trial (see section 6.2). In conclusion, the ability to detect stress unconsciously has wide ranging implications from areas like product assessment to providing ‘emotionally sympathetic’ user interfaces. Acknowledgments We gratefully acknowledge the contribution of Anna Bouch from UCL Computer Science. Gillian Wilson is funded through an EPSRC CASE studentship with BT Labs.
References 1. Anderson, A.H., Smallwood, L., MacDonald, R., Mullin, J. and Fleming, A. (in press) Video data and video links in mediated communication: What do users value? To appear in International Journal of Human Computer Studies. 2. Bouch, A. and Sasse, M.A. (1999) Network quality of service: What do users need? 4th International Distributed Conference. Madrid, 22nd-23rd September 1999. 3. Bouch, A., Watson, A. and Sasse, M.A. (1998) QUASS – A tool for measuring the subjective quality of real-time multimedia audio and video. Proceedings of HCI ’98, 1-4 September 1998, Sheffield, UK. 4. Cacioppo, J.T. and Louis, G.T. (1990) Inferring psychological significance from physiological signals. American Psychologist, 45(1): 16-28. 5. Cannon, W.B. (1932) The Wisdom of the Body. (Reprinted 1963.) New York: WW Norton
6. Edelberg, R and Wright, D.J. Two GSR effector organs and their stimulus specificity. Paper read at the Society for Psychophysiological Research, Denver, 1962. 7. ETNA Project. http://www-mice.cs.ucl.ac.uk/multimedia/projects/etna/ 8. Frijda, N.H. (1986) The Emotions, chapter Physiology of Emotion, p124-175. Studies in Emotion and Social Interaction. Cambridge University Press, Cambridge, 1986. 9. Gatchel, R. (1997) Biofeedback. In A. Baum, S. Newman, J Weinman, R. West and C McManus. Cambridge Handbook of Psychology, Health and Medicine. Cambridge: Cambridge University Press.
10.Gilli Manzanaro, J., Janez Escalada, L., Hernandez Lioreda, M. and Szymanski, M. (1991) Subjective image quality assessment and prediction in digital videocommunications. COST 212 HUFIS Report, 1991.
11.ITU-R BT.500-8 Methodology for the subjective assessment of the quality of television pictures: http://www.itu.int/publications/itu-t/iturec.htm 12.Kitawaki, N. and Nagabuchi, H. (1998) Quality assessment of speech coding and speech synthesis systems. IEEE Communications Magazine, October, 36-44, 1988. 13.Knoche, H., De Meer, H.G. and Kirsh, D. (1999) Utility curves: mean opinion scores considered biased. Proceedings of 7th International Workshop on Quality of Service, 12-14, 1999 14.LeDoux, J. The Emotional Brain. New York: Simon and Schuster, 1996 15.Millard,N., Coe, T., Gardner, M., Gower, A., Hole, L. and Crowle, S. (1999) The future of customer contact. British Telecom Technology Journal. http://www.bt.co.uk/bttj/vol18no1/today.htm 16.O’Malley, C., Anderson, A.H., Mullin, J., Fleming, A., Smallwood, L. and MacDonald, R. Factors Affecting Perceived Quality of Digitised Video: Tradeoffs between Frame Rate, Resolution and Encoding Format. Submitted to Applied Cognitive Psychology. 17.Picard, R.W. Affective Computing. M.I.T. Press, Cambridge, MA, 1997. 18.Picard, R.W. and Healey, J. (1997) Affective wearables. In Proceedings of the First International Synopsium of on Wearable Computers, Cambridge, MA, Oct. 1997 19.Sasse, M.A., Biltung, U., Schulz, C-D. and Turletti, T. (1994a) Remote seminars through multimedia conferencing: experiences from the MICE project. Proceedings of INET’94/JENC5. 20.Seyle, H. The Stress of Life. McGraw-Hill, 1956 21.Thought Technology Ltd. http://www.thoughttechnology.com/ 22.Vyzas, E. and Picard, R.W. (1999) Offline and online recognition of emotion expression from physiological data. Workshop on Emotion-Based Agent Architectures, Third International Conference on Autonomous Agents, Seattle, WA, 1999. 23.Watson, A and Sasse, M.A. (1997) Multimedia conferencing via multicast: determining the quality of service required by the end user. Proceedings of AVSPN ’97 – International Workshop on Audio-visual Services over Packet Networks, 189-194, 1997. 24.Watson, A and Sasse, M.A. (1998) Measuring perceived quality of speech and video in multimedia conferencing applications. Proceedings of ACM Multimedia ’98, Bristol, UK, September 1998. ACM New York, pp.55-60. 25.Wilcott, R.C. (1967) Arousal Sweating and Electrodermal Phenomena. Psychological Bulletin, 67, 58-72. 26.Wilson, F. and Descamps, P.T. (1996) Should we accept anything less than TV quality: Visual communication. International Broadcasting Convention, 12th- 16th September 1996.