Diversification as Value-Adding Strategy
184
INTERNATIONAL REAL ESTATE REVIEW 2011 Vol. 14 No. 2: pp. 184 –207
Diversification as a Value-Adding Strategy for Asian REITs: A Myth or Reality? Shan Min Charmaine Cheok Citicorp Investment Bank Singapore Ltd, 3 Temasek Avenue, Centennial Tower, 15th Floor, Singapore 039190; Email:
[email protected]
Tien Foo Sing Department of Real Estate, National University of Singapore, 4 Architecture Drive, Singapore 117566; Email:
[email protected]
I-Chun Tsai Department of Finance, National University of Kaohsiung, No. 700, Kaohsiung University Rd., Nanzih District, 811. Kaohsiung, Taiwan, R.O.C.; Email:
[email protected]
This study tests the impact of diversification strategies on the cash flows, expenses, risks and returns of REITs in Asia. HirschmanHerfindahl indices (HHI) are computed based on 2281 properties owned by 63 sample Asian REITs for the periods from 2002 to 2007 to measure the levels of diversification by property type and geographical region. In our empirical tests that use weighted least square regressions, we find no significant effects of diversification by property types on cash flows, expenses and risk premiums of Asian REITs. However, significant variations in expenses and risk premiums of the REITs are explained by a geographical diversification strategy. REITs with assets distributed across different countries incur higher total expenses, interest expenses,general and administrative expenses and capital expenditure. Regionally diversified REITs have higher risk premiums. The results remain unchanged after controlling for country factor and simultaneity between the cash flows, expenses, risk and return variables.
Corresponding author
185
Cheok, Sing and Tsai
Keywords Diversification and focus strategies; Asian REITs; Illiquidity premiums
1.
Introduction
Real estate investment trusts (REITs) have a long history of existence in the United States since 1961. 1 In comparison, REITs in Asia have been a relatively recent phenomenon. REITs were formally listed in Japan in September 2001. Singapore and Hong Kong followed suit by introducing the securitized real estate vehicle in their stock exchanges in 2002 and 2005, respectively. Currently, seven Asian countries have REIT listings which are Japan, Singapore, Hong Kong, Malaysia, Thailand, Taiwan and Korea. There were 102 REITs listed across Asia bourses with an aggregate market capitalization of US$79.51 billion as of 24 December 2007. Japan is the largest market in Asia, constituting about 55.8% of the market share followed by Singapore and Hong Kong, contributing 26.6% and 10.5% to the aggregate market capitalization in Asia, respectively, as of December 2007. REITs grow their asset portfolios through new real estate acquisitions and/or enhancement to existing real estate. REITs acquire a wide range of property assets which range from retail, office, residential and industrial properties to more sophisticated asset classes like carparks, hotels, healthcare and hospitals, and plantations. However, the Hirschman-Herfindahl index (HHI) computed based on assets owned as of 2007 (See Table 2) shows that diversification by property type is still not prevalent among REITs in Asia. The portfolios of Hong Kong REITs are the most diversified by property type among others. Regional diversification through investing in overseas real estate is not in the short-term plans of many Asian REITs. Asian REITs, except for Singaporean REITs (S-REITs), do not invest outside their home markets.2 In Singapore, local REITs like the Mapletree Logistics Trust and Ascott Residence Trust grow their asset portfolios by acquiring overseas properties. The Singapore Exchange has also been successful in attracting REITs with overseas properties, which include Fortune REIT, LippoMapleTree Indonesia Retail Trust, Ascendas India Trust, CapitaRetail China Trust and Saizen REIT, to list on the Singapore‟s bourse by creating a favorable tax environment and pro-REIT legislation. Based on a sample of 245 real estate assets owned by 17 S-REITs in 2006 and 2007, 55 of the assets, which constitute 21.14% of the 1
2
According to the National Association of REITs (NAREIT), there were 152 REITs in the US with a market capitalization of US$312 billion by the end of 2007. Hong Kong actually listed the Guang Zhou Investment Trust with properties in mainland China; however, since its return to China, the REIT is no longer considered geographically diversified.
Diversification as Value-Adding Strategy
186
total assets valued at US$20.17 billion, are located outside Singapore. Do Asian REITs with homogenous portfolios perform better than comparable REITs that diversify by asset type and geographical location? Why do Asian REITs (excluding S-REITs) not diversify outside the domicile markets and/or hold real estate in more than one sector in the portfolios? In the US, studies show that diversification has no significant effects on economies of scale and synergy values in REIT portfolios (Bergs and Springer, 1997; and Ambrose, Ehrlich, Huges and Wachter, 2000). Capozza and Seguin (1999), however, show significant liquidity discounts in REITs with property type diversification, but the same discounts are not found in REITs diversified by region. Based on the stock performance indicators of sample Asian REITs in Table 3, we expect positive risk premiums for REITs diversified by property type. The results, however, show no significant variations in the performance between cross-border REITs and REITs that focus on domicile real estate markets. If we analyze only the sub-sample S-REITs, regional diversification commands a premium of about 1.58% after controlling for property type variations in the portfolios. This study aims to empirically test the causal effects of diversification by type and geographical region on stock performance of the sample Asia REITs. We will also carry out sub-sample analyses of regional diversification strategies of S-REITs. The findings of the study will have important implications for investors who intend to use Asian REITs to diversify property type and geographical risks in portfolios. This paper is organized as follows. Section 2 reviews the literature on REIT diversification. Section 3 discusses the empirical methodology that includes data collection, data sources, testable hypotheses and empirical model specifications. Section 4 analyzes the empirical results. Section 5 concludes the study.
2.
Literature Review
2.1
Diversification by General Firms
The value of a diversified firm is less than the sum of its parts. Lamont and Polk (2001) find that diversification destroys the value of firms. Using the excess value concept to measure the effects of diversification, Berger and Ofek (1995) estimate that the loss of value associated with overinvestment and cross-subsidization of under-performing segments by diversified firms amounted to 13% to 15% on average during the periods 1986-1991. Globally diversified firms also do not create shareholder value. Denis, Denis and Yost (2002) find negative relationships between global diversification by firms and the excess values. The results support the internal capital market inefficiency hypothesis. Laeven and Levine (2005) find no significant diversification premiums for
187
Cheok, Sing and Tsai
financial conglomerates. Diversification intensifies agency problems in financial conglomerates. The running costs outweigh the benefits associated with economies of scale effects of conglomeration. Burch, Nanda and Narayanan (2003) find that the degree of conglomeration of an industry is negatively related to the growth opportunities and concentration in the industry. The firms‟ motives of conglomeration were consistent with the market power and resource hypotheses. 2.2
Diversification by REIT Firms
Gyourko and Nelling (1996) find that stock market-based measures of diversification do not significantly capture the effects of diversification by property type and economic region. They, however, show that systematic risks vary by the types of properties in REIT portfolios. Retail-REITs have higher returns and systematic risks than industrial and warehouse REITs. In a separate study by Capozza and Lee (1995), they find that warehouse REITs are highly diversified by region, whereas apartment-REITs are more concentrated by location. Diversified REITs have above average expense ratios (ratio of general and administrative expenses (GAEXP) to total assets). Chen and Peiser (1999) who analyzed risk and return characteristics of REITs from 1993 to 1997 find that diversified REITs significantly under-perform concentrated REITs. They also show that geographically diversified REITs are more sensitive to market variance than geographically focused REITs. By partitioning GAEXP into a structural component and a style component, Capozza and Seguin (1998) find that the style component of GAEXP that is related to the diversification decisions of firms increases project-level cash flows. The discretionary GAEXP, however, has no effects on corporate level cash flow and shareholder equity. Capozza and Seguin (1999) reaffirm in a separate study that diversification brings about higher project level cash flows, but also higher management and interest expenses to REITs. The net effects on corporate cash flows for focus and diversified REITs are insignificantly different. However, they found that focus portfolios are easier to monitor and more transparent than diversified ones. Focus REITs have higher liquidity premiums than diversified risks (Capozza and Seguin, 2001). Bergs and Springer (1997), and Ambrose, Ehrlich, Hughes and Wachter (2000) examine the asset characteristics (diversified or focused) of REITs and find insignificant incremental impact of property type and geographic diversifications on scale economies
2.3
Diversification by Real Estate Investors
Eichholtz, Hoesli, MacGregor and Nanthankumaran (1995) test the effects of diversification by property type and geographical region on the real estate portfolios of investors. They find that holding single property type across
Diversification as Value-Adding Strategy
188
different regions is the most effective diversification strategy in the UK. Lee and Stevenson (2005) who used Investment Property Databank (IPD) data show that portfolios diversified by property type within London are comparable in performance to portfolios with regional diversification. The above studies suggest that investment strategies that focus in one sector and/or one region give undesirable risk and return trade-off for direct real estate investors. Sing and Patel (2001) find no cointegration relationships between stock prices and diversification strategies of real estate firms. However, they find a weak causality of prices of large net asset value (NAV) property stocks on small NAV property stock prices. Glascock and Kelly (2007) compare diversification strategies of 250 global securitized real estate firms and find that property type diversification is not as effective as country diversification in risk reduction for the firms.
3.
Empirical Methodology
3.1
Data Collection
Our test samples include 63 REITs listed on four major exchanges in Asia, which include Singapore (17), Japan (30), Malaysia (10) and Hong Kong (6). The list of sample Asian REITs is given in the Appendix. We collected annual financial data and valuation of properties in the portfolios of the sample REITs for the period from 2002 to 2007. The values of 2,281 properties, in US$ owned by REITs over the sample periods, were collated. Among the sample properties, the largest real estate was Citibank Plaza in Hong Kong owned by Champion REIT, which is valued at US$3.16 billion. The smallest real estate is Stop Parking Yokkaido, a car park in Chiba, Japan, owned by TGR Investment Inc. which was valued at US$245,596 in 2007. The values of properties in the portfolios of sample REITs were aggregated each year to derive at 96 pooled observations. The annual financial data were then mapped into the pooled observations. After removing the samples with missing financial data, we have a final sample of 80 pooled observations for our empirical tests. The data are collected from three main sources, which are Datastream, annual reports and corporate websites of the sample REITs. The financial data include property-level income, earnings before interest and taxes, corporatelevel income (net income), total expenses, interest expenses, GAEXP, capital expenditures (CAPEX), Q-ratio and return on equity (ROE). The property level data include valuations of property assets, year of valuation, property type, geographical location (country) of property and net floor areas, which are available in the annual reports and on the websites of the sample REITs. The time-series data on market capitalization, exchange rates, stock prices and stock market indices, (including Singapore‟s STI Index, Japan‟s TOPIX,
189
Cheok, Sing and Tsai
Malaysia‟s KLSE and Hong Kong‟s Hang Seng Index) are also collected. Table 1 gives the descriptions of the data and their respective sources. Data in local currency denomination are converted into US dollar denomination, based on the year-end exchange rate. REITs in Thailand, Taiwan and Korea are not included because of the lack of yearly property data. Except for Singapore, REITs in some Asian countries are not required to publish yearly valuation of properties in portfolios. Some REITs listed in 2006 and 2007 are omitted from our sample because they do not have complete financial and property data as of the cut-off date of study in 2007. 3.2
Descriptive Statistics
The descriptive statistics of the cash flows, expenses and risk-return variables are summarized in Table 1. The statistics for S-REIT sub-samples are also included for comparison purposes. The average property-level cash flows of Asian REITs are estimated at US$31.415 million and the average corporate-level income, which is also referred to as distributable income, is estimated at US$23.63 million. The standard deviations of the two income streams are US$79.369 million and US$72.675 million, respectively. The total expenses are estimated at US$13.017 million on average. In comparison, S-REITs have higher mean property-level and corporate-level cash flows of US$72.194 million and US$54.698 million, respectively. The mean total expenses of S-REITs are also higher at US$23.128 million. GAEXP is the largest expense component estimated at US$5.984 million for the whole sample and US$11.142 million for S-REITs on average. Following Capozza and Seguin (1998), we decompose the GAEXP into structural and style components by regressing GAEXP on the aggregate property value (PVAL) and squared PVAL (PVAL2) as follows:
GAEXP 1 PVAL 2 PVAL2
(1) where , 1 and 2 are regression parameters, and is the error term. The predicted value and the error term represent the structural GAEXP and the style GAEXP, respectively. The discretionary style GAEXP expenses are associated with managerial decisions related to diversification by property type and/or geographical region.
Table 1
Symbol
Diversification as Value-Adding Strategy Summary of Variables and Descriptive Statistics (All Sample and Singapore REITs)
Description
Source
All-Sample Singaporean REITs only Standard Standard Mean Mean Deviation Deviation 79.369 76.216 72.675
72.194 62.537 54.698
115.597 113.752 111.115
13.017 2.833 5.984 5.928 0.000 2.838
16.220 4.206 9.258 4.305 8.095 5.780
23.128 6.132 11.142 5.856 4.756 6.650
16.492 4.649 10.580 3.907 7.935 7.864
0.888 0.101
1.356 0.086
0.840 0.106
0.475 0.096
0.389
0.235
0.433
0.269
252.096
399.945
586.084
467.054
1358.143
1309.039 1152.817
879.117
3536.717
7615.671 2076.905
3195.342
190
31.415 27.196 23.630
Diversification as Value-Adding Strategy
A) Cash Flows Property-level cash flows / income Datastream / annual reports PRINC Earnings before interest and tax Datastream/annual reports EBIT Corporate level cash flows/distributable income Datastream/ annual reports COINC B) Expenses Total expenses Datastream / annual reports TEXP Interest expenses Datastream/annual reports INEXP General & administrative expenses Datastream/ annual reports GAEXP General & administrative structural expenses See Equation 1 GASTR General & administrative style expenses See Equation 1 GASTY Capital expenditure Datastream / annual reports CAPEX C) Risk & Return Q-ratio Datastream QRATIO Return on Equity Datastream ROE Coefficient of determination of the single factor RCOF See Equation 2 market model D) Firm Value and Asset MCAP Market capitalization of REIT stock Datastream/ annual reports Annual reports/corporate PVAL Aggregate net property value websites 2 PVAL ('000) Squared aggregate net property value
190
191
Cheok, Sing and Tsai
CAPEX which includes costs of upgrading and asset enhancement are expensed beyond a typical financial year. The average CAPEX of the sample REITs are estimated at US$2.838 million. S-REITs expended an average of US$6.65 million on capital and asset enhancement. In terms of return performance, the Tobin‟s Q-ratio (QRATIO), which is defined as the ratio of market capitalization to net book value of property (replacement costs) is estimated at 0.888 for all sample REITs and 0.840 for S-REITs on average. The Asian REITs (inclusive of S-REITs) and S-REITs (independently) yield an average ROE of 10.1% and 10.6% over the sample periods from 2002 to 2007. We compute the risk indicator in a standard single market factor model as follows: (2) Ri R f i i Rm R f i
where Rf is risk-free return; Ri is individual REIT i stock return and Rm is stock market return of the respective exchanges on which REIT i is listed. i and i are regression parameters, and i is the error term. We run the regression for each sample REIT over the matching sample periods and use the coefficient of determination (RVAL) to represent the correlation between REIT return and stock market return. The average RVAL estimates are 0.389 for the full sample and 0.433 for the S-REITs sub-sample. The average market capitalization for the full REIT sample is estimated at US$252.096 million, whereas the S-REIT sub-sample has a higher average market capitalization of US$586.084. In terms of PVAL, the full Asian REIT sample (inclusive of S-REITs) has a larger asset base of US$1.358 billion in the portfolios compared to US$1.152 billion in the portfolios of the S-REIT sub-sample. 3.3 Diversification Strategies of REITs REITs that adopt diversification strategies will have properties of different types and/or from different geographical regions in the portfolios. Compared with diversification within the US market, diversifying across different Asian markets expose REITs to country risks and exchange rate risks. Cross-border Asian REITs mostly pursue natural hedging against currency risks. In our empirical analyses, values of properties and other cash flows variables are converted from local currency to a common denominator in US dollar. Risk premiums associated with geographically diversified portfolios of crossborder REITs, if tested significance, are attributed mainly to liquidity and country risks. The unit-free HHI is used to measure the degree of diversification by firms. Two HHIs are computed to separately represent diversification by property
Diversification as Value-Adding Strategy
192
type (PEHERF) and by geographical region (GEHERF), [k = GEHERF, PEHERF]. The HHI equation is written as: n
HHI k S i2
(3)
i 1
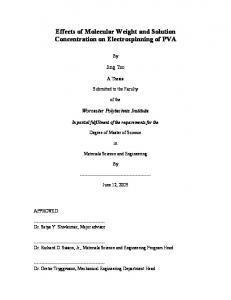
where n denotes the number of properties in a portfolio; Si denotes the proportion of properties in the respective geographical region and property type categories weighted in US$ value term by aggregate property in REIT portfolios. HHI has a value that ranges from [1/n] to 1, where [1/n] indicates a fully diversified REIT and 1 indicates a focused REIT. We compute PEHERF and GEHERF indices for both the pooled sample of 80 REITs and the sub-samples by countries. Table 2 show a PEHERF of 0.807 and a GEHERF of 0.955, which imply that portfolios of Asian REITs are relatively more diversified by property type. By country comparison, except for S-REITs with a GEHERF of 0.883, other Asian REITs are geographicalfocused as reflected by the GEHERF of 1. Hong Kong REITS have the highest level of diversification by property type in the portfolios with a PEHERF of 0.583. From Figure 1 which shows the PEHERF and the GEHERF over the years, we observe that diversification is the most significant in 2005. There was a reversal in the diversification trend by the sample Asian REITs in 2006 and 2007.
Table 2
Diversification by Property Type and Geographical Region Pooled sample
Descriptive Statistic
Property Type Herfindahl
Geographical Herfindahl
Singapore
31
Japan
31
Malaysia
9
Hong Kong
9
Total
80
Mean Std. Deviation Mean Std. Deviation Mean Std. Deviation Mean Std. Deviation Mean Std. Deviation
PTHERF 0.822 0.243 0.836 0.256 0.882 0.182 0.583 0.248 0.807 0.252
GEHERF 0.883 0.265 1.000 0.000 1.000 0.000 1.000 0.000 0.955 0.173
Country
193
Cheok, Sing and Tsai
Hircshman-Herfindal Index
Figure 1
Herfidahl Diversification Indices by Years
1.00 0.80 0.60 0.40 0.20 0.00 2003
2004
2005
PTHERF
GEHERF
2006
2007
Year
Table 3 summarizes the descriptive statistics by diversification strategies and the equal-variance t-statistics for tests of difference in means in the variables. Diversified REITs both by property type and geographical region generate higher cash flows, at the property level, before interest and tax level, and corporate level cash flows compared to focus REITs. Geographically diversified REITs also incur higher total expenses, style GAEXP and CAPEX than focus REITs with no regional exposure. In term of book to market value as indicated by the Q-ratio, only REITs diversified by property type have a positive ratio of market value over book value for the assets. REITs with diversified portfolios across different markets command have a higher total market-based risk premium of 0.649. By the asset size, REITs diversified by property type have the largest asset portfolio of US$1.41 billion on average. Regionally diversified REITs with an average portfolio size of US$0.82 billion are the smallest among the sample REITs. The t-test results show no significant differences in the statistics between diversified REITs and focus REITs by property type. However, geographically diversified REITs (GEHERF < 1) incur higher style administrative GAEXP and have higher total market risks.
4. Empirical Methodology and Analysis 4.1
Model Specification
To empirically test the effects of diversification on cash flows, expenses and risk-return of Asian REITs, the response variables, Yi = [PRINC, EBIT, COINC, TEXP, INEXP, GAEXP, GASTR, GASTY, CAPEX, QRATIO, ROE, RCOF], are regressed against the two diversification indices, PEHERF and GEHERF. The non-linear scale elasticity is controlled in the regressions. The model specification is written as follows:
Diversification as Value-Adding Strategy Table 3
194
Tests of Difference in Means Diversification by Property type
t-test for Equality of Means (Equal variances assumed) Sig. Focus Diversified Sig. Focus Diversified Mean Mean t-stat. t-stat (PEHERF=1) (PEHERF