Lithium-Beryllium-Boron Isotopic Compositions in Meteoritic Hibonite: Implications for Origin of 10 Be and Early Solar System Irradiation Ming-Chang Liu Department of Terrestrial Magnetism, Carnegie Institution of Washington, Washington, DC, USA Institute of Astronomy and Astrophysics, Academia Sinica, Taipei, Taiwan
[email protected] Larry R. Nittler and Conel M. O’D. Alexander Department of Terrestrial Magnetism, Carnegie Institution of Washington, Washington, DC, USA Typhoon Lee Institute of Earth Sciences, Academia Sinica, Taipei, Taiwan Received
;
accepted
–2– ABSTRACT
NanoSIMS isotopic measurements of Li, Be and B in individual hibonite grains extracted from the Murchison meteorite revealed that relate with the 9 Be/11 B ratios in From these data, an initial
10
26
10
B excesses cor-
Al-free PLAty-hibonite Crystals (PLACs).
Be/9 Be = (5.5±1.6)×10−4 (2σ) and
10
B/11 B =
0.2508±0.0015 can be inferred. On the other hand, chondritic boron isotopic compositions were found in
26
Al-bearing Spinel-HIBonite spherules (SHIBs), most
likely due to contamination with normal boron. No 7 Li excesses due to 7 Be decay were observed. When combined with previously-reported data, the new data yield the best defined
10
Be/9 Be = (5.3±1.0)×10−4 (2σ) and
10
B/11 B =
0.2513±0.0012 for PLACs. A comparison of this value and the best constrained 10
Be/9 Be = (8.8±0.6)×10−4 in CV Ca-Al-rich Inclusions (CAIs) supports a het-
erogeneous distribution of 10 Be and its protosolar irradiation origin. We consider two possible irradiation scenarios that could potentially lead to the observed LiBe-B isotopic compositions in PLACs. Although in situ irradiation of solids with hibonite chemistry seems to provide the simplest explanation, more high quality data will be needed for quantitatively constraining the irradiation history. Subject headings: cosmic rays — meteorites, meteors, meteoroids — nuclear reactions, nucleosynthesis, abundances
–3– 1.
Introduction
Short-lived radionuclides (t1/2 > 100 Myr) in the early Solar System provide important information about the astrophysical environment in which the Solar System formed. Among the short-lived radioactivities whose prior existence has been inferred in meteorites, (decays to
10
10
Be
B, t1/2 = 1.5 Myr) and 7 Be (decays to 7 Li, t1/2 = 53 days) are the two that
exclusively require an irradiation origin (e.g. Fowler et al. 1961). The stable isotopes of Li, Be and B are also made by irradiation, and the isotopic compositions of these elements are strongly energy dependent (Ramaty et al. 1996). Thus, a quantitative understanding of the initial abundances and distributions of
10
Be and 7 Be, as well as the stable Li-Be-B
isotopic compositions, would provide important constraints on the irradiation environment and processes in the solar nebula. It is now well established that live
10
Be was present in various types of refractory
inclusions when they formed, and that these inclusions had a range of inferred abundances of another short-lived radionuclide,
26
Al. The inferred
10
Be/9 Be ratios range from (3–4)×10−4
up to 18×10−4 , albeit with significant analytical errors in most cases (McKeegan et al. 2000; Sugiura et al. 2001; Marhas et al. 2002; MacPherson et al. 2003). Amongst 26
Al-bearing (26 Al/27 Al ∼ 5×10⁻⁵ ) CV-chondrite Ca-Al-rich Inclusions (CAIs), the best
constrained initial (2006a). For
26
10
Be/9 Be = (8.8±0.6)×10−4 (2σ) was reported by Chaussidon et al.
Al-free (26 Al/27 Al > 3×10⁻⁶ ) inclusions, the most precise
10
Be/9 Be ratio of
(5.1±1.4)×10−4 (2σ) was obtained in a subset of CM-chondrite hibonite (CaAl12 O19 ) grains, referred to as PLAty hibonite Crystals (PLACs) (Liu et al. 2009a). The other
26
10
Be/9 Be ratios in
Al-free objects are consistent with this value (Marhas et al. 2002; MacPherson et al.
2003; Marhas & Goswami 2003). Beryllium-10 and 7 Be are primarily produced through the same nucleosynthetic pathway, namely
16
O(p, x). Consequently, refractory inclusions where
10
Be was found might
–4– be expected to also contain 7 Be. However, because of the complicated chemical and isotopic behavior of Li (e.g., Chaussidon et al. 2006b), whether 7 Be existed in refractory inclusions is still an open question. The only hint for the existence of 7 Be (7 Be/9 Be = (6.1±1.3)×10−3 ) in the solar nebula was reported by Chaussidon et al. (2006a). Further surveys for 7 Be are needed for confirmation of its presence, and for a better understanding of its initial abundance and distribution in the solar nebula. Live
10
Be in the early Solar System could have formed as a consequence of protosolar
irradiation, with variable abundances in different objects arising from varied irradiation histories (e.g., McKeegan et al. 2000; Marhas et al. 2002; MacPherson et al. 2003; Chaussidon et al. 2006a; Liu et al. 2009a). Alternatively, trapping of
10
Be-enriched Galactic
Cosmic Rays (GCRs) by the magnetic fields of the progenitor molecular cloud core has been proposed as a source of 10
10
Be (Desch et al. 2004). In this scenario, a uniform initial
Be/9 Be ratio would exist in the solar nebula, which would allow
10
Be to be used for
chronometry. However, since
26
Al appears to be a valid chronometer (Villeneuve et al.
2009), a comparison between
26
Al-bearing CAIs and
difference in
10
26
Al-free PLACs suggests that the
Be/9 Be has no chronological meaning, making irradiation in the solar nebula
the likely source of most of the
10
Be (Liu et al. 2009a).
The above argument that
10
Be had a protosolar irradiation origin is based on a
chronological viewpoint. If one aims to quantitatively understand the spatial distribution of 10
Be in a certain time period, examination of different objects that formed closely in time
is needed. The available CAI
10
Be data appear to show some heterogeneity, but there are
large analytical uncertainties (e.g. McKeegan et al. 2000; Sugiura et al. 2001; MacPherson et al. 2003). CM-chondrite Spinel-HIBonite spherules (SHIBs) would be a good alternative target for investigating
10
Be heterogeneity, as their inferred
26
Al/27 Al ratios indicate that
they probably formed ∼1×10⁵ years after CAIs (Liu et al. 2009a), and the change in
10
Be
–5– abundances due to radioactive decay over this time period would have been negligible. However, resolvable
10
B excesses have not yet been found in SHIBs, primarily because
of pervasive B contamination from surface cracks and the lack of uniform areas in these objects that are large enough to contain a typical ion microprobe spot (∼ 30 − 50µm; e.g., Liu et al. 2009a). These problems can be overcome to some degree with the higher spatial resolution of the Cameca NanoSIMS ion probe. Here we report the results of Li-Be-B isotopic measurements in CM hibonites obtained with the CIW NanoSIMS 50L, and discuss their astrophysical implications.
2.
Experimental
Hibonite grains were hand-picked from an acid residue of the Murchison meteorite (courtesy of Andy Davis, the University of Chicago). Of the 40 hibonite samples found, only 9 grains (2 SHIBs and 7 PLACs) that had large enough areas of hibonite (∼ 20 − 60µm across) were selected for measurements. For the Li-Be-B measurements, a 5 nA, 16 KeV
16
O− primary beam (φ ∼ 7 − 10µm)
was used to generate a ∼15×15 µm2 raster square on polished, epoxy-mounted samples. Secondary ions (6 Li+ , 7 Li+ , 9 Be+ ,
10
B+ ,
11
B+ ,
27
Al++ ) were counted simultaneously with
six electron multipliers (EMs). Beam blanking was applied in every analysis, so that only signals from the central 6×6 µm2 area were collected. Before each measurement, samples were pre-sputtered for 5–10 minutes until the B signal became steady. The mass resolution was sufficient to resolve isobaric interferences. Counting times were optimized based on the
10
B count rate (¿1 – ∼10 counts sec−1 ) to reach sufficient counting statistics with
the resulting total analysis times of 1.5 – 3 hours. Sample charging was monitored and corrected for every 30 cycles. The data were also corrected for EM background (∼ 0.003 counts sec−1 ). Under such low count rates, the analytical uncertainties were primarily
–6– determined by counting statistics. The instrumental mass fractionation (IMF) and relative sensitivity factors (RSFs), which relate measured secondary ion ratios to true concentration ratios, were determined from measurements of an NBS612 glass (10 B/11 B = 0.2469; 9 Be/11 B = 1.79; Kasemann et al. 2001; 7 Li/6 Li = 12.3918; 9 Be/6 Li = 9.411 ). The Li, Be and B concentrations of the samples were estimated by comparison with the NBS612 glass ([Li] = 41.8 ppm, [Be] = 38.3 ppm and [B] = 32 ppm; Pearce et al. 1997) with the equation: [x]sample
(x)m [x]std (Al++ )m sample std × × × [Al2 O3 ]sample = m m ++ (x)std (Al )sample [Al2 O3 ]std
where x represents Li, Be or B, and the superscript m represents measured. It should be pointed out that differences in IMFs and RSFs between silicate glasses and oxides could exist. Contributions from spallogenic 6 Li, 7 Li, 9 Be,
10
B, and
11
B in hibonite samples by
GCR irradiation of the host meteorite were also estimated by adopting an exposure age of 1.8 My for the Murchison meteorite (Herzog et al. 1997). However, they were insignificant compared to the analytical errors.
3.
Results
The Li and B isotopic compositions and elemental concentrations of the measured grains are reported in Table 1. Literature data from Liu et al. (2009a) are also listed for comparison. The 9 Be/6 Li and 9 Be/11 B ratios in the new grains both span a wide range, from slightly higher than the chondritic values (0.18 and 0.053, respectively; Lodders 2003) to a few hundred, but are less extreme than those reported by Liu et al. (2009a). Resolvable 1
10
B excesses correlating with the 9 Be/11 B ratios are found in a suite of hibonite
lithium data: http://www.geol.umd.edu/pages/facilities/li analytical.pdf
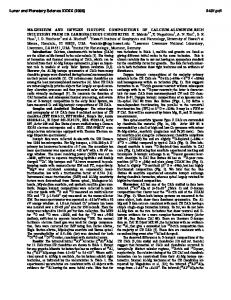
–7– grains, indicating the in situ decay of slope corresponding to
10
10
Be. The best fit through all the points yields a
Be/9 Be = (5.5±1.6)×10−4 (2σ), with an intercept
10
B/11 B =
0.2508±0.0015 (Figure 1). Although this correlation line is primarily defined by the two highest points on the sample mt3-P13, the χ ¯2 = 0.9 indicates that all the hibonite grains could have sampled a common
10
Be reservoir. This result corroborates the previous work of
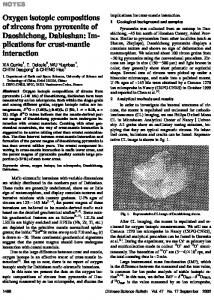
by Marhas et al. (2002) and Liu et al. (2009a). If we combine the NanoSIMS results with those of Liu et al. (2009a),
10
Be/9 Be = (5.3±1.0)×10−4 and
= 1.1) can be inferred from the best fit (Figure 2). This
10
10
B/11 B = 0.2513±0.0012 (χ¯2
Be/9 Be, so far the most precise
initial ratio for CM PLACs, is ∼40% lower than the best constrained value (8.8±0.6)×10−4 for CV CAIs, whereas the initial
10
B/11 B ratios for the two groups of objects agree with
each other within errors, and are ∼1.5% higher than the chondritic value (= 0.2476, Zhai et al. 1996). Unfortunately, we were unable to detect resolvable
10
B excesses in SHIBs, even if
they were present at the levels seen in PLACs, because SHIBs have much lower Be/B ratios than do PLACs. The 7 Li/6 Li ratios in these grains do not show any evidence for 7 Be decay, and are all consistent within the uncertainties with the chondritic value (12.02, McDonough et al. 2003). The best fit results in 7 Be/9 Be = (0.6±2)×10−4 (2σ) and 7 Li/6 Li = 12.01±0.02 (Figure 3), indicating that these grains were grossly contaminated by terrestrial/chondritic Li, were isotopically disturbed, or formed without 7 Be. When combined with the Li data from Liu et al. (2009a), it is clear that all hibonite grains are characterized by chondritic 7
Li/6 Li, with only a few exceptions showing resolvably lower ratios. The Li, Be, and B concentrations of the samples range from a few ppb to hundreds
of ppb, similar to what was observed by Liu et al. (2009a). An interesting observation, although based on somewhat limited amounts of data, is that PLACs that define the Be-B correlation line (Mur-P1, Mur-P7, Mur-P8, Mur-P9, mt3-P4, mt3-P13, and mt4-P4) all
–8– have similar [Be] ∼600±100 ppb, whereas SHIBs tend to have much lower [Be], only ∼20 – 60 ppb.
4. 4.1. Because
10
Discussion
Protosolar irradiation origin for
10
Be
Be is destroyed in stellar nucleosynthesis, its presence in the early Solar
System requires nuclear reactions with energetic particles (e.g., McKeegan et al. 2000; Marhas et al. 2002; Chaussidon et al. 2006a; Liu et al. 2009a). Two mainstream models responsible for the origin of
10
Be include in situ irradiation from the proto-Sun (e.g.,
Gounelle et al. 2001, 2006) and the trapping of GCR-10 Be by the molecular cloud core (Desch et al. 2004). The inferred to have formed without live apparent 10
26
26
10
Be abundance in CM PLACs, which have been thought
Al because they are devoid of
26
Mg excesses or even have
Mg deficits (e.g., Liu et al. 2009a), sheds light on the origin of
10
Be. The
Be/9 Be value of (5.3±1.0)×10−4 in CM PLACs reinforces the argument made by Liu et
al. (2009a) that GCR-trapping is unlikely to be the dominant source of
10
Be. Assuming
chronological significance for 10 Be, the difference in formation time between (5.3±1.0)×10−4 (PLACs) and (8.8±0.6)×10−4 (CAIs, Chaussidon et al. 2006a) ranges from 0.6 to 1.7 My. However, this age difference would predict that the PLAC
26
Al/27 Al should have
been between ∼ (1 − 3) × 10−5 , much higher than observed. Alternatively, as argued by Liu et al. (2009a), the lack of
26
Al found in PLACs could not be explained by late
formation, but might have been the result of formation prior to a late injection of
26
Al and
formation of CAIs (Sahijpal & Goswami 1998). In this case, PLACs should have at least the same, or higher,
10
10
10
Be. Therefore, the
chronologically, and
10
Be/9 Be than CV CAIs if GCR-trapping was the primary source of Be/9 Be difference between PLACs and CAIs cannot be explained
Be must not have been homogeneously distributed in the inner
–9– solar nebula. Another line of evidence comes from the initial
10
B/11 B ratio. The initial
ratios for PLACs (0.2513±0.0012) and for Allende CV CAIs (0.2538±0.0015; Chaussidon et al. 2006a) agree within error. These a widespread decay of supra-chondritic
10
10
10
B/11 B ratios are too high to be explained by
Be in a gas of solar composition (Be/B = 0.04). Instead, their
B/11 B ratios are best understood as a mixture between chondritic and
spallogenic B. From all these observations, we conclude that
10
Be was produced by in situ
protosolar irradiation. Similar to previous studies,
10
B excesses could not be resolved in SHIBs. Even though
we were able to analyze almost pure hibonite, low 9 Be/11 B ratios ( 3×10⁻⁶ ) (Gounelle et al. 2006; Liu & McKeegan 2009b). The cross sections of relevant reactions are either taken from Sisterson et al. (1997) and Michel et al. (1997), or calculated with the TALYS code (Koning et al. 2005).
4.2.1. Irradiation of solid hibonite In this scenario, there was in-situ irradiation of already-formed hibonite grains near the proto-Sun (Liu & McKeegan 2009b). At the cessation of condensation, hibonite would contain Be but should be essentially free of Li and B, as they do not condense until T > 1100 K (e.g., Lodders 2003). Assuming an initial [Be] = 500 ppb in the solids, which is roughly an average in the grains that define the Be-B correlation line, and a proton fluence that produces
10
Be/9 Be = 5.3 × 10⁻⁴ , we obtain the following isotopic ratios in hibonite
at the end of the irradiation:
10
B/11 B ∼ 0.44 (the ratio of cross sections of
16
O(p, x)10,11 B
measured at 135 MeV; Yiou et al. 1968), 9 Be/11 B ∼ 11, 7 Be/9 Be ∼ 3 × 10⁻⁴ , 7 Li/6 Li ∼ 0.8 (the same method as for B), and 9 Be/6 Li ∼ 27. The Li and B isotopic ratios do not include any radiogenic components from the decay of 7 Be and
10
Be, respectively.
This simple calculation shows that if grains were irradiated in situ, the Li-Be-B isotopic compositions seen in PLACs cannot be purely spallogenic, but instead require spallation followed by partial loss of spallogenic Li and B, and isotopic exchange with a chondritic gas. The measured initial
10
B/11 B = 0.2513 for PLACs is much lower than the pure
spallogenic ratio 0.44, indicating that the grains must have experienced post-irradiation isotope exchange with a chondritic reservoir(s) (10 B/11 B = 0.2476), and only ∼ 2% of the pure spallogenic component was preserved. The exchange would have to have taken place after a diffusive loss of spallogenic B from the grains (B is unstable in refractory phases at high temperatures), but before
10
Be had decayed significantly, so that the grains would
– 11 – have variable 9 Be/11 B ratios and the same starting
10
B/11 B = 0.2513. This explains why
PLACs form a well-defined Be-B correlation line. The variation in 9 Be/11 B might simply reflect different degrees of B loss when the exchange with chondritic matter occurred. It is important to note that CV CAIs could have derived their Be-B isotopic characteristics in this scenario, if their refractory precursors were also B-free. The above processes would probably affect the Li isotopic system in a similar way, since Li and B have similar volatility. However, the high mobility of Li at high temperatures (e.g., Coogan et al. 2005) and fast decay rate of 7 Be greatly complicated the Li isotopic evolution in hibonite. Qualitatively, the lower-than-chondritic 7 Li/6 Li in some hibonite grains (Mur-S15, Mur-P6, Mur-P8 and Mur-P9, Liu et al. 2009a) could be explained by mixing pure spallogenic Li (7 Li/6 Li ∼0.8) with chondritic components (7 Li/6 Li = 12.02). A quantitative evaluation of how Li isotopes evolved in the grains still requires a detailed understanding of Li diffusion in hibonite and residence time at high temperatures, on which we still lack constraints.
4.2.2. Irradiation of solar gas In this scenario, proton irradiation of nebular gas was followed by condensation of hibonites. The initial gas composition is taken as the solar composition of Lodders (2003), with the starting 7 Li/6 Li = 12.26 and the 7 Li/6 Li and
10
10
B/11 B = 0.2472. It should be pointed out that
B/11 B from Lodders (2003) are slightly different from the measured ones
of McDonough et al. (2003) and Zhai et al. (1996), respectively, but we can ignore this discrepancy since it does not have any impact on the conclusion. We estimate the final 10
Be/9 Be, 7 Be/9 Be, 7 Li/6 Li, and 10 B/11 B in the gas parcel in which hibonite formed, despite
the fact that Li and B would not condense into the solids at the condensation temperatures of hibonite. The production of Li-Be-B isotopes was calculated by considering spallation
– 12 – on
12
C,
14
N and
16
O. The result shows that for a proton fluence that produces
= 5.3 × 10⁻⁴ , 7 Be/9 Be, 7 Li/6 Li and
10
10
Be/9 Be
B/11 B would be at the level of ∼ 8 × 10⁻³ , 12.26
and 0.2473, respectively. The condensed hibonite could have incorporated
10
Be at this
abundance, but the amount of incorporated 7 Be would strongly depend on the time delay between the termination of irradiation and hibonite formation. This means that the lack of radiogenic 7 Li excesses in PLACs could be explained in this scenario if they had formed >1 year after irradiation. One challenge for this explanation is to reproduce the initial
10
B/11 B = 0.2513. Freshly
formed CM PLACs would be free of B. For PLACs to acquire a ratio of 0.2513, one has to invoke a supra-chondritic B component. Nebular gas near the proto-Sun would have been the most likely candidate because its
10
B/11 B could be elevated by solar energetic particle
spallation more easily than that of the Murchison parent body. However, as shown above, to raise the
10
B/11 B to 0.2513 in a solar gas, the collateral
10
Be/9 Be ratio would have to
be much higher than observed (e.g., ∼3×10⁻² ). In addition, given a high mixing efficiency in a marginally gravitationally unstable disk (e.g., Boss 2008), whether a supra-chondritic gaseous reservoir could have lasted long enough to interact with PLACs is a question. Another potential problem with this scenario, although it can be very model dependent, is that even if grains exchanged B isotopes with supra-chondritic gas, possible secondary processing in the meteorite parent body could still introduce “normal” B into the PLACs and lower their
10
B/11 B ratios. Because grains could have experienced various degrees of
parent body processing, and thus mixed with various proportions of chondritic B, it would require multiple supra-chondritic components of different
10
B/11 B in the gas and ad-hoc
mixing ratios to explain a well-defined initial ratio in PLACs. From this view, irradiation of solar gas seems less likely to be responsible for
10
Be and 7 Be in the early Solar System. It
should also be noted that isotopic fractionation associated with recondensation of normal gas onto the grain surface could potentially lead to enrichment of
10
B; however at this point
– 13 – the evidence for this process occurring in the solar nebula is still lacking.
5.
Conclusion
Combining new NanoSIMS measurements of
26
Al-free platy hibonite crystals (PLACs)
with the results of Liu et al. (2009a) yields, as of now, the best defined initial ratio of (5.3±1.0)×10−4 and initial
10
10
Be/9 Be
B/11 B = 0.2513±0.0012 for CM PLACs. This result
reinforces the argument against the model that observed
10
Be in early Solar System objects
originated as trapped GCR material, and thus supports a protosolar irradiation origin for 10
Be. As in previous studies, we failed to find resolvable 10 B excesses in 26 Al-bearing SHIBs,
so that a meaningful comparison with CAIs on initial
10
Be/9 Be ratios remains impossible.
Both irradiation of hibonite solids and of solar gas could qualitatively lead to the observed Li-Be-B isotopic compositions; however, the former provides a simpler explanation. To quantitatively constrain the irradiation history of CM hibonites, more data, especially higher quality Li isotopic measurements, are needed.
The authors thank the referee for invaluable comments, Kevin McKeegan for inspiring discussion, Andy Davis for providing a Murchison residue, and Jianhua Wang for assistance with the NanoSIMS.
– 14 –
0.36
SHIBs PLACs
0.34
B/11 B
0.32
10
0.30
χ2 =0.9
0.28
10
0.26
9
-4
Be/ Be = (5.5+/-1.6)x10 (2σ)
0.24 10
11
( B/ B)0 = (0.2508+/- 0.0015) 0.22 0
20
40
60
80
9
11
100
120
140
160
Be/ B
Fig. 1.—
10
Be-10 B isochron plot derived from the NanoSIMS analyses. Duplicated mea-
surements on the same grains, which are connected with a dashed line, demonstrate good reproducibility. The PLACs show a significant range of Be/B ratios, which are strongly correlated with 10 B excesses. The best fit to all the points yields 10 Be/9 Be = 5.5×10⁻⁴ . The horizontal solid line represents the chondritic
10
B/11 B = 0.2476. Errors are 2σ.
– 15 –
1.0
!
0.9
0.8
10
9
-4
Be/ Be = (5.3+/-1.0)x10 (2σ)
0.6
0.34
10
11
B/ B
0.7
0.32
0.5
2
χ = 1.1 0.30 0.28
0.4
0.26
0.3
10
0.24
11
( B/ B) = 0.2513+/- 0.0012 0
0.2 ! 0
0.22 0
200
400
600
9
10
800
11
20
30
1000
40
50
60
1200
70
80
90
1400
100
1600
Be/ B
Fig. 2.— NanoSIMS results (open symbols) plotted with the data from Liu et al. (2009a) (filled symbols). An initial
10
Be/9 Be ratio of (5.3±1.0)×10−4 is inferred from the data. The
horizontal solid line represents the chondritic
10
B/11 B. Errors are 2σ.
– 16 –
13.5
SHIBs PLACs 13.0
12.5
7
9
-4
Li/6Li
Be/ Be = (0.6+/-2)x10 (2σ)
7
χ2 =2.1
12.0
11.5 7
6
( Li/ Li)0 = (12.01+/-0.02) 11.0 0
100
200
300
9
400
6
500
600
700
800
Be/ Li
Fig. 3.— 7 Be-7 Li correlation plot. The 7 Li/6 Li ratios in the grains are essentially chondritic (= 12.02). Errors are 2σ.
– 17 – REFERENCES Boss, A. 2008, Earth Planet. Sci. Lett, 268, 102 Chaussidon, M., Robert, F., & McKeegan, K. D. 2006a, Geochim. Cosmochim. Acta, 70, 224 Chaussidon, M., Robert, F., & McKeegan, K. D. 2006b, Geochim. Cosmochim. Acta, 70, 5433 Coogan, L. A., Kasemann, S. A., & Chakraborty, S. 2005, Earth Planet. Sci. Lett, 240, 415 Desch, S. J., Connolly, H. C. & Srinivasan, G. 2004, ApJ, 602, 528 Fowler, W. A., Greenstein, J. L., & Hoyle, F. 1961, American Journal of Physics, 29, 393. Gounelle, M., Shu, F. H., Shang, H. Glassgold, A. E. Rehm, K. E. & Lee, T. 2001, ApJ, 548, 1051 Gounelle, M., Shu, F. H., Shang, H. Glassgold, A. E. Rehm, K. E. & Lee, T. 2006, ApJ, 640, 1163 Herzog, G. F., Vogt, S., Albrecht, A., Xue, S., Fink, D., Klein, J., Middleton, R., Weber, H. W. & Schultz, L. 1997, Meteor. Planet. Sci., 32, 413 Kasemann, S., Meixner, A., Rocholl, A., Vennemann, T., Rosner M., Schimitt, A. K. & Wiedenbeck M. 2001, Geostan. Newslett. J. Geostan. Geoanal., 25, 405 Koning, A. J., Hilaire, S., & Duijvestijn, M. C. 2005, in AIP Conf. Proc. 769, International Conference on Nuclear Data for Science and Technology, ed. R. C. Haight (New York: AIP), 1154 Liu, M.-C., McKeegan, K. D., Goswami, J. N., Marhas, K. K., Sahijpal, S., Ireland, T. R. & Davis, A. M. 2009a, Geochim. Cosmochim. Acta, 73, 5051
– 18 – Liu, M.-C. & McKeegan, K. D. 2009b, ApJ, 697, L145 Lodders, K. 2003, ApJ, 591, 1220 MacPherson, G. J., Huss, G. R. & Davis, A. M. 2003, Geochim. Cosmochim. Acta, 67, 3165 Marhas, K. K., Goswami, J. N. & Davis, A. M. 2002, Science, 298, 2182 Marhas, K. K., & Goswami, J. N. 2003, Lunar Planet. Sci. Conf., 34, 1303 McDonough, W. F., Teng, F. Z., Tomascak, P. B., Ash, R. D., Grossman, J. N., & Rudnick, R. L. 2003, Lunar Planet. Sci. Conf., 34, 1931 McKeegan, K. D., Chaussidon, M., & Robert, F. 2000, Science, 289, 1334 Michel, R., et al. 1997, Nuclear Instruments and Methods in Physics Research B, 129, 153 Pearce, N. J. G., Perkins, W. T., Westgate, J. A., Gorton, M. P., Jackson, S. E., Neal, C. R. & Chenery, S. P. 1997, Geostan. Newslett. J. Geostan. Geoanal., 25, 405 Ramaty, R., Kozlovsky, B & Lingenfelter, R. E. 1996, ApJ, 456, 525 Sahijpal, S., & Goswami, J. N. 1998, ApJ, 509, 137. Sisterson, J. M., Kim, K., Caffee, M. W., & Reedy, R. C. 1997, Lunar Planet. Sci. Conf., 28, 1327 Sugiura, N., Shuzou, Y. & Ulyanov, A. 2001, Meteor. Planet. Sci. 36, 1397 Villeneuve, J., Chaussidon, M. & Libourel, G. 2009, Science, 325, 985 Yiou, F., Maril, M., Dufaure de Citres, J., Fontes, P., Gradsztajn, E. & Bernas, R. 1968, Phys. Rev., 166, 968
– 19 – Zhai, M. Z., Nakamura, E., Shaw, D. M. & Nakano, T. 1996, Geochim. Cosmochim. Acta, 60, 4877
This manuscript was prepared with the AAS LATEX macros v5.2.
– 20 –
Table 1. Results of Li-Be-B measurements in CM hibonites Sample
9 Be/6 Li
(±2σ)
7 Li/6 Li
(±2σ)
9 Be/11 B
(±2σ)
10 B/11 B
(±2σ)
[Li]
[Be]
[B]
mt1-S1
0.29±0.03
12.03±0.08
0.14±0.01
0.2554±0.0092
476
14
150
mt3-S6
2.0±0.2
12.12±0.14
0.31±0.03
0.2436±0.0100
113
22
107
mt2-P12
95.1±10.7
11.93±0.51
0.31±0.03
0.2516±0.0051
6
53
255
mt3-P3
196.9±23.3
12.37±0.70
1.4±0.1
0.2469±0.0100
21
409
433
mt3-P4
48.8±5.1
12.03±0.14
30.7±2.8
0.2570±0.0200
105
511
25
mt3-P13@1
447.8±47.6
11.93±0.23
144.3±13.4
0.3282±0.0269
13
565
6
mt3-P13@2
684.7±75.5
11.97±0.43
81.7±7.84
0.3131±0.0297
9
601
11
mt4-P4@1
172.6±13.9
12.06±0.12
7.7±0.1
0.2540±0.0042
48
819
159
mt4-P4@2
329.8±26.8
12.08±0.18
11.0±0.2
0.2573±0.0057
24
784
106
mt4-P5
1.3±0.1
11.95±0.04
2.0±0.1
0.2553±0.0080
587
79
60
mt4-P8
4.2±0.3
12.05±0.04
0.33±0.01
0.2511±0.0019
487
205
929
Below are the data from Liu et al. (2009a) Mur-S7
0.12±0.01
11.96±0.04
0.05±0.02
0.2501±0.0040
6096
57
1526
Mur-S15
6.4±0.6
11.37±0.17
0.42±0.09
0.2589±0.0126
60
29
121
Mur-P1
1575.2±83.1
12.09±0.30
28.3±3.8
0.2690±0.0157
6
753
33
Mur-P2
3.5±0.1
11.98±0.10
24.7±9.0
0.4541±0.1915
95
26
2
Mur-P3
19.2±1.7
12.02±0.19
0.14±0.02
0.2446±0.0138
32
43
533
Mur-P6
3.5±0.1
11.87±0.04
3.0±0.4
0.2615±0.0076
2322
634
272
Mur-P7@1
543.2±40.2
11.63±0.23
1028.7±477.9
0.8087±0.1934
17
677
1
Mur-P7@2
1266.1±43.8
11.79±0.44
885.5±200.5
0.7088±0.1420
7
651
1
Mur-P8
213.7±27.7
11.72±0.12
68.5±9.3
0.2830±0.0187
43
609
11
Mur-P9
342.2±30.8
11.76±0.23
11.8±1.5
0.2551±0.0078
32
723
73
Mur-P10@1
370.9±12.4
12.15±0.41
2.6±0.3
0.2568±0.0067
20
570
262
Mur-P10@2
166.6±7.7
12.02±0.16
2.2±0.4
0.2550±0.0053
52
645
452
a [Li],
[Be], and [B] are in unit of ppb (parts per billion)
b The
letters “S” and “P” indicate SHIB and PLAC, respectively