This article has been accepted for publication in a future issue of this journal, but has not been fully edited. Content may change prior to final publication. Citation information: DOI 10.1109/ACCESS.2017.2689058, IEEE Access 1
Liver fibrosis classification based on transfer learning and FCNet for ultrasound images Dan Meng, Libo Zhang, Guitao Cao∗ , Wenming Cao, Guixu Zhang, and Bing Hu
Abstract—Diagnostic ultrasound offer great improvements in diagnostic accuracy and robustness. However, it is difficult to make subjective and uniform diagnoses because the quality of ultrasound images can be easily influenced by machine settings, the characteristics of ultrasonic waves, the interactions between ultrasound and body tissues, and other uncontrollable factors. In this paper, we propose a novel liver fibrosis classification method based on transfer learning (TL) using VGGNet and a deep classifier called fully connected network (FCNet). In case of insufficient samples, deep features extracted using TL strategy can provide sufficient classification information. These deep features are then sent to FCNet for the classification of different liver fibrosis statuses. With this framework, tests show that our deep features combined with the FCNet can provide suitable information to enable the construction of the most accurate prediction model when compared with other methods. Index Terms—Deep neural networks, Fully connected layers, Transfer learning, Liver fibrosis
I. I NTRODUCTION HE incidence and mortality of liver disease are increasing yearly on the global scale, and the etiology of liver disease is complex. Consequently, the questions of how to perform prospective diagnoses of liver diseases and how to develop personalized treatment plans are important medical problems that have attracted considerable attention in recent years. Traditional diagnostic methods mainly rely on histopathological examination based on liver biopsy. However, liver biopsy is invasive and can easily cause other complications. Therefore, with the development of ultrasonic imaging technology, ultrasonic-imaging-based diagnostic techniques are becoming some of the most important methods for the examination, diagnosis and interventional treatment of various types of clinical diseases by virtue of their significant advantages such as their real-time dynamics, high sensitivity, good operability and non-invasive diagnosis. Diagnoses based on ultrasonic imaging technology are subject to two main limitations: (1) Image quality. The quality of
T
D. Meng and G. Cao are with MOE Research Center for Software/Hardware Co-Design Engineering, East China Normal University, Shanghai 200062, China (e-mail:
[email protected],
[email protected]). L. Zhang is with the University of the Chinese Academy of Sciences, Beijing, China (e-mail:
[email protected]). W. Cao is with the College of Information Engineering, Shenzhen University, Shenzhen 518060, China (e-mail:
[email protected]). G. Zhang is with School of Computer Science and Software Engineering, East China Normal University, Shanghai 200062, China. (e-mail:
[email protected]) B. Hu is with the Department of Ultrasound, Shanghai Jiaotong University Affiliated Sixth Peoples Hospital, Shanghai 200233, China.(e-mail: binghu
[email protected]) G. Cao∗ is the corresponding author.
an image is often influenced by many subtle factors such as motion of the machinery and equipment and the experience of the image capturing staff. (2) The doctor’s personal experience. A doctor usually assesses an ultrasound image through visual inspection, but the characteristics that can be identified by the human eye are limited. Moreover, the same ultrasonic image may be interpreted differently by doctors with different clinical experience. To overcome these limitations, methods based on image processing techniques for helping doctors to extract relevant image characteristics are gradually emerging in the medical field. Ogawac [1] distinguished the status of the liver according to seven image features. Wu [2] proposed a new classification method based on a multi-resolution fractal feature vector and the textural features of a fractal Brownian motion model. Mojsilovi [3] took advantage of the transformed image obtained through wavelet decomposition. Yeh [4] extracted features by utilizing the grey-level co-occurrence matrix and wavelet decomposition and then used a classifier based on the support vector machine (SVM) technique for classifying the liver fibrosis status. The limitations of the traditional methods discussed above lie mainly in the following three areas: (1) The setting of the characteristics is often based on subjective human experience. (2) The number of extracted features is very limited. (3) The proposed methods of feature extraction cannot be dynamically optimized according to changes in the dataset. With the development of deep learning technology, however, a new paradigm of computer-aided medical treatment is emerging. Iotto [5] presented a new learning method based on unsupervised depth characteristics; this method includes an automatic decoder for noise reduction consisting of three layers. The method can produce a general characterization of a patient from electronic healthcare records to make clinical predictive modelling more convenient. Nguyen [6] constructed Deeppr based on a deep convolutional neural network (DCNN) to improve the accuracy of clinical diagnosis. Nie [7] presented a sparse deep learning framework for building a set of information characterizing a user’s health to enable the inference of possible diseases. Inspired by work on deep learning models and their variants, this paper proposes a two-stage framework for the classification of liver ultrasound images. The proposed framework consists of a deep feature extraction stage based on the transfer learning strategy and a classification stage using a fully connected neural network (FCNet). The proposed framework learns useful deep features from clinical data, and based on the obtained features, an artificial neural network (ANN) technique is applied to learn how to partition a liver’s status as
2169-3536 (c) 2016 IEEE. Translations and content mining are permitted for academic research only. Personal use is also permitted, but republication/redistribution requires IEEE permission. See http://www.ieee.org/publications_standards/publications/rights/index.html for more information.
This article has been accepted for publication in a future issue of this journal, but has not been fully edited. Content may change prior to final publication. Citation information: DOI 10.1109/ACCESS.2017.2689058, IEEE Access 2
normal, early-stage fibrosis (S1-S3) or late-stage fibrosis (S4). The main contributions of this paper are as follows: • A new liver fibrosis classification framework is presented, which mainly benefits from two important components: deep features obtained through transfer learning and a stable classification strategy based on FCNet. The transfer learning stage explores the feature representations of liver ultrasound images, and the classification accuracy is increased using the FCNet. • The deep features obtained through transfer learning and the VGGNet architecture can provide robust feature representations for predicting liver status based on ultrasound images. • Our proposed method is evaluated using samples that have been diagnosed by clinicians. The experimental results confirm that the classifications of liver fibrosis samples produced by our proposed model agree well with clinicians’ diagnoses. The remainder of this paper is organized as follows. Section 2 introduces the motivation for the proposed method, and Section 3 describes the proposed method in detail. Experimental results are presented in Section 4. Finally, the conclusion and plans for future work are presented in Section 5. II. M OTIVATION In the following, we attempt to answer two questions: 1) What will a DCNN see when we present it with a liver image? and 2) How can we refine the current classification strategy to improve the classification performance? In this section, we first discuss extensive experiments that have been conducted based on transfer learning using VGGNet [8]. Then, we analyse the features learned by VGGNet [8], and finally, we present the reason why we use the proposed FCNet for classification instead of constructing a deeper network, as performed in [8], [9]. A. Transfer Learning As described in [10], transfer learning refers to the ability to share and transfer knowledge between different tasks. Previous work has demonstrated that deep learning offers advantages for transfer learning tasks because the features learned by deep neural networks can capture most of the meaningful information that is useful for classification [11]. In many real-world classification tasks, it is difficult to satisfy the assumption that the training data and the data to be classified share the same distribution and the same feature space. For example, suppose that we have trained an AlexNet[12] for an object classification task, but we now wish to evaluate the quality of images [13], [14], or we simply want to know how to take better selfies [15]. In the above cases, transfer learning has the potential to improve performance and reduce the effort required for data labelling. The detailed transfer learning process for liver fibrosis classification from ultrasound images using VGGNet [8] is described later in Section III-A. Recent studies have found that heat maps are useful for feature analysis[16], [17]. Inspired by such a feature analysis
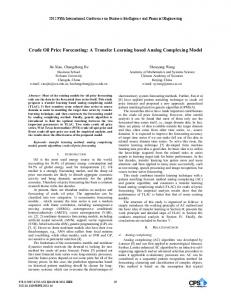
(a) ROI: Normal
(d) Normal
(b) ROI: S1-S3
(e) S1-S3
(c) ROI: S4
(f) S4
Fig. 1. Samples showing original region-of-interest (ROI) ultrasound images and the corresponding heat maps for three different stages of liver fibrosis. (a)-(c) are the ROI ultrasound images, and (d)-(f) are the corresponding heat maps of the ultrasound images. These three images represent three liver statuses: normal (Normal), fibrosis stage 1-3 (S1-S3) and fibrosis stage 4 (S4), respectively.
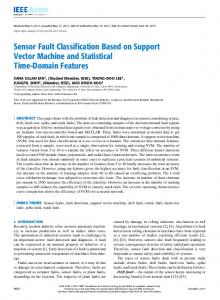
strategy, we use heat maps obtained from liver fibrosis images to visualize the differences between different stages of liver fibrosis and whether deep features provide sufficient information for liver fibrosis classification. Heat maps for liver images representing three liver statuses are shown in Fig. 1. B. Feature Analysis From Fig. 1, we can see that heat maps provide obvious clues for classifying the three represented liver statuses. Moreover, we observe that the colour of the activation regions in the heat maps is brighter when the texture information increases. We also plot histograms of these feature maps in Fig. 2. From a comparison, we find that fibrotic liver regionof-interest (ROI) images have much flatter texture distributions (the maximum histogram frequencies for normal liver, earlystage liver fibrosis, and late-stage liver fibrosis are 40, 18 and 30, respectively) and much wider intensity distributions than those of a normal liver (the maximum value for normal liver is only 4.5, whereas the maximum values for earlystage liver fibrosis and late-stage liver fibrosis are 9 and 7, respectively). These findings seem completely consistent with the observations reported in [18]. These phenomena indicate that the features learned by VGGNet [19] based on transfer learning already provide sufficient classification information compared with the original ROI ultrasound images. C. Deeper Network or Deeper Classifier? Our dataset consists of a total of 279 ROI ultrasound images, including 79 healthy liver ROI images, 89 ROI images representing early-stage liver fibrosis, and 111 ROI images representing late-stage liver fibrosis. It is well known that a deeper network can achieve better performance. However, a deeper network also requires tens of thousands of images for training to avoid divergence, whereas we have only 279 ROI ultrasound images at hand. To improve the performance for this limited number of ROI ultrasound images, we design FCNet for liver status classification. The architecture of our proposed FCNet is detailed in Section III-B.
2169-3536 (c) 2016 IEEE. Translations and content mining are permitted for academic research only. Personal use is also permitted, but republication/redistribution requires IEEE permission. See http://www.ieee.org/publications_standards/publications/rights/index.html for more information.
This article has been accepted for publication in a future issue of this journal, but has not been fully edited. Content may change prior to final publication. Citation information: DOI 10.1109/ACCESS.2017.2689058, IEEE Access 3
(a) Normal
(b) S1-S3
(c) S4
Fig. 2. Histograms of feature maps in fc7 obtained from ultrasound images representing three different liver fibrosis stages: (a) normal (Normal), (b) early-stage fibrosis (S1-S3) and late-stage fibrosis (S4).
III. O UR A PPROACH Liver fibrosis classification based on ultrasound images can be regarded as a pattern recognition task. Such a task usually consists of two procedures: feature extraction and classification. In the following, we first introduce our feature extraction method, in which transfer learning is applied to achieve better performance. Then, we propose FCNet for deepfeature-based liver fibrosis classification. A. Deep feature extraction method based on transfer learning Instead of training a network from scratch, in our experiments, we use VGGNet pre-trained on the ILSVRC
dataset[20]. VGGNet [8] is a DCNN that consists of five convolutional layers, three pooling layers and two 4096dimensional fully connected layers followed by a 1000-way softmax layer. Inspired by VGGNet [8], and to make the deep features extracted by the DCNN more discriminative for the target task of liver fibrosis classification, we use the transfer learning technique to fine-tune the pre-trained VGGNet model on the ILSVRC dataset for the 3-way liver fibrosis classification task by using ROIs cropped from liver ultrasound images. The architecture used in this paper is shown in Fig. 3. In particular, we replace the last 1000-way fully connected layer (f c8) with a new 3-way layer (f c8 liver) with randomly initialized weights W drawn from a normal distribution as follows: W ∼ N (µ = 1, σ 2 = 0.01). We set the learning rate for transfer learning as suggested in [21], [22]. We initialize the global rate to one tenth of the initial learning rate for the ILSVRC dataset[20] and decrease it by a factor of 10 throughout training; however, the learning rate in the new f c8 liver layer is set 10 times higher than the global learning rate. B. Classification using FCNet From Section III-A, we observe that a DCNN can tell the difference between normal liver images and abnormal liver images, and furthermore, it can distinguish between different stages of liver fibrosis. This suggests that the deep features extracted in this way can be effectively used for classification via a fully connected network, as these features contain rich information. Because the number of liver ultrasound images we have collected is small, establishing a deeper network and training a network from scratch is not feasible. However, we may attempt to feed the deep features obtained from the previous step into another neural network, which can be considered an alternative means of constructing a deeper network. We propose a new classifier based on FCNet to improve the classification performance for liver images. The architecture of our proposed FCNet is shown in Fig. 4. Our FCNet takes the 4096-dimensional f c7 features extracted by the previous deep feature extraction model as its input, and it consists of three fully connected layers (ip1, ip2 and ip3). To avoid over-fitting, we adopt the “dropout” strategy (following [23]). Specifically, for every fully connected layer, we add a corresponding dropout layer (drop1, drop2 and drop3, respectively). We also include a Rectified Linear Units (ReLU) layer (relu1) after the first fully connected layer (ip1) to address the gradient vanishing problem [24]. We use formula (1) to compute the loss of our FCNet model: N 1 ∑ E(W, b) = − [yn logσW,b (xn )+(1−yn )log(1−σW,b (xn ))] N n=1 (1) 1 where σw,b (xn ) = 1+exp(−W T x ) , N is the number of training n samples, and yn ∈ {0, 1, 2} is the true label of the nth liver sample image, where yn = 0 denotes that the status of the imaged liver is normal and yn = 1 and yn = 2 indicate liver images representing S1-S3 fibrosis and S4 fibrosis,
2169-3536 (c) 2016 IEEE. Translations and content mining are permitted for academic research only. Personal use is also permitted, but republication/redistribution requires IEEE permission. See http://www.ieee.org/publications_standards/publications/rights/index.html for more information.
This article has been accepted for publication in a future issue of this journal, but has not been fully edited. Content may change prior to final publication. Citation information: DOI 10.1109/ACCESS.2017.2689058, IEEE Access 4
Fig. 3. The architecture of our deep feature extraction method.
Fig. 4. The architecture of our proposed fully connected neural network (FCNet).
respectively. In the back-propagation stage, we use formula (2) to calculate partial derivatives, which will be used in the stochastic gradient decent (SGD) algorithm to find the optimal solution for formula (1). (a) Left (c) Top (d) Bottom (b) Right ∂E(W, b) ∂E(W, b) ∂σW,b (xn ) = ∂xn ∂σW,b (xn ) xn )Fig. 5. Examples of the cropping of one image from four directions in steps ( 1 − yn 1 1 2 pixels with zero padding: (a) from the left, (b) from the right, (c) from the (σW,b (xn ) (1 − σW,b (xn )) of yn − =− top and (d) from the bottom. The black dashed rectangle represents the original N σ(xn ) 1 − σW,b (xn ) ROI liver image, and the rectangles in red, blue, green and orange represent 1 = (2) the image as cropped from the left, right, top and bottom, respectively. (σW,b (xn ) − yn ) N Given a test sample xj , the final classification is given by We randomly chose 70% of the ROI images in image set B [prob, C] = max(W T xj + b) (3) as the training set for transfer learning and used the remaining 30% of the images as the test set. Our feature extraction model where W and b are the parameters learned during the training is a snapshot of the 20000th iteration. stage and prob denotes the probability that sample xj belongs The loss during training fluctuated from 0.003 to 0.001 (see to class C. Fig. 6), and the testing loss was approximately 0.02 during the testing stage. Over-fitting occurred during the training stage, IV. E XPERIMENTS resulting in lower accuracy on the test set. Notably, the DCNN In this section, we evaluate and analyse the performance did its utmost to differentiate among different liver fibrosis of our proposed method and compare it with state-of-the- statuses, as analysed in Section II-B. After fine-tuning, we extracted deep features from the 1674 art algorithms. Raw liver fibrosis ultrasound image samples were acquired from Shanghai Jiaotong University Number ROI liver images in image set B based on the fine-tuned model Six People’s Hospital. We collected only 279 cases; more and fed these features into our proposed FCNet classifier. cases will be obtained through practical application. The 279 Again, we used the same 70% of the ROI images that were collected cases include 79 normal ROI ultrasound liver images, used for transfer learning as the training set to train the FCNet 89 early-stage fibrosis ROI images and 111 late-stage fibrosis classifier, and the other 30% of the images were used as the ROI images, as diagnosed by clinicians. To perform the liver test set. Then, we tested the proposed liver fibrosis framework fibrosis classification task, before fine-tuning, we cropped using 30% of the images in set B, the 279 images in image every ROI image from four directions in steps of 2 pixels with set A, and the test set from set B combined with the entirety zero padding (see Fig. 5), and we flipped every ROI image of set A. The performances are shown in Table I. In Table I, in addition to recent state-of-the-art DCNN archihorizontally and vertically. Thus, in addition to the original 279 ROI liver fibrosis images (image set A), we obtained 1674 tectures such as AlexNet [12], CaffeNet [19], and VGGNet [8], further ROI ultrasound images (image set B). For the learning we also compare our proposed method with combinations of of deep features via transfer learning, we used image set B to the deep features extracted by VGGNet [8] and four classical machine learning classifiers (Random Forest, SVM, Gradient fine-tune the VGGNet model as described in Section III-A.
2169-3536 (c) 2016 IEEE. Translations and content mining are permitted for academic research only. Personal use is also permitted, but republication/redistribution requires IEEE permission. See http://www.ieee.org/publications_standards/publications/rights/index.html for more information.
This article has been accepted for publication in a future issue of this journal, but has not been fully edited. Content may change prior to final publication. Citation information: DOI 10.1109/ACCESS.2017.2689058, IEEE Access 5
TABLE I P ERFORMANCE COMPARISON ON LIVER FIBROSIS IMAGES .
AlexNet [12] CaffeNet [19] VGGNet [8] VGGNet-A + RF VGGNet-B + RF VGGNet-C + RF VGGNet-D + RF VGGNet-A + SVM VGGNet-B + SVM VGGNet-C + SVM VGGNet-D + SVM VGGNet-A + GBDT VGGNet-B + GBDT VGGNet-C + GBDT VGGNet-D + GBDT VGGNet-A + MLP VGGNet-B + MLP VGGNet-C + MLP VGGNet-D + MLP Our Method
Test: 30% of Set B 84.65% 89.37% 87.40% 85.04% 91.92% 91.93% 92.13% 83.27% 92.91% 91.53% 93.70% 81.88% 91.54% 82.28% 92.72% 83.47% 92.32% 87.60% 92.52% 93.90%
Trained on 70% of Set B Test: Set A Test: 30% of Set B + Set A 90.32% 86.66% 97.13% 92.12% 96.41% 90.59% 96.77% 89.20% 97.13% 93.77% 99.28% 94.54% 99.64% 94.79% 93.55% 86.91% 100.00% 95.42% 97.13% 93.52% 99.64% 95.80% 88.17% 84.12% 98.57% 94.03% 89.61% 84.88% 99.28% 95.04% 90.32% 85.89% 99.64% 94.92% 94.62% 90.08% 99.64% 95.04% 100.00% 96.06%
Test: 30% of Set A 61.90% 64.28% 66.67% 66.67% 61.90% 61.90% 64.29% 65.48% 61.90% 65.47% 64.29% 59.52% 64.29% 60.71% 63.10% 65.47% 61.90% 65.64% 64.29% 63.28%
Trained on 70% of Set A Test: Set B Test: 30% of Set A + Set B 82.21% 81.25% 75.83% 75.28% 77.60% 77.08% 78.61% 78.04% 81.32% 80.41% 82.27% 81.32% 82.33% 81.48% 80.67% 79.95% 82.38% 81.41% 80.67% 79.95% 82.15% 81.31% 79.37% 78.34% 82.15% 81.31% 79.14% 78.27% 80.61% 79.79% 79.43% 78.77% 80.73% 79.84% 79.43% 78.77% 82.03% 81.19% 83.03% 82.10%
All results in the table were achieved using the transfer learning strategy. VGGNet-A and VGGNet-C represent the fc6 and fc7 features, respectively, obtained by VGGNet without normalization. VGGNet-B and VGGNet-D represent the fc6 and fc7 features, respectively, obtained by VGGNet with normalization. VGGNet-i + CLFi represents the features obtained by the fc6/fc7 layers of VGGNet and then classified by CLFi , where CLFi represents one of the flowing classifiers: RF, SVM, GBDT, and MLP.
with VGGNet-A and VGGNet-C. 4) More training data can also contribute to improving the performance of DCNNs, as seen from the fact that the performance improves considerably when we expand the size of the training set from 70% of image set A to 70% of image set B. V. C ONCLUSION
Fig. 6. Training and testing losses in liver fibrosis classification based on VGGNet and transfer learning.
Boosting Decision Tree and Multilayer Perceptron). In Table I, VGGNet-A and VGGNet-C represent the fc6 and fc7 features, respectively, obtained by VGGNet without normalization, and VGGNet-B and VGGNet-D represent the fc6 and fc7 features, respectively, obtained by VGGNet with normalization. From Table I, we can draw the following conclusions: 1) VGGNet achieves the best performance when compared with AlexNet and CaffeNet, which indicates that a deeper network achieves better performance. As a result, it is clear that our proposed method should achieve the best performance because it can be regarded as an alternative means of cascading three fully connected layers after VGGNet. 2) The features generated by the fc7 layer are more discriminative than the features obtained from the fc6 layer, as features that are closer to the final output layer have a higher capability of abstraction. 3) Classifiers are sensitive to feature normalization. For example, VGGNet-B and VGGNet-D always perform better compared
In this paper, we proposed a new framework for liver fibrosis classification based on ultrasound images using transfer learning and FCNet. We learned deep features via transfer learning and VGGNet and trained a fully connected network (FCNet) classifier to predict normal, early-stage fibrosis and late-stage stage fibrosis liver statuses. With this novel framework, tests show that our deep features combined with the FCNet can provide suitable information to enable the construction of the most accurate prediction model when compared with other methods. In our future studies, we would like to develop a real-time computer-aided ultrasound image diagnosis system for liver fibrosis based on this approach. VI. ACKNOWLEDGMENTS This work was supported in part by the National Natural Science Foundation of China (Grant No. 61375015), and was supported in part by the NSFC-Zhejiang Joint Fund for the Integration of Industrialization and Informatization under Grant No. U1609220. R EFERENCES [1] K. Ogawa, M. Fukushima, K. Kubota, and N. Hisa, “Computer-aided diagnostic system for diffuse liver diseases with ultrasonography by neural networks,” IEEE Transactions on Nuclear Science, vol. 45, no. 6, pp. 3069–3074, 1998.
2169-3536 (c) 2016 IEEE. Translations and content mining are permitted for academic research only. Personal use is also permitted, but republication/redistribution requires IEEE permission. See http://www.ieee.org/publications_standards/publications/rights/index.html for more information.
This article has been accepted for publication in a future issue of this journal, but has not been fully edited. Content may change prior to final publication. Citation information: DOI 10.1109/ACCESS.2017.2689058, IEEE Access 6
[2] C. M. Wu, Y. C. Chen, and K. S. Hsieh, “Texture features for classification of ultrasonic liver images.” IEEE Transactions on Medical Imaging, vol. 11, no. 2, pp. 141–152, 1992. [3] A. Mojsilovic, S. Markovic, and M. Popovic, “Characterization of visually similar diffuse diseases from B-scan liver images with the nonseparable wavelet transform,” IEEE Transactions on Medical Imaging, vol. 17, no. 4, pp. 541–549, 1998. [4] W. C. Yeh, S. W. Huang, and P. C. Li, “Liver fibrosis grade classification with B-mode ultrasound,” Ultrasound in Medicine & Biology, vol. 29, no. 9, pp. 1229–1235, 2003. [5] R. Miotto, L. Li, B. A. Kidd, and J. T. Dudley, “Deep patient: An unsupervised representation to predict the future of patients from the electronic health records,” Scientific reports, vol. 6, 2016. [6] P. Nguyen, T. Tran, N. Wickramasinghe, and S. Venkatesh, “Deepr: A convolutional net for medical records,” IEEE Journal of Biomedical and Health Informatics, pp. 21–29, 2016. [7] L. Nie, M. Wang, L. Zhang, S. Yan, B. Zhang, and T.-S. Chua, “Disease inference from health-related questions via sparse deep learning,” IEEE Transactions on Knowledge and Data Engineering, vol. 27, no. 8, pp. 2107–2119, 2015. [8] K. Simonyan and A. Zisserman, “Very deep convolutional networks for large-scale image recognition,” in The 5th International Conference on Learning Representations, 2015. [9] C. Szegedy, W. Liu, Y. Jia, P. Sermanet, S. Reed, D. Anguelov, D. Erhan, V. Vanhoucke, and A. Rabinovich, “Going deeper with convolutions,” in IEEE Conference on Computer Vision and Pattern Recognition, 2015. [10] Y. Bengio, A. Courville, and P. Vincent, “Representation learning: A review and new perspectives,” IEEE Transactions on Pattern Analysis and Machine Intelligence, vol. 35, no. 8, pp. 1798–1828, 2013. [11] S. Pan and Q. Yang, “A survey on transfer learning,” IEEE Transactions on Knowledge Data Engineering, vol. 22, no. 10, pp. 1345–1359, 2010. [12] A. Krizhevsky, I. Sutskever, and G. E. Hinton, “Imagenet classification with deep convolutional neural networks,” in Advances in Neural Information Processing Systems (NIPS), 2012. [13] W. Hou, X. Gao, D. Tao, and X. Li, “Blind image quality assessment via deep learning,” IEEE Transactions on Neural Networks and Learning Systems, vol. 26, no. 6, pp. 1275–1286, 2015. [14] K. Gu, G. Zhai, X. Yang, and W. Zhang, “Deep learning network for blind image quality assessment,” in IEEE International Conference on Image Processing (ICIP), 2014, pp. 511–515. [15] A. Karpathy, “What a deep neural network thinks about your selfie.” [Online]. Available: http://karpathy.github.io/2015/10/25/selfie/ [16] C. Huang, Z. He, G. Cao, and W. Cao, “Task-driven progressive part localization for fine-grained object recognition,” IEEE Transactions on Multimedia, vol. 18, no. 12, pp. 2372–2383, 2016. [17] G. Ghiasi and C. Fowlkes, “Laplacian pyramid reconstruction and refinement for semantic segmentation,” in The 14th European Conference on Computer Vision, 2016. [18] G. Cao, P. Shi, and B. Hu, “Liver fibrosis identification based on ultrasound images captured under varied imaging protocols,” Journal of Zhejiang University Science, vol. 445, pp. 1107–1114, 2005. [19] Y. Jia, S. Evan, D. Jeff, K. Sergey, L. Jonathan, G. Ross, G. Sergio, and D. Trevor, “Caffe: Convolutional architecture for fast feature embedding,” in Proceedings of the 22nd ACM international conference on Multimedia, 2014. [20] O. Russakovsky, J. Deng, H. Su, J. Krause, S. Satheesh, S. Ma, Z. Huang, A. Karpathy, A. Khosla, M. Bernstein, A. Berg, and F. Li, “Imagenet large scale visual recognition challenge,” in International Journal of Computer Vision, 2015. [21] C. Huang, Z. He, G. Cao, and W. Cao, “Task-driven progressive part localization for fine-grained recognition,” IEEE Transactions on Multimedial (TMM), vol. 18, pp. 2372–2383, 2016. [22] K. He, X. Zhang, S. Ren, and J. Sun, “Pyramid pooling in deep convolutional networks for visual recognition,” IEEE Transactions on Pattern Analysis and Machine Intelligence, vol. 37, pp. 1904–1916, 2015. [23] G. E. Hinton, N. Srivastava, A. Krizhevsky, I. Sutskever, and R. R. Salakhutdinov, “Improving neural networks by preventing co-adaptation of feature detectors,” Computer Science, vol. 3, pp. 212–223, 2012. [24] X. Glorot, A. Bordes, and Y. Bengio, “Deep sparse rectifier neural networks,” Journal of Machine Learning Research, vol. 15, pp. 315– 323, 2010.
2169-3536 (c) 2016 IEEE. Translations and content mining are permitted for academic research only. Personal use is also permitted, but republication/redistribution requires IEEE permission. See http://www.ieee.org/publications_standards/publications/rights/index.html for more information.