ISRM International Symposium 2008 5th Asian Rock Mechanics Symposium (ARMS5), 24-26 November 2008 Tehran, Iran
EFFECT OF JOINT STIFFNESS VALUES ON STRESSES OF JOINTED ROCKS A. NOORZAD1 and M. AMINPOOR2 1
Power and Water University of Technology, Tehran, Iran (
[email protected]) 2
Sabir Company, Tehran, Iran
Abstract The behavior of joints and intact rock is characterized by some parameters which have interactive effects on rock mass problems. Moreover, some of these parameters are not easily measured and they may be variable in the region of the problem. Joint normal and shear stiffness are the mechanical parameters which can be assessed in distinct element modeling. Knowing that the strength conditions of discontinuities are determined by the stress distribution through the model and along discontinuities, this paper is concerned on the effect of selected stiffness values on Distinct Element Method (DEM) computed stresses in the rock masses. Keywords: Rock mass; Distinct Element Method (DEM); Stress; Joint stiffness; Rock slope
1. Introduction
2.1. Stiffness estimated from rock mass properties
Development of distinct element method (DEM) has been a significant step to identify the behavior of fractured rock masses. The behavior of joints and intact rock is defined by some parameters which have interactive effects on problems. Some of these parameters are not easily measured and furthermore may be variable in the region of the problem. Thus it is momentous to recognize the influence of variation of these parameters and their interactive effects on reliability of modeling results. Joint normal and shear stiffness are the mechanical parameters which can be evaluated by distinct element modeling. It sounds to be essential to know the effects of selected stiffness values on the obtained results.
Approximate stiffness values can be backcalculated from information on the deformability and joint structure in the jointed rock mass and the deformability of the intact rock. If the jointed rock mass is assumed to have the same deformational response as an equivalent elastic continuum, then relations can be derived between jointed rock properties and equivalent continuum properties. For uniaxial loaded rock containing a single set of uniformly spaced joints oriented normal to the direction of loading, the following relation applies.
1 1 1 = + E m Ei k n L
2. Estimation of Joint Stiffness
(1)
where Em is rock mass modulus; Ei is intact rock modulus; kn is joint normal stiffness; and L is mean joint spacing. Eq. (1) can be rearranged to obtain the joint normal stiffness as given in Eq. (2).
Joint stiffness is not an easily measured or well known parameter. Methods of estimating joint stiffness have been derived. Two possible methods are presented here. One is based on the deformation properties of the rock mass and the intact rock; the other is adopted from the properties of the joint infilling material.
kn =
Ei E m L( Ei − E m )
(2)
The same expression can be used to derive a relation for the joint shear stiffness. 437
ks =
Gi Gm
3. Empirical Relation of Joint Stiffness Values
(3)
L(Gi − Gm )
Values for normal and shear stiffness of rock joints typically can range from roughly 10 to 100 MPa/m (for joints with soft clay infilling), to over 100 GPa/m (for tight joints in granite and basalt). Published data on stiffness properties for rock joints are limited; summaries of data can be found in Kulhawy [5], Rosso [6] and Bandis et al. [7]. It is important to recognize that joint properties measured in the laboratory, typically are not representative of those for real joints in the field. Scale dependence of joint properties is a major question in rock mechanics. Often, the only way to direct the choice of appropriate parameters is to select the similar joint properties derived from field tests. However, field test observations are limited. Some results are published by Kulhawy [5]. Infanti and Kanji [8] reported that ks values range from 0.02 to 2 GPa/m over the normal stress range of 0.1-10 MPa. Table 1 shows the dependence of joint stiffness parameters pertinent to clay infilling thickness [8].
where Gm is rock mass shear modulus; Gi is intact rock shear modulus; and ks is joint shear stiffness. The equivalent continuum assumption, when extended to three orthogonal joint sets, provides the following relations. ⎛ 1 1 Ea = ⎜⎜ + ⎝ Ei La k na
−1
⎞ ⎟⎟ ( a = 1,2,3) ⎠
(4)
−1
⎛ 1 1 1 ⎞ ⎟⎟ (a, b = 1,2,3) + Gab = ⎜⎜ + ⎝ Gi La k sa Lb k sb ⎠
(5)
Several expressions have been derived for two- and three-dimensional characterizations and multiple joint sets. References for these derivations can be found in Singh [1], Gerrard [2, 3] and Fossum [4]. 2.2. Stiffness estimated from joint infill properties Another approach for estimating joint stiffness assumes that a joint has an infill material with known elastic properties. The stiffness of a joint can be evaluated from the thickness and modulus of the infilling material by the following equations.
E kn = 0 h
(6)
G0 h
(7)
ks =
Table 1. Dependence of stiffness on clay-filling thickness Clay-filling thickness (mm)
where kn is joint normal stiffness; ks is joint shear stiffness; Eo is Young’s modulus of infill material; Go is shear modulus of infill material; and h is joint thickness or opening.
GPa/m (kn)
GPa/m (kS)
ratio k n ks
50-100
0.1-0.5
0.01-0.1
6
10-20
0.5-2.0
0.1-0.6
3.6
5.0
>1.0
5
4. Stresses in Jointed Rocks Rock mechanics problems are usually very sensitive to the Poisson’s ratio chosen for a rock mass. This is because joints and intact rock are pressure-sensitive: their failure criteria are functions of the confining stress (e.g. the MohrCoulomb criterion). Capturing the true Poisson 438
behavior of a jointed rock mass is critical for meaningful numerical modeling. The effective Poisson’s ratio of a rock mass is comprised in two parts: (1) a component due to the jointing; and (2) a component due to the elastic properties of the intact rock. Except at shallow depths or low confining stress levels, the compressibility of the intact rock makes a large contribution to the compressibility of a rock mass as a whole. Thus, the Poisson’s ratio of the intact rock has a significant effect on the Poisson’s ratio of a jointed rock mass. A single Poison’s ratio, ν, is defined only for isotropic elastic materials. However, there are only a few jointing patterns which lead to isotropic elastic properties for a rock mass. Therefore, it is convenient to use the stress ratio for anisotropic materials. The “stress ratio” will be defined as the ratio of horizontal-to-vertical stress when a load is applied in the vertical direction and no strain is allowed in the horizontal direction. Plane strain conditions are assumed. As an example, the stress ratio for an isotropic elastic material is
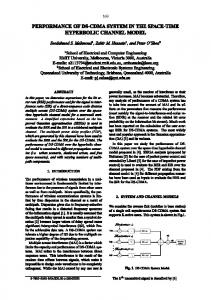
Fig. 1. Model for examination of stress ratio in rock
The compliance matrix due to the two equally spaced sets of joints dipping at 450 is
C ( jointing ) =
1 2 Sk n k s
⎡k s + k n ⎢k − k n ⎣ s
ks − kn ⎤ k s + k n ⎥⎦
(9)
Thus, the stress ratio for the rock mass as a whole is
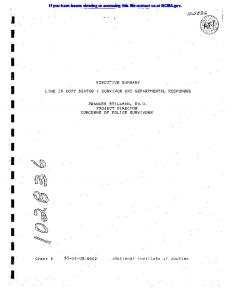
σ xx [υ (1 + υ )]/ E + (kn − ks ) /(2Skn ks ) (10) = σ yy [(1 + υ )(1 − υ )] / E + (kn + ks ) /(2Skn ks ) Eq. (10) can be displayed for different values of E/(Skn) for the case of ν = 0.2 (Figure 2). Also plotted are the results of UDEC simulations. For low values of E/(Skn), the stress ratio of a rock mass is dominated by the elastic properties of the intact rock. For high values of E/(Skn), the stress ratio is controlled by jointing [9].
σ xx υ (8) = σ yy 1 − υ The stress ratio is a function of the orientation and elastic properties of the joints. Consider the special case shown in Figure 1. A rock mass contains two sets of equally spaced joints dipping at an angle, θ, from the horizontal. The elastic properties of the joints consist of a normal stiffness, kn, and a shear stiffness, ks. The contribution of the elastic properties of the intact rock will be examined for the case of θ=450. The intact rock will be treated as an isotropic elastic material. The elastic properties of the rock mass as a whole will be derived by adding the compliances of the jointing and the intact rock.
Fig. 2. Stress ratio for the rock model
439
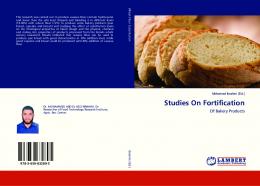
5. DEM Joint Behavior Model The basic joint model used in UDEC captures several features which are representatives of the physical response of joints. In the normal direction, the stress-displacement relation is assumed to be linear and governed by the stiffness kn such that
Δσ n = − k n Δ u n
(11)
Δu n is the effective normal stress increment; and Δu n is the normal displacement increment. There is also a limiting tensile strength, T, for the joint. If the tensile strength is exceeded (i.e., if σ n < −T), then σ n = 0 . Similarly, for the
where
Fig. 3. DEM basic joint behavior model
6. Distinct Element Rock Slope Model
shear, the response is controlled by constant shear stiffness, ks. The shear stress, τs, is limited by a combination of cohesive (C) and frictional (φ) strength. Thus, if |τs| ≤ C + σn tan φ = τmax
The northern abutment of Gotvand dam comprises of a dislocated rock mass including discontinuity sets of the joints and bedding. The rock mass is formed of conglomerate. In order to examine the joint stiffness effects on computed stresses, a distinct element model of this rock slope has been developed.
(12)
then
Δτ s = − k s Δu se
(13)
6.1. Selection of stiffness values for rock joints
or else, if
τ s ≥ τ max
(14)
Shear stiffness values have been estimated through shear stress versus shear displacement curves obtained from in situ direct shear tests as given in Table 2 [10].
then
τ s = sign(Δu s )τ max
(15)
Table 2. Estimated shear stiffness discontinuities on the rock mass
where Δu se is the elastic component of the incremental shear displacement; and Δu s is the total incremental shear displacement. Dilation is a function of the direction of shearing. Dilation increases if the shear displacement increment is in the same direction as the total shear displacement, and decreases if the shear increment is in the opposite direction. Figure 3 illustrates the basic joint behavior of model described in this section [9].
values
Discontinuity
Shear stiffness (GPa/m)
Joint sets
0.17
Bedding
0.13
for
Due to the test limitations and complexity of stiffness determination for discontinuities, parametric analysis for a reasonable range of inputs has been performed. Regarding to clayey infillings and small thickness of joints in the rock mass which is often less than 5 milimeters, shear stiffness can 440
be assigned more than 0.6 GPa/m and less than 1.0 GPa/m and normal stiffness is between 2.4 to 4.0 GPa/m assumed to be 4 times of shear stiffness. As one of the few reports concerning joint stiffness values of conglomerate, Eberhardt et al. [11] have obtained the shear and normal stiffness values for conglomerate equal to 1.0 and 5.0 GPa/m, respectively, with back analysis of 1999 Rufi landslide,.
3
1.70
6.80
1.30
5.2
-
k s and k n are 10
times as model 1. - k s values 4
0.85
8.50
0.65
6.50
are
the
same as model 2. -Ratio
kn
is 10.
ks
6.2. Effect of joint stiffness values on stresses In order to evaluate the effects of joint stiffness values on computed stresses, four models with same characteristics except joint stiffness have been made. Stiffness values have been chosen as reported in literature. Utilized values in these four models are listed in Table 3. The Mohr-Coulomb criterion has been considered for intact rocks in these models. All of discontinuities assumed to be glued (with high values of strengths). So no joint slip happens in the models which may change the problem conditions, in order to make a meaningful comparison. Three zones are adopted for record and comparison of stresses. The zones located in different depths are shown in Figure 4.
Fig. 4. Location of the zones for comparison of stress variations
Table 4 includes the final stress ratios recorded in controlling zones in four models, after reaching to equilibrium.
Table 3. Stiffness values employed for distinct element models joints Model No.
bedding
0.17
0.68
0.13
0.52
Model No.
3.40
0.65
2.60
kn ks
are
kn
is 4.
ks 0.85
E Sk n
zone 1
Zone 2
Zone 3
obtained from tests. - Ratio
2
σ xx σ yy
explanations
kS kn kS kn GPa GPa GPa GPa ( )( )( )( ) m m m m
- k s values 1
Table 4. Final stress ratios in the models at the controlling zones
-
k s and k n are 5
times as model 1.
441
1
6.6
4
1.295
0.629
0.380
2
1.3
4
1.343
0.610
0.380
3
0.6
4
3.672
0.416
0.221
4
0.5
10
0.911
0.486
0.412
Variation of stress ratios with E Sk n in the models of 1, 2 and 3 which have the same joint stiffness ratios and different stiffness values is shown in Figure 5. Variation of stress ratios with k n k s in the models 2 and 4, which have the same joint shear stiffness, is illustrated in Figure 6. The obtained results demonstrate that: • The stress ratio is not approximately sensitive to variation of E Sk n in high values of E Sk n (more than about 1.5). But in smaller
Fig. 6. Variation of stress ratios versus
kn ks
in the
models 2 and 4.
7. Conclusion
values of E Skn , stress ratio may change by E Sk n , particularly in surface regions. So
Distinct element rock mass modeling is known as an appropriate method to analyze the behavior of fractured rock masses which may lead to rock slip along discontinuities. Most of instability conditions in fractured rocks are due to block sliding along discontinuities in which the shear stresses reach to shear strengths. In the other hand, the joint shear strength is a function of joint normal stress. The joint stiffness changes the shear and normal stresses on the joints due to the variations of stress ratios. Stress levels and intact rock modulus of elasticity can modify the effect of the stiffness on computed stresses.
for problems with low values of E Sk n , sensitivity analysis for joint stiffness values might be necessary, especially for the cases susceptible to surface instability. • Variation of k n k s may modify the stress ratio. Change of stresses may be considerable in surface regions. Such selected value for normal stiffness which seems unimportant in jointed rock problems may affect on computed stresses, especially in surface zones.
References 1. Singh, B., 1973. Continuum characterization of jointed rock masses: Part I-The constitutive equations, Int. J. Rock Mech. Min. Sci. & Geomech., 10, pp. 311-335. 2. Gerrard, C. M., 1982. Elastic models of rock masses having one, two and three sets of joints, Int. J. Rock Mech. Min. Sci. & Geomech., 19, pp. 15-23.
Fig. 5. Variation of stress ratios versus
3. Gerrard, C. M., 1982. Equivalent elastic moduli of a rock mass consisting of orthorhombic layers, Int. J. Rock Mech. Min. Sci. & Geomech. Abstr., 19, pp. 9-14.
E Sk n in the
models of 1, 2 and 3.
4. Fossum, A. F., 1985. Technical note: Effective elastic properties for a randomly jointed rock mass, Int. J. Rock Mech. Min. Sci. & 442
Geomech., 22(6), pp. 467-470. 5. Kulhawy, F. H., 1975. Stress deformation properties of rock and rock discontinuities, Engineering Geology, 9, pp. 327-350. 6. Rosso, R. S., 1976. A comparison of joint stiffness measurements in direct shear, triaxial compression and in-situ, Int. J. Rock Mech. Min. Sci. & Geomech., 13, pp. 167-172. 7. Bandis, S. C., A. C., Lumsden and N. R., Barton, 1983. Fundamentals of rock joint deformation, Int. J. Rock Mech. Min. Sci. & Geomech., 20(6), pp. 249-268. 8. Infanti, N. and M. A., Kanji, 1978. In situ shear strength, normal and shear stiffness determinations at Arua Vermelha project. Proceedings of Third International Congress of the International Association of Engineering Geology, Madrid, Vol. 2, pp. 175-83. 9. Itasca, 2004. UDEC-Universal Distinct Element Code (Version 4.0). Itasca Consulting Group, Inc., Minneapolis. 10. Mahab Ghodss Consulting Engineers, 2007. Overall review of geological and geotechnical characteristics of Gotvand dam site. 11. Eberhardt, E., K., Thuro1 and M., Luginbuehl, 2005. Slope instability mechanisms in dipping interbedded conglomerates and weathered marls-the 1999 Rufi landslide, Switzerland Engineering Geology 77, pp. 35-56.
443
444


![Fixed Points: [[1 0 1 0 1 1 0 1 0 1 1 1 1 1 1 1] ] - GitHub](https://m.moam.info/img/260x300/fixed-points-1-0-1-0-1-1-0-1-0-1-1-1-1-1-1-1-githu_64772cfc097c4744708b6ac2.jpg)