be considered in remote usability of mobile Web applications, and introduce ... particular for usability evaluation but can be configured to capture general and custom ..... A further integration that we have designed is an App for Android mobile ...
Remote Usability Evaluation of Mobile Web Applications Paolo Burzacca and Fabio Paternò CNR-ISTI, HIIS Laboratory, via G. Moruzzi 1, 56124 Pisa, Italy {paolo.burzacca,fabio.paterno}@isti.cnr.it
Abstract. Recent proliferation of mobile devices has made it important to provide automatic support for usability evaluation when people interact with mobile applications. In this paper, we discuss some specific aspects that need to be considered in remote usability of mobile Web applications, and introduce a novel environment that aims to address such issues. Keywords: Remote Evaluation, Logging Tools, Mobile Usability.
1
Introduction
In usability evaluation, automatic tools can provide various types of support in order to facilitate this activity and help developers and evaluators to gather various useful pieces of information. Several approaches have been put forward for this purpose. Some tools allow users to provide feedback on the considered applications through questionnaires or reporting critical incidents or other relevant information. Other proposals have been oriented to providing some automatic analysis of the user interface implementation in order to check its actual conformance to a set of guidelines. A different approach consists in gathering information on actual user behaviour and helping evaluators in analysing it in order to identify possible usability problems. In remote usability evaluation evaluators and users are separated in time and/or space. This is important in order to analyse users in their daily environments and decrease the costs of the evaluation by avoiding the need to use specific laboratories and to ask users to move. The purpose of this paper is to discuss the possibilities offered by remote usability evaluation of mobile applications based on logging user interactions and supporting the analysis of such data. We describe the novel issues raised by this type of approach and provide concrete indications about how they can be addressed, in particular when Web applications are accessed through mobile devices. In the paper we first discuss related work; next we provide a discussion of the important aspects that have to be considered when designing support for remote evaluation of mobile application; and then introduce examples of possible solutions to such issues provided by a novel version of a remote evaluation environment. Lastly, we draw some conclusions and provide indications for future work. M. Kurosu (Ed.): Human-Computer Interaction, Part I, HCII 2013, LNCS 8004, pp. 241–248, 2013. © Springer-Verlag Berlin Heidelberg 2013
242
2
P. Burzacca and F. Paternò
Related Work
Ivory and Hearst [1] provided a good discussion of tools for usability evaluation according to a taxonomy based on four dimensions: method class (the type of evaluation); method type (how the evaluation is conducted); automation type (the evaluation phase that is automated: capture, analysis, re-design, …); and effort level (the type of effort required to apply the method for the evaluators and the users). In this work we plan to consider usability testing solutions based on user interactions logs, and discuss how to provide automatic support for analysis of such information and a number of visualizations to ease the identification of any usability issues. Extracting usability information from user interface events has long been considered [2], and stimulated the development of various tools for this purpose, but previous work has not been able to adequately support usability evaluation of mobile applications. Google Analytics [3] is a widely used tool, which has not been proposed in particular for usability evaluation but can be configured to capture general and custom events at client-side, and offers a number of statistics information and reports. However, it is rather limited in terms of the number of events that it is able to capture for each session, and is not able to capture various events that only mobile devices can generate through their sensors. Model-based approaches have been used to support usability evaluation exploiting user logs. One example was WebRemUsine [4], which was a tool for remote usability evaluation of Web applications through browser logs and task models. The basic idea was to support an automatic analysis based on the comparison of the actual use of a system, represented by the logs, with the expected use described through a task model. This approach was mainly used to analyse desktop applications. It was useful to find usability problems but it also required some effort, since evaluators had first to develop a complete task model of the considered application. A version of this approach aiming to compare the designers’ task model with the actual use detected through a logging of mobile applications in Windows CE mobile devices was presented in [5]. In that case the logging tool had to communicate with the operating system to detect events and track the user’s activity. In this way it was also able to log events related to environmental conditions, such as noise, battery consumption, light, signal network, and position. It also contained some early attempt to graphically represent when the logged events deviate from the expected behaviour. In this paper we will discuss a different approach in which the user-generated logs will be compared with optimal logs created by the application designers in order to demonstrate the best way to perform the tasks. This approach was introduced in [6], even if that solution was limited in terms of intelligent analysis and how to represent the usability data collected. Previous work, such as WebQuilt [7], performed logging through a dedicated proxy server able to intercepts the HTTP requests to the application servers. However, this type of approach was not able to detect local events generated by the users (e.g. clicks, zoom, scroll events), which can provide useful information in usability evaluation. WELFIT [8] is a tool that performs logging through JavaScripts that are manually included in the analysed Web pages, it is relevant to the discussion presented, even if the representations provided for the usability analysis are not easy to interpret.
Remote Usability Evaluation of Mobile Web Applications
243
W3Touch [9] is a recent tool that performs some logging of interactions with Web applications in touch-based smartphones, still through JavaScripts, and the collected information is used to assess some metrics important for usability in such devices. The two main metrics considered are related to the number of zooming events and to the missed links in touch-based interaction. According to the values obtained from the metrics the designers can apply some adaptation to the user interface considered in order to improve it.
3
Important Dimensions in Remote Evaluation of Mobile Applications
In remote evaluation based on logging tools of mobile applications we can identify three main aspects to address: • what can be logged, • how the information gathered can be processed, • how the usability data can be represented for the analysis by evaluators and designers. In this section we discuss these aspects, in particular when the evaluation focuses on Web applications accessed through mobile devices. In this case we have to consider that the context of use can be dynamic, the interaction resources (e.g. screen size) can vary in a broader range, and such devices are usually equipped with a number of sensors (GPS, accelerometer, gyroscope, ..) that can provide additional useful information about the actual user behaviour. Indeed, a logging tool for mobile applications should be able to detect any standard, touch, gestures, and accelerometer events. It should also consider form-related events (e.g., change, select, and submit), system related events, and customizable events. Such custom events are various types of composition of basic events in terms of their ordering or standard events on specific parameters (e.g. a pageview event is triggered when a specific page is shown to the user), and it should be possible to associate them with specific events names that can then be visualized in the reports. Regarding how to support an automatic analysis of the user-generated logs various solutions are possible. In this type of processing a concrete reference point in terms of good user behaviour during the interactive session would be useful. Previous work has considered task models to represent the expected user behaviour. However, task models require some time and effort to be developed, in particular if the entire interactive application considered should be modelled. Another possibility is to use logs representing examples of good sequences of events to perform some given tasks with the user interface considered. Such logs can be created by the designers of the user interfaces. Thus, by comparing the logs representing the actual behaviour with the optimal logs it is possible to automatically identify their differences and analyse them to understand whether they are indicators of usability problems. Such differences can show user errors, which are actions not necessary for achieving the current goals or inability of the user to perform some actions or the misinterpretation
244
P. Burzacca and F. Paternò
of the correct navigation path. An automatic comparison between these two sequences of events can be performed in various ways, an example is the application of the Sequence Alignment Method (SAM) [10], in which the difference between sequences is given by the number of operations necessary to make them the same, where each operation has a different weight, which depends on the importance associated to it. The operations necessary to equalize two sequences are reordering, insertion, deletion. While the first involves elements that belong to both sequences, the other two address elements that appear only in one sequence. Regarding the issues related to how to represent the relevant information in order to facilitate the identification of usability problems various options are possible as well. It is clear that a raw visualization of all the events gathered would easily generate a huge amount of events that cannot be analysed. The first aspect to consider is to provide the evaluators with tools to filter the data according to the type of event. Further filtering can be done based on the time when the events occurred. Even with this type of filtering it is still possible to gather large amount of data difficult to interpret. In order to better analyse the logged events it is thus important to understand what the user intentions were when such logs were generated. For this reason various tools ask the user to explicitly indicate what task they wanted to accomplish and even when they finished its performance. This information is usually included in the logged session and provides useful context in order to filter the events shown, to help in the interpretation, and also to provide information about task completion time. In the case there is the possibility to compare the actual logs with an optimal log then it would be important to show all of them at the same time with the possibility of lining up the sequences in such a way that important events appear lined up. Often graphical representations of the sequences of events that occurred, along with information regarding the event type, time, etc. still requires considerable effort from the evaluators who have to think about where the events occurred in the user interface. Thus, it is also important that the tools be able to provide graphically the user interface annotated with where the events occurred so that the evaluators have an immediate representation of the actual user interface state at that time, and the exact user interface part that was manipulated.
4
WUP: An Example Tool for Remote Evaluation of Mobile Web Applications
WUP is a tool that has been developed taking into account the requirements discussed in the previous section. Its new version addresses some of the limitations detected in its initial implementation [6] related to the visual representations provided for the usability analysis and the underlying processing of the data gathered. WUP exploits a proxy server, which inserts into the accessed Web pages some JavaScripts, which are then used to log the user interactions and send such logs to the usability server. Various types of events can be detected, those related to forms, keyboards, mouse, touch, GPS, accelerometer, and semantic events. The latter group (semantic events) refers to the possibility of explicitly indicating when a certain event
Reemote Usability Evaluation of Mobile Web Applications
245
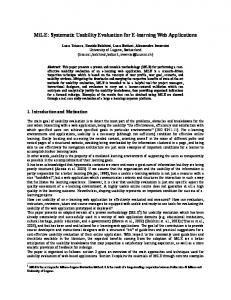
occurs on a specific elemen nt. These events can also be associated with pre- and poostconditions in order to betterr characterise them. Thus, for example, it is possible to use them to indicate when a fo orm is submitted after all the mandatory fields have bbeen filled in. Thus, the event is associated with clicking the button associated with sendding the form data, and has precconditions indicating that that each of the mandatory innput field has been filled in. Th his allows the tool to explicitly indicate whether and when this specific event occurs in n the logs visual representations. When evaluators wantt to start a remote usability study regarding a W Web application, they have to in ndicate the list of tasks that will be proposed to the ussers through a dedicated panel, which is also used to indicate when the task performaance starts and finishes. They caan also indicate any custom events that they are interessted in and which task they relaate to. Moreover, evaluators can provide the environm ment with an example optimal lo og for each task, which they can create by performing w what they consider the optimal seequence of actions associated with that task. In order to support the usability analysis, various representations are provided. O One is the timeline comparator (see Figure 1). It shows first the timeline associated w with the optimal log, at the top, and then those corresponding to the logs generated by the various users. For each tim meline the tool provides an identifier, the time when the log was created and the duratio on of the session, and the environment in which the log w was created in terms of device, browser, b and operating system. It is possible to manipu ulate the list of timelines in various ways. Each cann be selected, moved through drrag-and-drop in order to close those that evaluators wannt to compare without having to be constrained by the original order, or hidden if it is not useful for the current analy ysis. Moreover, the timelines that are more meaningful can be added to a favourite grroup that can be directly accessed on demand. It is aalso possible to filter the types of o events that are shown.
Fig. 1. Examples of Timelines Visualization
246
P. Burzacca and F. Paternò
The events that appear in the timelines are identified by a label and a colouured bullet. Each event type is associated a with a specific colour. For each event there are some pieces of associatted information: occurrence time, the correspondding application element, and other specific information that depends on the event tyype. All such details appear in a text area in the bottom part of the tool user interface w when the cursor hovers over the corresponding c label. It is also possible to search for speccific events or event types. The results of the search show only the events satisfying the query parameters. It is also o possible to display in the timelines vertical bars indicatting when there has been a pagee change in the navigation. The tool also allows com mparisons at the page level instead of the event level. Thhus, it is possible to show story yboards that for each session show one element for eeach page accessed (see an exaample in Figure 2) with arrows indicating the navigattion flow. For each page the visit v time is reported as well. The nodes representing the navigated pages are blue iff they are associated with Web pages that are not accesssed in the other sessions in the comparison. c
Fig. 2. Example of Comparison of Storyboards Representing Page Access
The new version of thee WUP tool also provides the possibility of showing the screen dumps of the user in nterfaces accessed by the user with indications of where the events occurred highlighted d by small red icons. Regarding intelligent an nalysis of the data collected the tool also provides an original implementation of the SAM method. It analyses the sequences of events and the SAM coefficients ind dicating how much they are diverse are calculated by considering three types of operations that can be applied in order to make them the same: reordering, applied when w there are elements in both the sequences but not in the same position, insert, when n there is an element in the optimal sequence but not in the analysed one, deleting, in the opposite case where the element is in the analyysed sequence but not in the op ptimal one. The number of occurrences of each of such operation is multiplied for a different coefficient in order to have different weightss on the overall SAM coefficien nt. In addition, in WUP such coefficients are calculatedd by analysing both the sequencces of events and the sequences of pages accessed, w with
Remote Usability Evaluation of Mobile Web Applications
247
different weights. The choice of the coefficient is customizable by the evaluator in order to indicate the aspects that they think have more or less impact in the comparison analysis. In the end, the tool calculates some values that for each user sessions provide some summary quantitative indication about how far they are from the optimal session. We have conducted a first user test about the tool and its results. In this first test we considered two types of users: end users who carried out the remote usability test with WUP and people with some experience in usability evaluation. We considered a set of tasks to carry out on the mobile version of the Web site of an airline for this purpose. Then, we compared the usability issues identified by the evaluators though the WUP support with those really reported afterwards by the users through some questionnaires. In general, there was a good match of the problems identified that were often related to the use of link texts not sufficiently clear, excessive navigation depth, ambiguous labels associated with some commands, and forms not very clear. A further integration that we have designed is an App for Android mobile devices, obtained through an instance of a WebView object, which is a kind of Web browser in a Java application. Then, through this browser it is possible to include the scripts for logging in the accessed Web pages. The scripts then send the logs in the format that can be exploited by our usability server for providing all the relevant visualizations to the evaluators. The advantage of this additional solution is that it does not require access through the proxy server, thus it can be faster and more secure. The disadvantage is that it is specific to a mobile platform.
5
Conclusions and Future Work
This paper provides a discussion of the issues in remote evaluation of applications accessed through mobile devices and indicates possible solutions, also reporting on experiences with a tool that has been developed for this purpose, describing its architecture, possible use and briefly reporting on example applications. Future work will be dedicated to further increasing the underlying intelligent analysis in order to facilitate the identification of potential usability problems. We also plan to exploit the logging of some physiological sensors in order to combine the analysis of the user interactions with information about the user emotional state, and to apply the tool to a wider set of applications.
References 1. Ivory, M.Y., Hearst, M.A.: The state of the art in automating usability evaluation of user interfaces. ACM Comput. Surv. 33(4), 470–516 (2001) 2. Hilbert, D.M., Redmiles, D.F.: Extracting usability information from user interface events. ACM Comput. Surv. 32(4), 384–421 (2000) 3. Google: Google Analytics, http://www.google.com/analytics/index.html
248
P. Burzacca and F. Paternò
4. Paganelli, L., Paternò, F.: Tools for Remote Usability Evaluation of Web Applications through Browser Logs and Task Models. Behavior Research Methods, Instruments, and Computers 35(3), 369–378 (2003) 5. Paternò, F., Russino, A., Santoro, C.: Remote Evaluation of Mobile Applications. In: Winckler, M., Johnson, H. (eds.) TAMODIA 2007. LNCS, vol. 4849, pp. 155–169. Springer, Heidelberg (2007) 6. Carta, T., Paternò, F., Santana, W.: Support for Remote Usability Evaluation of Web Mobile Applications. In: ACM SIGDOC, pp. 129–136. ACM Press, Pisa (2011) 7. Santana, V., Baranauskas, M.: Summarizing observational client-side data to reveal web usage patterns. In: SAC 2010: Proceedings ACM Symposium on Applied Computing, pp. 1219–1223. ACM Press (2010) 8. Waterson, S., Landay, J.A., Matthews, T.: In the lab and out in the wild: remote web usability testing for mobile devices. In: CHI Extended Abstracts 2002, pp. 796–797. ACM Press (2002) 9. Nebeling, M., Speicher, M., Norrie, M.C.: W3Touch: Metrics-based Web Content Adaptation for Touch. Proceedings CHI 2013, Paris (2013, to appear) 10. Hay, B., Wets, G., Vanhoof, K.: Mining Navigation Patterns Using a Sequence Alignment Method. Knowledge and Information Systems 6(2), 150–163 (2004)