2009 American Control Conference Hyatt Regency Riverfront, St. Louis, MO, USA June 10-12, 2009
ThB03.5
Load Frequency Control for Multiple-Area Power Systems1 Yao Zhang2, Lili Dong2, *, Member, IEEE, Zhiqiang Gao, Member, IEEE
Abstract—This paper presents the development and application of an Active Disturbance Rejection Controller (ADRC) to regulate the frequency error for a three-area interconnected power system. As the interconnected power system transmits the power from one area to another, the system frequency will inevitably deviate from a scheduled frequency, resulting in a frequency error. A control system is essential to correct the deviation in the presences of external disturbances and structural uncertainties to ensure a safe and smooth operation of the power system. ADRC can extract the information of the disturbance from input and output data of the system and actively compensate for the disturbance in real time. In addition, it has the advantages of simple structure, few tuning parameters, and robustness against parameter uncertainties over the traditional PID controllers used in current power industry. The effectives of the controller are validated by both simulation results and a frequency-domain analysis of the control system. Index Terms—load frequency error, active rejection based control, robustness, power system.
disturbance
I. INTRODUCTION
I
nterconnected electric power generation systems utilize tielines to transmit power from one area to another, either scheduled via a contract or in support during a system disturbance [1]. The “quality” of the power generating system is defined by three factors: constancy of frequency, constancy of voltage and level of reliability [2]. In actual power system operations, the load is changing continuously and randomly, resulting in deviations of the load frequency and the tie-line power between any two areas from scheduled generation quantities. Therefore, a Load Frequency Controller (LFC) is widely used to ensure a good quality of the power systems through regulating the deviations. The tie-line deviations from scheduled values are defined as Area Control Error (ACE). It is a summation of the tie-line power deviation ΔPtie and the frequency deviation Δf multiplied by a bias factor B [2]. The LFC is employed in each area of the interconnected power systems to drive the ACE to zero. A traditional LFC is performed by an Automatic Generation 1 The work was sponsored in part by the University Research Development Program of Cleveland State University under Grant 0210-0630-10 DONGL101. 2 The authors are with the Department of Electrical & Computer Engineering, Cleveland State University, Cleveland, OH 44115, USA. *Corresponding author. Email:
[email protected].
978-1-4244-4524-0/09/$25.00 ©2009 AACC
Control (AGC) through changing load reference inputs of governors of selected units in the control area, and then adjusting their outputs [1, 3-4] to track the reference inputs. However, the reference signal is generally varying with environmental variations that degrade the performance of the AGC greatly. In addition, multiple proportional and integral parameters of the AGC make it very difficult to tune in the real world. Decentralizing the power system using modern control method such as Linear Quadratic Gaussian (LQG) [5], state feedback [6] and H infinity [7] can possibly reduce the size of the inter-connected power system. But the structures of these controllers are too complicated to be implemented for industry practices. Recently, a process utilizing Linear Matrix Inequalities (LMI) [8] or Genetic Algorithms LMI (GALMI) [9] to tune the parameters of Proportional Integral Derivative (PID) controllers has been developed for the multiple-area power systems. Although the GALMI based PID controllers are simple and effective to some extent, they react passively to the disturbances in the power system, such as temperature and humidity change, machine wear and tear, and other unpredictable frictional forces. This paper aims to develop a practical Active Disturbance Rejection Control (ADRC) solution to solve the LFC problem. Compared to conventional PID controllers, ADRC is a technology that actively anticipates and fights disturbances before they affect system operation. The basic idea of ADRC is using an Extended State Observer (ESO) to estimate and cancel the generalized disturbance (all the input efforts excluding the control effort) of the system in order to simplify the control problem. The designed controller based on this concept is easy to tune [10], does not need an accurate model [10], is able to be decentralized [11] and has a notable robustness [12-13] against unexpected disturbances and structural uncertainties. The ADRC has been applied to many micro and mechanical systems [10-15]. It is the first time that we modified it and applied it to the LFC problem of a power system. A decentralized robust LFC controller based on the idea of the ADRC is introduced in the paper to reduce the ACE to zero. This paper is organized as follows. The dynamic model of the generation power system is explicated in section II. The design of LFC using the ADRC is introduced in section III. Simulation results of the control system are given in section IV. The performance analysis is in section V. Concluding remarks are made in the last section of this paper.
2773
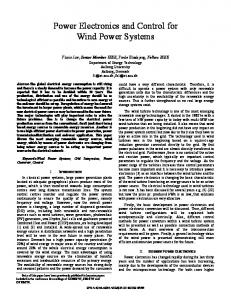
Fig. 1. Dynamic model of one-area power system
Num f ( s ) = −T ( H 2 H 3 R1 + H1 H 3 R2 + H1 H 2 R3 + H1 H 2 H 3 H s )
II. DYNAMIC MODEL OF THE MULTIPLE-AREA POWER SYSTEMS
+ TH1 H 2 H 3 ( Barea1 s + T ) s ,
We will design the LFC controller based on a three-area interconnected power system. A dynamic model of one-area power system is shown in Fig. 1. The model consists of three generation units, each of which is composed of three major parts: governor, turbine and generator. Governor catches load change error and outputs valve position (PV). The physical limitation of the valve position change is represented by a rate limiter in the figure. Turbine turns natural power into mechanical torque, which drives the generator to generate electric power. A common non-reheat turbine unit is employed in the paper. All generators in one area response coherently, so they are represented by an equivalent generator [2]. Droop characteristic is provided to change the speed setting of the governor so that several governors can operate in parallel. Tieline power deviation is proportional to the integral of the frequency difference between the two areas connected with the tie-line. The ACE output defined in previous section is equal to BΔf + ΔPtie as shown in the figure. For the conveniences of the controller design and the performance analysis, we focus on Laplace transform representation of the system in this section. Let y(t) denote the ACE output of the system, and u(t) the control input to the system. The Laplace transform of the system model is Y ( s ) = GP ( s )U ( s ) + GD ( s )ΔPl ( s ) + G f ( s )Δf D ( s ) , (1)
where GP ( s ) = NumP ( s ) Den( s ) ,
(2)
GD ( s ) = NumD ( s ) Den( s ) ,
(3)
G f ( s) = Num f ( s ) Den( s) ,
(4)
In (2), (3) and (4), NumP ( s ) = (α1 H 2 H 3 + α 2 H1 H 3 + α 3 H1 H 2 )( Barea1 s + T ) , (5) NumD ( s ) = (− H1 H 2 H 3 )( Barea1 s + T ) ,
(6)
2774
Den( s ) = H 2 H 3 s R1 + H1 H 3 s R2 + H1 H 2 s R3 + H1 H 2 H 3 H
,
(7) (8)
where T = T12 + T13 ; H1 = (Tg1 s + 1)(Tch1 s + 1) ;
H 2 = (Tg 2 s + 1)(Tch 2 s + 1) ; H 3 = (Tg 3 s + 1)(Tch 3 s + 1) ; H = M area1 s 2 + Darea1 s + T . where Δ deviation from nominal values; f area frequency; f D area interconnection signal; D load damping constant; (for one generation company); M inertia constant; (for one generation company); Tij tie-line synchronizing coefficient between area i & j;
Pl Ptie Pm Tch PV Tg
power load change; tie-line power flow; mechanical power; turbine time constant; governor valve position; governor time constant;
speed regulation characteristic; ramp rate factor; PC load reference setpoint; B composite frequency response characteristic; (for one generation company); Darea1 area load damping constant; M area1 area inertia constant; Barea1 area composite frequency response characteristic; R
α
3
L -1 ⎡⎣Gleft ( s)Y ( s) ⎤⎦ and external disturbances including the
;
Darea1 = ∑ Di i =1
terms of ΔPl and Δf D , and b=b0. Substituting the plant parameters into b, we have
3
M area1 = ∑ M i ; i =1
Barea1 = 1
3
∑ (1 R ) + D i =1
area1
i
3
.
b = ∑ αi i =1
In the next section, a LFC controller will be designed based on the system model given in (1-8). The design objective is to reduce the ACE to zero in the presences of disturbances and parameter variations.
Num f ( s) NumD ( s) Den( s) Y (s) = U ( s) + ΔPl ( s) + Δf D ( s) , (10) NumP ( s) NumP ( s) NumP ( s)
where NumP ( s ) and Den( s ) are fifth-order and eighth-order polynomials respectively. Conducting a polynomial long division on Den( s ) NumP ( s ) yields b0 s + b1 s + b2 s + b3 + Gleft ( s ) , 3
2
(11)
where b0, b1, b2, b3 are the coefficients of the quotient, and Gleft(s) is a remainder that is given by Gleft ( s ) = ( a0 s 4 + a1 s 3 + a2 s 2 + a3 s + a4 ) NumP ( s ) ,
(12)
Replacing the left side of (10) with (11) and (12) gives b0 s 3Y ( s ) = ( −b1 s 2 − b2 s − b3 − Gleft ( s ))Y ( s ) + +
∑
j =1, j ≠ i
Num f ( s ) Num p ( s )
NumD ( s ) ΔPl ( s ) Num p ( s )
ΠT i =1
gi
Tchi M area1 ,
(15)
x3 = && y , x4 = d , the state space equations of the model represented by (13) and (14) are: x& = Ax + Bu + Eh
(16)
y = Cx
where
C
⎡ x1 ⎤ ⎡0 ⎢x ⎥ ⎢0 x = ⎢ 2⎥ , A = ⎢ ⎢ x3 ⎥ ⎢0 ⎢ ⎥ ⎢ ⎣0 ⎣ x4 ⎦ = [1 0 0 0 ] .
1 0 0⎤ ⎡0⎤ ⎡0 ⎤ ⎢ ⎥ ⎥ ⎢0 ⎥ 0 1 0⎥ 0 , B = ⎢ ⎥ , E = ⎢ ⎥ , h = d& , ⎢b ⎥ ⎢0 ⎥ 0 0 1⎥ ⎢ ⎥ ⎥ ⎢ ⎥ 0 0 0⎦ ⎣0⎦ ⎣1 ⎦
From (16), a state space model of the system with the extended state can be written as: z& = Az + Bu + L( y − yˆ ) yˆ = Cz
(17)
where yˆ is the estimated y , z = [ z1 , z2 , z3 , z4 ] is the T
estimated state vector of x, L is the observer gain vector and T L = [ β1 , β 2 , β 3 , β 4 ] . For simplifying the tuning process, the parameters in L are chosen as ⎛ 4⎞ βi = ⎜ ⎟ ωOi , i = 1,L , 4 , ⎝i⎠
(18)
so as to make all the eigenvalues of the ESO equal to –ωO [15]. With accurate estimations of the ESO, z4 will track d closely, that is, z4 = dˆ ≈ d . For the LFC problem, the control goal is to reduce the ACE to zero. Therefore, the reference signal to the ACE output is chosen as r = 0 . Then the feedback control law based on the estimation results of the ESO is:
u = (u0 − z4 ) / b
(19)
(13) where u0 is a PDD controller and
ΔFD ( s ) + U ( s ),
Taking all the terms excluding U(s) on the right side of (13) as d(s), and transforming (13) from frequency domain to time domain produces &&& y = d + bu ,
Tg j Tch j Barea1
It is assumed that d is locally Lipschitz in the argument and bounded within the domain of interests. Let x1 = y , x2 = y& ,
CONTROLLER DESIGN
III.
In general, an nth order plant can be represented by (9): y ( n ) = d + bu (9) where y is the output of the system, u is the control signal, b is the controller gain. The generalized disturbance, denoted as d, includes all the input efforts of the system excluding the control effort [15]. If this generalized disturbance can be estimated and cancelled, the system will be simplified to an nth order-integral plant, which is easy to control. A practical way to estimate d in real time is to use the ESO. The idea of ESO is to treat the d as an extended state of a state space model of the system and to use an augmented Luenberger observer to estimate the state. In detail, the Laplace transform of the plant (1) can be rewritten as:
3
3
(14)
where d includes all the information of &y& , y& , y ,
u0 = k1 (r − z1 ) − k2 z2 − k3 z3 ,
(20)
where the difference between the reference signal r and the estimated ACE output z1 is defined as the tracking error e. In (20), the controller gains are selected as ⎛ 3 ⎞ 4 −i ki = ⎜ (21) ⎟ ωC , i = 1,L ,3 , ⎝4−i⎠
2775
In this way, the only tuning parameter of the controller is the controller bandwidth ωC and all the closed-loop poles are set to -ωC [15]. Replacing u in (14) with (19) will yield
&y&& = d + b((u0 − dˆ ) / b) ≈ u0 ,
(22)
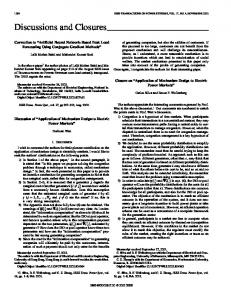
ACE and Δf than that of the GALMI tuned PI controller. However, the control effort of the ADRC shows an overshoot at the switching edge of the load change since it takes a short time for the ESO to approximate the disturbance. Nevertheless the overshoot magnitude of the ADRC is reasonable. So it will not affect the implementation of the controller in practice.
Then the original complicated system model is simplified as a triple integrator as shown in (22). Using the ADRC controller consisting of (19), (20), and (21), the tracking error e will be driven to zero.
Random Load Changes ΔPl1 (pu)
0.02
ΔPl2 (pu) ΔPl3 (pu)
The ADRC is implemented on the three-area power system in Fig.1 with the parameters listed in Appendix. In this section, the simulation results of the ADRC controller are compared with the results of the GALMI tuned PI controller in [9] when three different power load changes are applied to the three areas of the power system respectively. The load changes are functioning as external disturbances to the system. They are ideal to test the robustness of the two controllers against disturbances. The controller parameters for both the ADRC and the GALMI are listed in Table I and Table II.
50
100
150
200
250
0
50
100
150
200
250
0
50
100
150 Time (Sec.)
200
250
0 -0.01
Area2
0 -0.01
Area3
Area 2
ACE (pu)
0 -2 0
b 228 234 282
50
100
150
200
250
300 ADRC GALMI
50
100
150
200
250
300
50
100
150 Time (Sec.)
200
250
300
200
250
-3
2
x 10
0 -2 -3
2 ΔPe (pu)
Area 2 -6.96E-04 -0.3435
300
2
0
Area 1 -3.27E-04 -0.3334
300
0.01
-3
TABLE II: PI CONTROL PARAMETERS FROM GALMI DESIGN [9] Kp Ki
300
0.01
x 10
Δf (Hz)
Area 1 Area 2 Area 3
ωO 20 20 20
Area1 0
Fig.2. Random load changes for case one
TABLE I: ADRC PARAMETERS ωC 5 5 5
0 -0.01 0.02
IV. SIMULATION RESULT
Order of ESO 3 3 3
0.01
Area 3 -1.60E-04 -0.3398
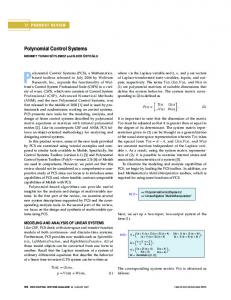
In case one, a random load change is added to each area of the power systems as shown in Fig.2, where ΔPl1 denotes the
0 -2
-3
Area 3
ACE (pu)
2 0 -2 0
for area 2, and ΔPl3 the random load change for area 3. Fig.3
50
100
150
-3
2 Δf (Hz)
shows the ACE, load frequency deviation Δf and the difference between control effort and load disturbance, which is ΔPe ( ΔPe = ΔPC − ΔPl ). In Fig.3, both the ADRC and the GALMI tuned PI controller compensate the load fluctuations rapidly, that is, the ΔPe s are driven to zeroes under the control
ΔPl3 = 50 MW respectively. The ACE, Δf and control effort for both controllers are shown in Fig. 4. The ADRC demonstrates smaller oscillations and faster responses in the
0 x 10
random load change for area 1, ΔPl2 the random load change
300 ADRC GALMI
x 10
0 -2 0
50
100
150
200
250
300
50
100
150 Time (Sec.)
200
250
300
-3
2 ΔPe (pu)
efforts. However, the ACE, Δf , and ΔPe of the ADRC controller have less magnitudes (the peak errors of the ACE and Δf for the ADRC are no more than 0.05%) than the GALMI tuned PI controller. In case two, a step load change with large amplitude is added to each area. The amplitudes of the load changes for the three areas are ΔPl1 = 100 MW , ΔPl2 = 80MW , and
x 10
x 10
0 -2
0
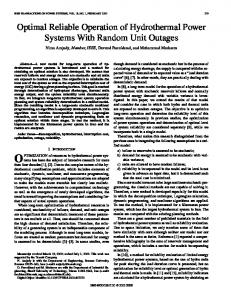
Fig. 3. System response for case 1 In case three, two large, step-input load changes are added to areas 2 and 3 with the magnitudes of ΔPl2 = 100MW and ΔPl3 = 50 MW , while the controllers of areas 2 and 3 are assumed to be out of services. This case is to test the reliability of the controlled system in tough situation. From the results shown in Fig. 5, we can see that the ACE and the Δf in areas
2776
2 and 3 can not converge to zeroes but only be bounded under this situation. Though the ACE and Δf are still driven to zeroes in area 1 under both the ADRC and the PI controller. Similarly, ADRC produces smaller oscillations and faster response in the results of the ACE and Δf than the PI controller. However, the control effort of the ADRC is a little bit bigger than the GALMI tuned PI controller.
Area 1 ACE (pu)
0.02 0 -0.02
Δf (Hz)
0 -0.02 -0.04 -0.06 -0.08
ΔPc (pu)
0.02 0 -0.02 -0.04 -0.06
ADRC GALMI
-0.1
Δf (Hz)
0
2
4
6
8
10
12
14
16
18
20
0
2
4
6
8
10
12
14
16
18
20
0
2
4
6
8
10
12
14
16
18
20
0
2
4
6
8
10 12 Time (Sec.)
14
16
18
20
0
Area 3
-0.05 -0.1
0
2
4
6
8
10
12
14
16
18
ACE (pu)
ACE (pu)
Area 1 0 -0.05
ADRC GALMI
-0.04
20
0 -0.02 -0.04 -0.06
ADRC GALMI
0.2 0
2
4
6
8
10
12
14
16
18
20
2
4
6
8
10 12 Time (Sec.) Area 2
14
16
18
20
2
4
6
8
10
12
14
16
18
20
2
4
6
8
10 12 Time (Sec.)
14
16
18
20
0 -0.02 -0.04 -0.06 0 -3
1
0 -0.05
ΔPc (pu)
ACE (pu)
0
ADRC GALMI
-0.1 0
Δf (Hz)
Δf (Hz)
ΔPc (pu)
0 0.4
2
4
6
8
10
12
14
16
18
20
x 10
0 -1
0
Fig. 5. System response for case 3
0 -0.05
ΔPc (pu)
-0.1
0
2
4
6
8
10
12
14
16
18
Replacing the Z ( s ) in (24) with (25) gives
20
U ( s ) = GPF ( s )GEC ( s ) R ( s ) − GEC ( s )Y ( s ) ,
0.4 0.2 0 0
2
4
6
8
10 12 Time (Sec.)
14
16
18
where GEC ( s ) is represented by
20
−1
GEC ( s ) = K [T ( s) ] L b ,
Fig. 4. System response for case 2
(27)
and GPF ( s ) is a pre-filter represented by
V. STABILITY ANALYSIS In this section, the stability analysis of the closed-loop power control system in one area is presented. The transfer function between load reference signal and ACE has been given by (2). The Laplace transform of the ESO in (17) is sZ ( s ) = ( A − LC ) Z ( s ) + BU ( s ) + LY ( s )
(26)
(
) (bK [T (s)] L) .
−1 GPF ( s ) = ⎡k1 b − K [T ( s ) ] B ⎤ ⎣ ⎦
−1
(28)
The closed-loop control system for the one-area power system is constructed in Fig. 6.
(23)
The Laplace transform of the PDD controller in (20) is U ( s ) = k1 R ( s ) b − KZ ( s ) b ,
(24) Fig. 6. Block diagram of the closed-loop control system
where K = [k1 k2 k3 1] .
The transfer function of the open-loop system is:
Substituting the U ( s ) in (23) with (24) yields Z ( s) = [T ( s)]
−1
[ Bk1 R(s) b + LY (s)] ,
where T ( s ) = sI − A + LC + BK b .
GO ( s ) = GEC ( s )GP ( s ) (25)
(29)
The frequency responses of the open-loop transfer function GO ( s ) with varying area inertial constants ( M area1 ) are shown in Fig. 7 and the corresponding stability margins are listed in
2777
Table III. In Fig.7 and Table III, the inertia constant is changing from 0.5M to 2M while the controller gains and observer gains are remained unchanged. Such a big change of the inertia constant seldom happens in power systems and can be taken as an extreme condition. However, the ADRC can still stabilize the power system with positive stability gains. This demonstrates not only the stability of the control system but also the strong robustness of the ADRC against parameter uncertainties.
α=
Bode Diagram
Marea1=0.4867
50
TABLE IV GENERATING UNIT PARAMETERS Parameters Generation Companies MVA base 1 2 3 4 5 6 7 8 9 (1000MW) D (pu/Hz) 0.01500.01400.0150 0.0160 0.0140 0.01400.01500.01600.0150 M (pu.sec) 0.16670.12000.2000 0.2017 0.1500 0.19600.12470.16670.1870 Tch (sec) 0.4 0.36 0.42 0.44 0.32 0.40 0.30 0.40 0.41 Tg (sec) 0.08 0.06 0.07 0.06 0.06 0.08 0.07 0.07 0.08
α
Ramp rate (MW/min)
[1] [2] [3]
[5]
-50
-100
[6]
-150 90
Phase (deg)
0
[7]
-90 -180 -270
[8]
-360 -1
0
10
1
10
2
10
3
10
10
Frequency (rad/sec)
Fig. 7. Frequency response of
GO ( s )
with different
[9]
M area1
[10]
TABLE III STABILITY MARGINS WITH DIFFERENT M area1
[11] Gain Margin (dB)
Phase Margin (dB)
11.2
77.4
0.2434
5.14
53.8
′ 1 = 2 M area1 = 0.9734 M area
17.3
40.2
M area1 = 0.4867 ′′ 1 = M area1 M area
2=
[12] [13]
APPENDIX The parameter values of the power system from [9] are given as follows. The ramp rate factor
3.00 3.00 3.30 2.7273 2.6667 2.50 2.8235 3.00 2.9412 0.34830.34730.3180 0.3827 0.3890 0.41400.36920.34930.3550 0.4 0.4 0.2 0.6 0 0.4 0 0.5 0.5 8
8
4
12
0
8
0
10
10
REFERENCES
Marea1=0.9734
0 Magnitude (dB)
R (Hz/pu) B (pu/Hz)
[4]
Marea1=0.2134
in which the regulation requirement
for each area is 100MW, and the Ramp rate is given in the Table IV. The tie-line synchronizing coefficients between any two areas are T12 = 0.2pu./ rad , T23 = 0.12 pu./ rad , and T31 = 0.25 pu./ rad . The other parameters of the power plant are given in Table IV.
VI. CONCLUSION REMARKS This paper presents the development and application of the ADRC to a complicated three-area interconnected power system. Such a system has zeros in its transfer function, making the controller design different from other systems in [10-15]. For the first time, the generalized disturbance of the ADRC is extended to include the derivatives of the control input in the system model. Our simulation results successfully demonstrate that the ADRC not only compensates the external load changes, but also regulates both the ACE and frequency deviations in the three areas. In addition, the ADRC is shown to be superior to the existing GALMI tuned PI controller in smaller ACE and Δf and faster responses of the closed-loop system. The frequency-domain analysis further validates the strong robustness of the controller against parameter variations and external disturbances.
Ramp rate × 5 min , regulation requirement
[14] [15]
2778
A. G. Morinec and F. E. Villaseca, “Continuous-Mode Automatic Generation Control of a Three-Area Power System,” in Proc. of the 33rd North American Control Symposium, pp. 63-70, 2001. P. Kundur, Power System Stability and Control (Book style). New York: McGraw-Hill, pp. 581-621, 1994. N. Jaleeli, L. VanSlyck, D. Ewart, L. Fink, and A. Hoffmann, “Understanding Automatic Generation Control,” IEEE Trans. Power Syst., vol. 7, NO. 3, pp. 1106-1122, Aug. 1992. V. Donde, M. A. Pai, and I. A. Hiskens, “Simulation and Optimization in an AGC System After Deregulation,” IEEE Trans. Power Syst., vol. 16, pp. 481–489, Aug. 2001. X. B. Chen, and S. Stankovic, “Overlapping Decomposition and Decentralized LQG Control for Interconnected Power Systems,” Proc. IEEE Int. Conf. Syst., Man, Cybern., vol. 3, pp. 1904-1909, Oct. 1996. K. Y. Lim, Y. Wang, G. Gua, and R. Zhou, “A New Decentralized Robust Controller Design for Multi-Area Load-Frequency Control via in Complete State Feedback,” Optimal Control Applications & Methods, vol. 19, pp. 345-361, 1998. M. H. Rahi and A. Feliachi, “ H ∞ Robust Decentralized Controller for Nonlinear Power Systems,” in Proc. of 30th Southeastern Symposium of Syst. Theory, Mar. 1998, pp. 268–270. X. Yu and K. Tomsovic, “Application of Linear Matrix Inequalities for Load Frequency Control with Communication Delays,” IEEE Trans. on Power Syst., vol. 19, NO. 3, Aug. 2004. D. Rerkpreedapong, A. Hasanovic, and A. Feliachi, “Robust Load Frequency Control Using Genetic Algorithms and Linear Matrix Inequalities,” IEEE Trans. on Power Syst., vol. 18, NO. 2, May 2003. Z. Gao, Y. Huang, and J. Han, “An Alternative Paradigm for Control System Design,” in Proc.s of IEEE conference on Decision and Control, vol. 5, NO. 4-7, pp. 4578-4585, Dec. 2001. Z. Gao, “Scaling and Parameterization Based Controller Tuning,” in Proc. of the 2003 American Control Conference, vol. 6, NO. 4-6, pp. 4989-4996, June 2003. W. Zhou and Z. Gao, “An Active Disturbance Rejection Approach to Tension and Velocity Regulations in Web Processing Lines,” IEEE Trans. on Power Syst., vol. 19, NO. 3, Aug. 2004. G. Tian and Z. Gao, “Frequency Response Analysis of Active Disturbance Rejection Based Control System,” in Proc. of 16th IEEE Int. Conf. on Ctrl. Apps. Part of IEEE Multi-conf. on Syst. and Ctrl., Singapore, 1–3, Oct. 2007. L. Dong, D. Avanesian, “Drive-Mode Control for Vibrational MEMS Gyroscopes,” to appear in IEEE Trans. on Industrial Electronics. Z. Gao, “Active Disturbance Rejection Control: A Paradigm Shift in Feedback Control System Design,” in Proc. of American Control Conference, Minneapolis, MN, June 2006.