APPLIED PHYSICS LETTERS 96, 174103 共2010兲
Low-frequency ac electro-flow-focusing microfluidic emulsification Peng He,1 Haejune Kim,1 Dawei Luo,1 Manuel Marquez,2 and Zhengdong Cheng1,a兲 1
Department of Chemical Engineering, Texas A&M University, College Station, Texas 77843, USA YNano LLC, 14148 Riverdowns South Dr., Midlothian, Virginia 23113-2327, USA
2
共Received 9 December 2009; accepted 11 April 2010; published online 29 April 2010兲 Applications of electric field, using either dc or high-frequency ac field, have shown many advantages in emulsification. We further develop this technique by a detailed study on low-frequency ac electro-flow-focusing 共EFF兲 microfluidic emulsification. Counter-intuitively, the droplet size variation is not monotonic with the electric field, in contrary to the dc-EFF emulsification. This phenomenon originates from a relaxation oscillation of flow rate through the Taylor cone. Particularly, a continuous droplet size decrease was obtained at the voltage ramp-up stage. This emulsification process was modeled in analog to the accumulation and release of charges in an RC electric circuit with an adjustable resistor. © 2010 American Institute of Physics. 关doi:10.1063/1.3424791兴 Formation of droplets inside microchannels is an important component of microfluidics in various applications.1–3 Flow focusing 共FF兲 is a widely adopted method for monodisperse droplet generation in microfluidics, pioneered by Gañán-Calvo et al.4 and Anna et al.5 It would be significantly beneficial if the droplet size could be tailored in a single device, especially for a liquid-liquid system of FF. Early experiments in drop-wise microfluidics simply varied flow rates or pressure for this purpose. Integrating electric fields into microfluidics has a great potential to rapidly control the droplet formation such as breaking, coalescence, and sorting.6–12 Electrospray 共ES兲 is an electrohydrodynamic technique extensively used for mass spectrometry13 and aerosol research.14 ES and FF share many common advantages like robustness, simple set-up, large yield, as well as similar physical mechanisms such as jet formation and droplet pinch-off from a conic meniscus. Basaran et al.6 reported experiments and simulations on the electrohydrodynamic tip streaming. Gañán-Calvo et al. experimentally and theoretically explored the combination of ES and FF for aerosol production using a dc electric field.7,8 Chang et al. studied the cone stability and the morphology change in ES under a high frequency ac electric field.9,10 Mugele et al. integrated electrowetting into FF to study drop generation using an ac electric field.11 So far, the majority of studies on an embedded ac electric field with FF used very high frequencies,9–11 and a low-frequency ac electric field is not well exploited in microfluidic emulsification. Here, we demonstrate the combination of a low-frequency ac electric field with FF for emulsification. We observe a continuous decrease in droplet size upon the voltage increase, and analyze the relaxation oscillation phenomenon of the jet flow rate out of the Taylor cone. An RC electric circuit model is established to explain the mechanism of this relaxation oscillation. The water-in-oil emulsions were produced in an FF device under an ac electric field of triangular waveform 共Fig. 1兲, in a setup similar to our previous experiment.12 We fabricated the polydimethylsiloxane 共PDMS兲 device using soft a兲
Author to whom correspondence should be addressed. Electronic mail:
[email protected].
0003-6951/2010/96共17兲/174103/3/$30.00
lithography.15 The source and ground electrodes were inserted into the PDMS in contact with the fluid to generate the electric field. Distilled water was used as the dispersed phase 共conductivity KW ⬃ 0.4 mS/ m兲. Mineral oil 共viscosity ⬇ 30 cP兲 with surfactant Span 80 共6 wt %兲 was used as the continuous phase 共interfacial tension ⬇ 3 mN/ m兲. Both water and oil were driven by syringe pumps 共PHD2000, Harvard Apparatus, Holliston, MA兲. Various flow rate settings were tested and they all showed the similar oscillation behavior. The results shown here are from flow rates QW = 35 l / h for water and QO = 350 l / h for oil. A high speed camera 共Phantom V 4.2, Vision Research, Wayne, NJ兲 was used to record videos of the emulsification process. The water flow rate out of the Taylor cone, Q j, is calculated using IDL® 共ITTVIS, Boulder CO兲 by averaging the ratio 共droplet volume兲/共production time兲 over three neighboring droplets for each data point, where the error bar includes both measurement error and error from averaging 关Fig. 3共a兲兴. The periodic variation in droplet size under the triangular ac electric field is shown in Figs. 2共a兲 and 2共b兲. Most interestingly, at the beginning of the voltage magnitude ramp-up stage, the droplet diameter D shows a continuous
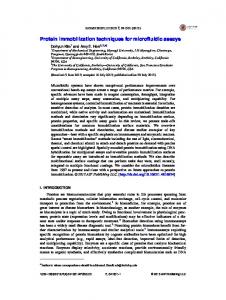
FIG. 1. 共Color online兲 Scheme of ac EFF microfluidic device 共top view兲. The distance between electrodes is 0.3645 cm. Triangular waveform of the ac electric field is shown in the lower-left corner. 共Inset兲 zoom-in of the crossing junction with the following dimensions: DW = 92.7 m, DO = 83.6 m, L = 46.3 m, W = 140 m, and the height of the channel is h ⬇ 50 m.
96, 174103-1
© 2010 American Institute of Physics
174103-2
He et al.
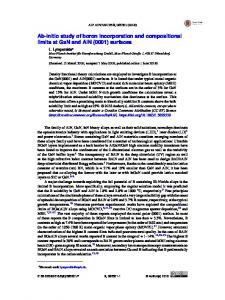
FIG. 2. 共Color online兲 Droplet series generated using an ac electric field of triangular waveform. QW = 35 l / h and QO = 350 l / h. 共a兲 Representative micrographs at various voltages. A-I: the first half period and J-R: the second half period. 共b兲 Droplet diameter D variation with the voltage U. Letters indicate the corresponding micrographs in 共a兲. Two dotted lines represents the comparable dc-EFF results at QW / QO = 40/ 350关共l / h / l / h兲兴 and 20/ 350关共l / h / l / h兲兴, respectively. 共c兲 The decrease in the droplet diameter with time. The line is the fitting to D ⬃ ␣t−1. 共d兲 The decrease in droplet diameter in the sequence generated at the voltage ramp-up stage, corresponding to B or K in 共a兲. The open diamond symbols: the fitting values by Eq. 共1兲.
decrease 关see Fig. 2共c兲; also A-C and J-L in Fig. 2共a兲兴. The maximum droplet size is obtained at zero voltage, consistent with the results in a dc electric field.12 The droplet diameter D shows a time dependence D ⬇ ␣ / t 关Fig. 2共c兲兴, where ␣ is a constant and t is the experimental time 共t = 0 at the voltage U = 0兲. The droplet production time was reported to be proportional to the jet diameter,16,17 n = Dn−1, where  is another constant and n labels the droplets in the sequence produced at the voltage ramp-up stage 共n = 1 at U = 0兲. Hence, a discrete sequential model is built to approximate the observed continuous decrease in droplet diameter as follows:
Dn =
␣ ␣ ␣ ⌫ = = = . tn tn−1 + n ␣/Dn−1 + Dn−1 ⌫/Dn−1 + Dn−1 共1兲
Substituting the initial and final diameters in the droplet sequence, the parameter ⌫ is obtained as ⌫ = ␣ /  ⬇ 1800, and the droplet size reduction is predicted in good agreement with experimental data 关Fig. 2共d兲兴. After the continuous reduction, we observed a group of droplets with roughly the same size 关Fig. 2共a兲, C–D and L–M兲, followed by a slight size increase until the peak voltage 共F and O兲. The droplet size maintains a steady increase during the voltage ramp-down stage 共F–I and O–R兲, similar to our previous dc experiment 关Fig. 2共b兲兴.12 Experimental observation 关Fig. 2共a兲兴 shows that the droplet formation process is only affected by the magnitude of the electric field, hence the direction of the electric field is not discussed further.
Appl. Phys. Lett. 96, 174103 共2010兲
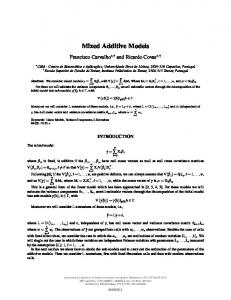
FIG. 3. 共Color online兲 The relaxation oscillation of flow rate out of the Taylor cone in the low-frequency-ac-regulated emulsification. 共a兲 The flow rate variation with time. Dotted straight line: the value of constant water influx. Dotted curve: the modeling results of IR. 共b兲 The flow rate decrease in the voltage ramp-up region. The line shows the fitting by the scaling Q j ⬃ t−2. 共c兲 The variation in the equivalent flow resistance RE,C with time. Solid lines are from the following fittings: RIE,C = 共28.97⫾ 3.44兲关et/共4.46⫾0.24兲 − 1兴 and RIIE,C = 共217.59⫾ 8.99兲e−共t−10兲/共9.27⫾0.53兲. 共d兲 The RC circuit model for low frequency ac regulated emulsification. Right inset: the volume variation in the Taylor cone as simulated by the charging and discharging of capacitor C.
In contrast to the dc-EFF experiments,12 the water flow rate Q j exhibits relaxation oscillation18–20 in response to the voltage U of the triangular ac electric waveform 关Fig. 3共a兲兴. Q j quickly declines at the beginning of the voltage ramp-up stage, followed by a slow increase back to its original value when U returns to zero. This relaxation oscillation phenomenon can be explained using analog to an RC electric circuit 关Fig. 3共d兲兴. Water influx QW is analogized to a constant current source Iin. An adjustable resistor RE,C represents the varying flow resistance of the jet issued from the Taylor cone. RE,C is controlled by both the electric field and the volume change in the cone. Q j is represented by the current IR passing through the resistor RE,C. When U starts to ramp up, the increasing electrical field promptly closes up the passage of the water stream; hence, the jetting diameter gets smaller and smaller. As a result, water accumulates in the Taylor cone, which is similar to the charging up of a capacitor C. When RE,C becomes quite high at certain high voltages, the jet issued from the Taylor cone becomes so thin that the accumulated water in the Taylor cone cannot be held steady. Parallely in the analogy, the capacitor C discharges. Thus in the experiment, the Taylor cone begins to release the accumulated water to the jet. RE,C begins to drop due to the increase in the jet diameter, and Q j switches from falling to rising. After the ac electric field passes the peak value and begins to decrease, RE,C keeps decreasing, evidenced by the increasing jet diameter or droplet size in Fig. 2共a兲 共F-I and O-R兲. Thus, the output flow rate increases due to the volume shrinkage of the Taylor cone. A resistor RH represents the hydrodynamic resistance from the water input channel into the Taylor cone, which is quite small and does not affect the jet issued from the Taylor cone. We treat it as a constant. The RC circuit model is verified in a simulator using Simulink 共Mathworks, Natick, MA兲 with respect to the experiment results. A current source Iin = 35 mA represents the
174103-3
Appl. Phys. Lett. 96, 174103 共2010兲
He et al.
water influx Qw = 35 l / h. RE,C is calculated by Poiseuille’s law as RE,C ⬇ l / D4 ⍀ 关Fig. 3共c兲兴, where the jet length l and diameter D are measured experimentally, and a proportional factor ⬃ 3144 is introduced for the current unit conversion from microliter per hour to milliampere 关see Figs. 3共a兲 and 3共b兲兴. The resistor RH ⬃ 0.994 ⍀ is determined similarly to RE,C but using the hydraulic diameter of the rectangular input channel. Feeding these values to the RC circuit simulator, we reproduce the relaxation oscillation of IR 共in microampere兲 in agreement with the experimental measurement of Q j 共in l / h兲, with an empirical parameter C ⬃ 540 F determined by trial and error 关Fig. 3共a兲兴. We find that as C increases, the current takes longer time to reach the stable oscillation, and as C decreases, the current variation deviates from the experimental oscillation. Furthermore, the average of Q j is equal to that of the constant influx 共35 l / h兲, which confirms the mass conservation. The overall flow rate in our ac experiments is merely an integral constant for each period. The relaxation oscillation is controlled by the voltage ramping, regardless of the averaged influx flow rate. This nonlinear “RC circuit” characteristic is unique to the low-frequency ac electric regulation of microfluidic emulsification, leading to a closed loop in the size-voltage plot 关Fig. 2共b兲兴. In comparison, the dc electric regulation only demonstrates monotonic voltage dependence 关see the dashed lines in Fig. 2共b兲 from our previous dc experiments,12 in which the flow rates were close to those of our ac experiment兴. The water flow rate 共35 l / h兲 was chosen to be low enough to avoid jetting at high voltage.12 The oil flow rate was chosen to offer sufficiently strong shear force to emulsify the water stream, in the meantime to avoid jetting. We found that the droplet size variation is mainly controlled by the strength of the electric field. Therefore, the relaxation oscillation phenomena will be better demonstrated using a linear ramping of the electric field as in the triangular waveform 共Fig. 1兲, instead of the sinusoidal waveform. From the scaling law analysis of droplet size in ES,21 we have R ⬃ 共Q3j 0 / K兲1/6, where the density , permittivity 0, and conductivity K are all constants. We measured drop size in the voltage ramp-up region, which indicates R ⬃ t−1 关Fig. 2共d兲兴, and the flow rate in the same region, which indicates Q j ⬃ t−2 关Fig. 3共b兲兴. Therefore, we obtain ⬃ t0, which means that the surfactant distribution is not affected by the electric field. Besides, the charge relaxation time is C = 0 / KW ⬃ 0.186 s, in which 0 is the vacuum permittivity and  ⬃ 80 is the dielectric constant of water. The period of the ac electric field is ac ⬃ 0.1 s. Since C Ⰶ ac, the free charge relaxation is so fast that the change in charge distribution by convection is negligible and the charge equilibrium is instantaneously established in the jet issuing and the droplet pinch-off processes. The transient effect of the ac electric
field on the viscosity and the surface tension of the fluids can be ignored. In summary, our results highlight the distinct response of the microfluidic droplet formation process to a lowfrequency ac electric field. The flow rate from the Taylor cone exhibits a relaxation oscillation even though the averaged flow rates are constant. This nonlinear phenomenon originates from the competing control of the diameter of the jet issued from the Taylor cone by the strength of the electric field and the volume of the Taylor cone. The relaxation oscillation of the flow rate is modeled using the analog of an RC electric circuit with an adjustable resistor. Using this ac microfluidic emulsification technique, we produced a continuously size-reducing droplet series by a simple triangular waveform. It would be promising to combine this rapid ac electric control with other lab-on-a-chip techniques on a microfluidic platform, such as using UV or chemicals to rapidly produce gel particles with variable sizes, and varying the quantities of reactive agents in the drop-based microreactors. This work was supported by start-up funds from Texas A&M University 共TAMU兲 and the Texas Engineering Experiment Station 共TEES兲. M.M. gratefully acknowledges partial funding for this work from the Fundacion SenecaAgencia de Ciencia y Tecnologia as part of the II PCTRM 2007-2010. 1
H. A. Stone, A. D. Stroock, and A. Ajdari, Annu. Rev. Fluid Mech. 36, 381 共2004兲. 2 D. J. Beebe, G. A. Mensing, and G. M. Walker, Annu. Rev. Biomed. Eng. 4, 261 共2002兲. 3 G. M. Whitesides, Nature 共London兲 442, 368 共2006兲. 4 A. M. Gañán-Calvo, Phys. Rev. Lett. 80, 285 共1998兲. 5 S. L. Anna, N. Bontoux, and H. A. Stone, Appl. Phys. Lett. 82, 364 共2003兲. 6 R. T. Collins, J. J. Jones, M. T. Harris, and O. A. Basaran, Nat. Phys. 4, 149 共2008兲. 7 A. M. Gañán-Calvo, Phys. Rev. Lett. 98, 134503 共2007兲. 8 A. M. Gañán-Calvo, J. M. Lopez-Herrera, and P. Riesco-Chueca, J. Fluid Mech. 566, 421 共2006兲. 9 D. Lastochkin and H.-C. Chang, J. Appl. Phys. 97, 123309 共2005兲. 10 L. Y. Yeo, D. Lastochkin, S. C. Wang, and H.-C. Chang, Phys. Rev. Lett. 92, 133902 共2004兲. 11 H. Gu, F. Malloggi, S. A. Vanapalli, and F. Mugele, Appl. Phys. Lett. 93, 183507 共2008兲. 12 H. Kim, D. Luo, D. Link, D. A. Weitz, M. Marquez, and Z. Cheng, Appl. Phys. Lett. 91, 133106 共2007兲. 13 J. B. Fenn, M. Mann, C. K. Meng, S. F. Wong, and C. M. Whitehouse, Science 246, 64 共1989兲. 14 M. Cloupeau and B. Prunetfoch, J. Aerosol Sci. 25, 1021 共1994兲. 15 Y. N. Xia and G. M. Whitesides, Annu. Rev. Mater. Sci. 28, 153 共1998兲. 16 W. W. Zhang, Phys. Rev. Lett. 93, 184502 共2004兲. 17 W. W. Zhang and J. Lister, Phys. Rev. Lett. 83, 1151 共1999兲. 18 Encyclopaedia of Mathematics, edited by M. Hazewinkel 共Kluwer, Dordrecht, 2002兲. 19 F. Li, X.-Y. Yin, and X.-Z. Yin, Phys. Rev. E 78, 036302 共2008兲. 20 D. A. Saville, Phys. Fluids 13, 2987 共1970兲. 21 A. M. Gañán-Calvo and J. Montanero, Phys. Rev. E 79, 066305 共2009兲.