European Review for Medical and Pharmacological Sciences
2010; 14: 203-207
Low glucose blood levels are associated with abnormal cardiac sympatho-vagal balance in type 2 diabetic patients with coronary artery disease F. INFUSINO, D. PITOCCO*, F. ZACCARDI*, G. SCAVONE, I. COVIELLO, R. NERLA, R. MOLLO, A. SESTITO, A. DI MONACO, L. BARONE, C. PISANELLO, G. GHIRLANDA*, G.A. LANZA, F. CREA Institute of Cardiology and *Institute of Medical Pathology and Diabetology, School of Medicine, Catholic University of the Sacred Heart, Rome (Italy)
Abstract. – Background and Objectives: Glycemic control has been suggested to improve prognosis in diabetic patients, but recent trials failed to show benefits from intensive glycemic control. Hypoglycaemic episodes or large variability in glucose blood levels causing a sympatho-vagal imbalance of cardiac autonomic function (CAF) might play a role in this result. In our study we assessed whether blood glucose fluctuation may be related to variations in CAF during daily life in diabetic patients with coronary artery disease (CAD). Materials and Methods: Twelve patients with type 2 diabetes mellitus with CAD (65±4 years, 2 women) underwent simultaneous 48-hour ECG Holter monitoring and continuous interstitial glucose measurements. The highest and lowest glucose levels for each 3-hour segments of the day were identified and heart rate variability (HRV) parameters were measured on Holter recordings on 5-minute intervals centred on these times. Results: Overall, 294 glucose levels were available for analysis. In the whole population several HRV indices were significantly lower in correspondence of the lowest glucose blood levels and this difference was much more evident in patients who were not taking beta-blockers, than in patients who were taking beta-blockers. A significant, although mild, correlation was found between glucose blood levels and several time-and frequency domain HRV variables in patients not taking beta-blockers, but not in these on beta-blockers therapy. Discussion: Our data suggest that, in type 2 diabetic patients with CAD, hypoglycaemic episodes are associated with depressed HRV and that betablocking agents are able to contrast this relation. These interesting results merit to be investigated in a larger population of patients. Key Words: Diabetes mellitus, Heart rate variability, Continuous glucose monitoring.
Background Diabetes is associated with an increased risk of morbidity and mortality, with cardiovascular disease accounting for up to two-thirds of all deaths in the diabetic population 1 . Hyperglycemia can influence long-term prognosis of these patients favouring the development and progression of microvascular and macrovascular complications 2-6. Thus an intensive glycemic control has been suggested to improve prognosis in patients with diabetes. However, recent trials failed to demonstrate a significant reduction in cardiovascular events with an intensive glycemic control7,8. These data might be related to an increased incidence of hypoglycaemic episodes or large variability in glucose blood levels. Previous studies reported that episodes of hypoglycemia may indeed impair cardiac autonomic function causing sympathetic activation and vagal withdrawal9,10, which, in patients with coronary artery disease (CAD), may trigger or favour ischemic or arrhythmic events11-13. In this study we assessed whether continuous blood glucose fluctuation may be related to variations in cardiac autonomic function during daily life in diabetic patients with evidence of CAD.
Methods Population We enrolled 12 consecutive patients (mean age 65±4 years, 2 women) affected by type 2 diabetes mellitus and a well-known history of obstructive CAD for at least 2 years, always documented by coronary angiography. The main clini-
Corresponding Author: Gaetano A. Lanza, MD; e-mail:
[email protected]
203
F. Infusino, D. Pitocco, F. Zaccardi, G. Scavone, I. Coviello, R. Nerla, et al.
cal characteristics of patients are summarized in Table I. Study Protocol Patients underwent simultaneous 48-hour ECG Holter monitoring and continuous interstitial glucose measurements. ECG Holter monitoring (HM) was performed by 3-channel digital recorders (Oxford Medilog FD5). HM recordings were analyzed by two expert cardiologists at a core laboratory, using the Oxford Medilog Excel 3.0 device. Cardiac autonomic function was assessed by HRV parameters in the time and frequency domain. Time-domain HRV variables included: standard deviation of all RR intervals (SDNN); rootmean squared successive difference of RR intervals (r-MSSD). Frequency-domain variables, obtained by a fast Fourier transform spectral analysis algorithm, included the amplitude of RR changes in the very-low frequency (VLF, 0.0033-0.04 Hz), low frequency (LF, 0.04-0.15 Hz), and high frequency (HF, 0.15-0.40 Hz). The LF/HF rates was also calculated. Continuous glucose monitoring (CGM) was performed by the MiniMed Continuous Glucose Monitoring System (CGMS Medtronic/MiniMed, Milan, Italy), which consists of four components: Table I. Main clinical characteristics of patients. Patients (n = 12) Age (yrs) Men/women Risk factors Family history of CAD Systemic hypertension Diabetes mellitus Hypercholesterolemia Smokers Body mass index History Myocardial infarction Coronary bypass surgery Coronary angioplasty HBA1c (%) LF Ejection fraction (%) Medications Diuretics ACE-inhibitors Calcium-channel blockers Beta-blockers Statins Aspirin
204
65 ± 4 10/2 5 (41%) 8 (66%) 12 (100%) 7 (58%) 4 (33%) 26.8 ± 1.7 4 (33%) 5 (41%) 3 (25%) 7.2 ± 1.0 57 ± 6 1 (8.0%) 4 (33%) 4 (33%) 7 (58%) 6 (50%) 12 (100%)
(1) a pagersized electronic monitor, with a small keyboard and LCD display, that records data from the sensor; (2) a sterile, disposable subcutaneous glucose sensor with an external electrical connector; (3) a cable that connects the sensor to the monitor; and (4) a communication station (Com-station) that enables data stored in the monitor to be downloaded to a personal computer. The sterile, disposable glucose sensor is placed subcutaneously in the abdomen and provides continuous measurement of glucose concentration in the interstitial fluid. The sensor is connected via external electrical cable to the pager-sized monitor, which records an average glucose value every 5 minutes. Once data have been downloaded from the monitor, the CGMS Com-station software can be used to analyze and display the data. The software produces a table of summary statistics; a 24-hour glucose plot for each day the sensor was worn, showing the sensor profile, along with the blood glucose meter values and event markers entered into the monitor by the patient; a modal day plot of all days superimposed on a single 24-hour scale and a complete database listing of the individual data points. The CGMS sensor, when inserted subcutaneously, converts interstitial glucose into an electrical current, measured in nanoamperes (nA). The interstitial glucose reacts at a glucose oxidase layer to produce H2O2 that diffuses to a platinum electrode poised at 0.535 V. The H2O2 is oxidized to produce the sensor current. In order to provide information about the patient’s blood glucose profile, these nanoampere current readings must be converted into glucose concentration, measured in milligrams per deciliter (mg/dL). The CGMS instructions recommend at least four self-monitoring of blood glucose (SMBG) measurements be entered into the continuous glucose monitor each day the CGMS is used. Analysis of Data The period of 48 hours was divided into 3 hour segments. The highest and the lowest glucose levels for each of the 3-hour segments and their exact time of occurrence were identified. Thus HRV parameters were measured on Holter recordings on 5-minute intervals centred on these times. Statistical Analysis Glycemic values were divided into 4 groups: from 40 to 80 mg/dl (group 1), from 81 to 140 mg/dl (group 2), from 141 to 200 mg/dl (group
Glucose blood level and cardiac autonomic function Table II. Differences of HRV variables in the 4 groups of glucose blood levels. Group 1 (40-80 mg/dl) SDNN rMSSD VLF LF HF LF/HF
Group 2 (81-140 mg/dl)
40 ± 21 16 ± 6 31 ±18 15 ±9 7±3 2 ± 0.9
Group 3 (141-200 mg/dl)
50 ± 31 26 ± 17 38 ± 28 20 ± 15 13 ± 8 2 ± 0,9
3) and over 200 mg/dl (group 4). HRV parameters were compared among the 4 glycemic groups using analysis of variance (ANOVA). Data were also separately analyzed according to whether patients were taking or not beta-blockers. Correlation analyses between glucose blood levels and HRV parameters were performed by Spearman test. Differences were considered statistically significant for P 200 mg/dl)
P
β-blockers (n=154) SDNN rMSSD VLF LF HF LF/HF
50 ± 17 18 ± 5 39 ± 15 20 ± 8 8±2 2 ± 0.8
55 ± 29 25 ± 14 42 ± 27 21 ± 12 12 ± 7 2 ± 0.9
51 ± 30 23 ± 12 39 ± 24 23 ± 14 12 ± 8 2 ± 0.9
60 ± 23 31 ± 14 44 ± 25 29 ± 13 15 ± 6 2±1
0.52 0.02 0.9 0.30 0.06 0.12
No β-blockers (n=140) SDNN rMSSD VLF LF HF LF/HF
19 ± 10 11 ± 5 14 ± 9 7±3 6±3 1 ± 0.6
44 ± 35 27± 22 32 ± 29 19 ± 19 11 ± 9 2 ± 0.8
49 ± 32 31± 29 34 ± 24 19 ± 13 15 ± 13 1 ± 0.7
50 ± 32 32 ± 25 36 ± 24 22 ± 15 16 ± 12 1 ± 0.5
0.07 0.01 0.10 0.02 0.03 0.3
205
F. Infusino, D. Pitocco, F. Zaccardi, G. Scavone, I. Coviello, R. Nerla, et al. Table IV. Correlations between glucose blood levels and HRV variables. r coefficient SDNN rMSSD VLF LF HF LF/HF
0.06 0.15 0.03 0.14 0.15 -0.08
Table V. Correlation between HRV parameters and glucose blood levels in patients who were taking or not beta-blockers. r coefficient
P
β-blockers (n = 154) SDNN rMSSD VLF LF HF LF/HF
-0.03 0.5 -0.04 0.11 0.08 0.027
0.7 0.05 0.6 0.17 0.3 0.74
No β-blockers (n = 140) SDNN rMMSD VLF LF HF LF/HF
0.22 0.23 0.20 0.24 0.23 -0.06
0.01 0.007 0.017 0.005 0.006 0.46
P 0.28 0.012 0.6 0.017 0.008 0.19
spontaneous glucose blood levels changes during daily life are associated with variations in cardiac autonomic function. Second, beta-blocker therapy is able to reduce the oscillations in cardiac autonomic function associated with glucose blood levels changes. Diabetes is associated with an increased risk of cardiovascular disease1, and hyperglycemia is believed to contribute significantly to the development and progression of vascular damage2-6. Thus an intensive glycemic control has been suggested to improve prognosis in these patients. Yet, recent trials failed to show any improvement in cardiovascular outcome with an intensive glycemic control in diabetic patients7-8. Although the reasons for this failure are likely complex and multiple, an increased occurrence of hypoglycaemic episodes and/or a large variability in glucose blood levels might play a role. Hypoglycemia, indeed, is known to trigger autonomic imbalance by causing sympathetic activation and vagal withdrawal9,10, a condition that, in patients with coronary artery disease (CAD) in particular, can predispose to ischemic or arrhythmic cardiac events11-13.
In agreement also with previous observations14,15, our data confirm this relation, by showing that, during daily life, several HRV parameters, both in the time and in the frequency domain, are more depressed in coincidence with the lowest glucose blood levels, which is typical of a sympatho-vagal imbalance with sympathetic predominance10,11,16,17. Accordingly, a general, although mild, correlation existed between glucose blood levels and several HRV variables in our patients. However, we also show in this study that betablocker therapy is able to prevent or limit this association, likely thanks to the anti-adrenergic effects of this kind of therapy, suggesting that this effect might contribute to the well-known benefits of beta-blocking agents on clinical outcome in CAD patients with diabetes18,19.
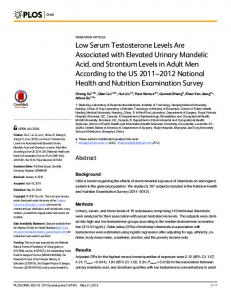
r = 0.23 p = 0.006
HF amplitude (ms)
HF amplitude (ms)
r = 0.08 p = 0.30
Glucose blood level (mg/dL)
Glucose blood level (mg/dL)
Figure 1. Correlation between glucose blood levels and high frequency (HF) amplitude in patients not taking (left) or taking (right) beta-blocker therapy.
206
Glucose blood level and cardiac autonomic function
In conclusion, our preliminary data show that, in diabetic patients with CAD, hypoglycaemic episodes are associated with depressed HRV and that beta-blocking agents contrast this relation. Our data deserve confirmation in larger groups of patients.
References 1) DIEDRICH L, SANDOVAL D, DAVIS SN. Hypoglycemia associated autonomic failure. Clin Auton Res 2002; 12: 358-365. 2) THE
EFFECT OF INTENSIVE TREATMENT OF DIABETES ON THE DEVELOPMENT AND PROGRESSION OF LONG-TERM COMPLICATIONS IN INSULIN-DEPENDENT DIABETES MELLITUS. The
Diabetes Control and Complications Trial (DCCT) Research Group. N Engl J Med 1993; 329: 977986. 3) I NTENSIVE
BLOOD - GLUCOSE CONTROL WITH SULPHONY LUREAS OR INSULIN COMPARED WITH CONVENTIONAL TREATMENT AND RISK OF COMPLICATIONS IN PATIENTS WITH TYPE 2 DIABETES (UKPDS 33). UK Prospective Diabetes
Study (UKPDS) Group. Lancet 1998; 352(9131): 837-853. 4) AMTHOR KF, DAHL-JORGENSEN K, BERG TJ, HEIER MS, SANDVIK L, AAGENAES O, HANSEN KF. The effect of 8 years of strict glycemic control on pheripheral nerve function in IDDM patients: the Oslo Study. Diabetologia 1994; 37: 579-584. 5) VINIK AI, ERBAS T. Recognizing and treating diabetic autonomic neuropathy. Clev Clin J Med 2001; 68: 928-944. 6) DUCKWORTH W, ABRAIRA C, MORITZ T FOR VADT INVESTIGATORS. Glucose control and vascular complications in veterans with type 2 diabetes. N Engl J Med 2009; 360: 129-139. 7) ACTION TO CONTROL CARDIOVASCULAR RISK IN DIABETES STUDY GROUP, GERSTEIN HC, MILLER ME, BYINGTON RP, G OFF DC Jr, B IGGER JT, B USE JB, C USHMAN WC, GENUTH S, ISMAIL-BEIGI F, GRIMM RH Jr, PROBSTFIELD JL, SIMONS-MORTON DG, FRIEDEWALD WT. Effects of intensive glucose lowering in type 2 diabetes. N Engl J Med 2008; 358: 2545-2559. 8) ADVANCE COLLABORATIVE GROUP, PATEL A, MACMAHON S, CHALMERS J, NEAL B, BILLOT L, WOODWARD M, MARRE M, COOPER M, GLASZIOU P, GROBBEE D, HAMET P, HARRAP S, HELLER S, LIU L, MANCIA G, MOGENSEN CE, PAN C, POULTER N, RODGERS A, WILLIAMS B, BOMPOINT S, DE GALAN BE, JOSHI R, TRAVERT F. Intensive blood glucose control and vascular outcomes in patients with type 2 diabetes. N Engl J Med 2008; 358: 2560-2572.
9) CRYER PE. Mechanisms of hypoglycemia-associated autonomic failure and its component syndromes in diabetes. Diabetes 2005; 54: 3592-3601. 10) ADLER GK, BONYHAY I, FAILING H, WARING E, DOTSON S, FREEMAN R. Antecedent hypoglycemia impairs autonomic cardiovascular function. Implications for rigorous glycemic control. Diabetes 2009; 58: 360-366. 11) K OCHIADAKIS GE, M ARKETOU ME, I GOUMENIDIS NE, SIMANTIRAKIS EN, PARTHENAKIS FI, MANIOS EG, VARDAS PE. Autonomic nervous system activity before and during episodes of myocardial ischemia in patients with stable coronary artery disease during daily life. Pacing Clin Electrophysiol 2000; 23: 2030-2039. 12) COPIE X, LAMAISON D, SALVADOR M, SADOUL N, DA COSTA A, FAUCHIER L, LEGAL F, LE HEUZEY JY; VALID INVESTIGATORS. Heart rate variability before ventricular arrhythmias in patients with coronary artery disease and an implantable cardioverter defibrillator. Ann Noninvasive Electrocardiol 2003; 8: 179-184. 13) LIAO D, CARNETHON M, EVANS GW, CASCIO WE, HEISS G. Lower heart rate variability is associated with the development of coronary heart disease in individuals with diabetes: the atherosclerosis risk in communities (ARIC) study. Diabetes 2002; 51: 3524-3531. 14) BURGER AJ, WEINRAUCH LA, D'ELIA JA, ARONSON D. Effect of glycemic control on heart rate variability in type I diabetic patients with cardiac autonomic neuropathy. Am J Cardiol 1999; 84: 687-691. 15) C HEN SR, L EE YJ, C HIU HW, J ENG C. Impact of glycemic control, disease duration, and exercise on heart rate variability in children with type I diabetes mellitus. J Formos Med Assoc 2007; 106: 935-942. 16) MALPAS SC, MALING TJB. Heart-rate variability and cardiac autonomic function in diabetes. Diabetes 1990; 39: 1177-1181. 17) B ELLAVERE F, B ALZANI I, D E M ASI G, C ARRARO M, CARENZA P, COBELLI C, THOMASETH K. Power spectral analysis of heart-rate variations improves assessment of diabetic cardiac autonomic neuropathy. Diabetes Care 1992; 41: 633-640. 18) H AAS SJ, V OS T, G ILBERT RE, K RUM H. Are betablockers as efficacious in patients with diabetes mellitus as in patients without diabetes mellitus who have chronic heart failure? A meta-analysis of large-scale clinical trials. Am Heart J 2003; 146: 848-853 19) DEEDWANIA PC, GILES TD, KLIBANER M, GHALI JK, HERLITZ J, HILDEBRANDT P, KJEKSHUS J, SPINAR J, VITOVEC J, STANBROOK H, WIKSTRAND J; MERIT-HF STUDY GROUP. Efficacy, safety and tolerability of metoprolol CR/XL in patients with diabetes and chronic heart failure: experiences from MERIT-HF. Am Heart J 2005; 149: 159-167.
207