The results demonstrate a dipolar-like magnetic signal, exponentially decreasing in time, above the cut- ting type of injury. After the burning stimulation, the.
Eur Biophys J (2000) 29: 515±522 DOI 10.1007/s002490000105
A RT I C L E
V. Jazbinsek á G. Thiel á W. MuÈller G. WuÈbbeler á Z. Trontelj
Magnetic detection of injury-induced ionic currents in bean plants
Received: 28 March 2000 / Revised version: 16 August 2000 / Accepted: 16 August 2000 / Published online: 21 October 2000 Ó Springer-Verlag 2000
Abstract A superconducting quantum interference device (SQUID) multichannel magnetometer was used to measure the temporal and spatial evolution of the magnetic ®eld accompanying stimulation by burning and/or cutting of Vicia faba plants. These magnetic ®elds are caused by ionic currents that appear after injury in dierent parts of the plant. All measured V. faba plants responded to the burning stimulation with detectable quasi-d.c. magnetic signals. In order to measure these signals, a suitable modulation had to be used. The covariance method was applied to analyse the measured data. The results demonstrate a dipolar-like magnetic signal, exponentially decreasing in time, above the cutting type of injury. After the burning stimulation, the magnetically detected activity was concentrated predominantly above the leaves/petioles and less above the stem. Possible mechanisms for this behaviour are suggested. A comparison with previously known electrical measurements of plant injury is given. Key words Plant injury/stimulation á Induced current/ magnetic ®eld á SQUID magnetometer á Injury-induced signal propagation á Post-injury distribution of electrical activity
V. Jazbinsek (&) á Z. Trontelj Physics Department IMFM, University of Ljubljana, 1000 Ljubljana, Slovenia E-mail: vojko@®z.uni-lj.si Tel.: +386-1-4766580 Fax: +386-1-2517281 G. Thiel P¯anzenphysiologisches Institut, UniversitaÈt GoÈttingen, GoÈttingen, Germany W. MuÈller á G. WuÈbbeler Physikalisch-Technische Bundesanstalt Berlin, Berlin, Germany G. WuÈbbeler Department of Neurology, Freie UniversitaÈt Berlin, Berlin, Germany
Introduction Local wounding by various kinds of mechanical damage in plants triggers the synthesis of proteins used in defence against insect predators (Bowles 1990). These proteins, which comprise protease inhibitors, are synthesized not only at the site of wounding but also in distant parts of the plant (Chessin and Zipf 1990; Ryan 1992). This prompts the view that at the site of wounding a signal is initiated which is rapidly propagated throughout the plant, with the consequence that, shortly after wounding, protein synthesis is induced even in parts of the plant distant from the site of wounding (Ryan 1992). The nature of the transmitted signal as well as the mechanism of propagation is still a matter of debate. Currently, three hypotheses are being discussed for long-distant signalling: (1) the transmission of a chemical compound in the vessels, (2) propagation of changes in electrical voltage or (3) trauma-evoked hydraulic pressure changes. With respect to chemically based transmission, low molecular weight compounds, including oligosaccharides, abscisic acid, methyl jasmonate and the 18-amino acid peptide systemin, have been identi®ed as potential compounds for long-distant signalling (Roberts 1992). Albeit the potential role of low molecular weight compounds in long-distant signalling is compelling (Roberts 1992), it is nonetheless questioned whether the passage of a chemical signal based entirely on diusion through vascular tissue is fast enough to account for the rapid induction of far-distant protein synthesis (Pearce et al. 1991). Studies using extracellular and intracellular electrodes have revealed that wounding of tissue in a variety of plants causes changes in the electrical membrane voltage (e.g. Roblin 1985; Roblin and Bonnemain 1985; Wildon et al. 1992; Thain and Wildon 1993; Rhodes et al. 1996; Herde et al. 1998). Typically, the electrical response consists of a rapid action potential-like depolarization followed by a slower long-lasting depolarization usually termed the variation potential. The
516
elementary basis of these transient voltage changes is as yet poorly understood. It has been speculated that the fast transient depolarization is an action potential and is therefore propagated ± just as in nerve cells ± as a true long-distance electrical signal (Herde et al. 1998). The slow voltage transient, on the other hand, might be the consequence of chemical signals which are distributed via the xylem (Pickard 1973). Wounding-induced voltage changes are transmitted from the site of wounding along the plant with a velocity of less than 1 cm/s (Roblin and Bonnemain 1985; Wildon et al. 1992) and reach remote tissue before the systemic molecular responses are initiated in this tissue (Stankovic and Davies 1998). We can add to these statements: the electrical potential dierence (voltage) in conducting living tissue is connected with ionic currents, which can also be detected magnetically as follows from Ampere's or BiotSavart's laws. As a pathway for propagation of the electrical signal, the low-resistance electrical continuum of the sieve-tube element/companion cell complex (Rhodes et al. 1996), or of the entire vein, including the apoplast, is suggested (Herde et al. 1998). It has been observed that injection of an electrical current into leaf tissue stimulates expression of pin2, a gene normally expressed in response to wounding (Herde et al. 1995). Also, the triggering of propagated action potential-like voltage changes evoked in distant tissue an increase in pin2 mRNA levels (Stankovic and Davies 1996). Work on wheat, tomato and sun¯owers (Malone 1992; Malone et al. 1994; Stankovic et al. 1997) has further shown that, upon wounding, hydraulic signals are also transmitted rapidly with a velocity of about 10 cm/s (Malone 1992) from the site of wounding throughout the plant. These mechanical signals, which might arise from a surge of pressure in the xylem, are by themselves not capable of inducing protein synthesis (Malone et al. 1994). Nonetheless, they appear to represent an essential requirement for ecient systemic transmission of woundinduced protein synthesis (Malone et al. 1994). The role of the hydraulic surge in long-distant signalling might be that it causes a mass ¯ow from the wounded sites through the xylem and thus accelerates the distribution of active chemical-based signals such as systemin (Malone et al. 1994). A tentative comparison of the speed of transmission of the electrical signal versus the hydraulic signal has shown that the latter precedes the former (Malone 1992; Stankovic et al. 1997). This lends support to the hypothesis that the hydraulic signal is the cause of the electrical signal through the activation of mechanosensitive transporters in the target tissue. This view has been supported by evidence that imposing pressure changes in the tissue can also generate the typical wound-induced electrical signals. To further elucidate the mechanism of electrically based signalling, biomagnetic measurements of electrical activity in bean plants were conducted over the entire plant. The superconducting quantum interference device (SQUID) sensor is sensitive enough to detect very low quasi-static biomagnetic ®elds. SQUID's sensitivity is
today around 10±14 T (10 fT). The currents causing the measured biomagnetic ®eld should be closed within a large volume. This can be achieved by immersing the whole plant in a suitable ionic solution. This method, which is non-invasive and does not involve direct contact, has been used in the past to monitor electrical activity in animal cells, which also respond to injury with electrical activity (Trontelj et al. 1989; Curio et al. 1993). The measurements aim to provide information on electrical propagation, injury-induced currents and the source of currents in wound-stimulated tissue. In the following sections the measurements and data analysis, including current source modelling and inverse calculation, are presented. Typical measurement results as well as the results of model calculations are demonstrated in detail. The discussion and conclusions then follow.
Materials and methods Measurements were performed on 21- to 23-day old Vicia faba (cv Hangdown). Plants were grown in garden peat in a greenhouse. Electric measurements of the membrane potential of vascular leaf cells were conducted with conventional intracellular electrodes on some plants and are described in detail elsewhere (Jazbinsek et al. 1999). Magnetic measurements were performed using 49 low-noise ®rst-order SQUID gradiometers (70 mm baseline) covering a planar area of 210 mm diameter (Drung 1995), operated inside a conventional shielded room (Vakuumschmelze Ak 3b) in the Klinikum Benjamin Franklin, Berlin. The analog magnetic ®eld signals were bandpass ®ltered from 0.16 Hz to 64 Hz and sampled at a rate of fs=250 Hz. Only the z-component of the magnetic ®eld was measured. Since the expected injury currents are in the frequency range below 0.1 Hz, a mechanical modulation of the measured plant was introduced. The measured plant was installed on a hydraulically driven moving table (Wuebbeler et al. 1998) that oscillated sinusoidally with a peak-to-peak amplitude of 4.4 cm and a frequency fm=0.7 Hz. Part of the measured plant was immersed in a square Plexiglas chamber (inner dimensions 17 cm ´ 17 cm ´ 2 cm) containing a standard recording solution (1 mM KCl, 0.5 mM CaCl2, 0.5 mM NaCl and 0.5 mM Mes/ KOH, pH 6.1) (see Fig. 1). We also tested a high-salt solution (100 mM NaCl, 2 mM KCl, 1.8 mM CaCl2) as a recording solution with practically the same results. That was to be expected, since the recording solution is used to spread the return current over a larger volume. The duration of each measurement was 20±25 min. An HP workstation was used for data acquisition. The covariance method was applied for extracting the d.c. component of the modulated magnetic ®eld data. Brie¯y, the data analysis was performed at data intervals Dj=(tj±T/2, tj+T/2) around successive time points tj (j=0, 1, . . . Nt). Here T is the length of data interval Dj and Nt=(Tmes±T)/Dt is the total number of data intervals, Tmes is the length of the whole measurement and Dt is the step between two successive time points. For each data interval Dj the average signal amplitude is obtained as the covariance between the measured magnetic signal and the modulation signal. For a sinusoidally oscillating table, the position can be described as m
ti mi Mcos
2 p f m ti
1
where M is the modulation amplitude, fm the modulation frequency and ti the time of the ith sample within the time interval Dj. The plant response in each channel is also modulated by frequency fm. For channel k we write: Bk
ti Bki A
Bk cos
2pfm ti
2
517
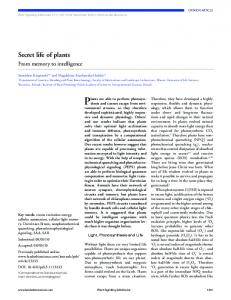
Fig. 1A, B Measuring set-up. A Schematic representation. The origin of the Cartesian coordinate system is in the centre of sensor's (xy) plane. The distance h from the upper table position to the bottom of the Dewar was 4.2 cm and the table amplitude was 2.2 cm (peak-to-peak 4.4 cm). The distance from the Dewar bottom to the sensor plane was 1.2 cm. The square chamber with inner sides of 17 cm was ®lled with recording solution in the region from 1.0 to 3.0 cm above the table. The ``allowed'' depth of the source in the central table position is therefore z=(±6.6, ±4.6) cm, where z is measured from the sensor plane. A plant was submersed into the recording solution with the stem approximately along the y-direction. B Photograph of the moving table with plant number 5 under the Dewar
tudes at higher harmonics of the modulation frequency. However, only the amplitude at the modulation frequency re¯ects the amplitude of the modulated quasi-d.c. signal. In the present study we prefer to use the covariance method for calculation of A(Bk) because Eq. (5) is mathematically simpler and therefore much faster than the short-time Fourier transform method. For modelling measured data with a clear dipolar iso®eld pattern, we applied the nonlinear Levenberg-Marquardt least-squares method (Press et al. 1989) using two source models, the current dipole (CD) and the linear current source (LS). CD is a point-like source model representing a current element and its z-component is: l Bz 0 3 p
y cos u x sin u
6 4pR
where Bk(ti) stands for the z-component of the measured magnetic ®eld in the kth channel as a function of time and A(Bk) is the average amplitude of the modulated magnetic ®eld within the time interval Dj. The covariance of the discrete measured magnetic signal and the modulation signal during n periods of modulation signal is by definition:
where p is the CD strength, u is the angle between the current dipole p and the x-axis and R x2 y 2 z2 is the distance from the source to the sensor. The extended current source model LS gives (Burgho et al. 1991): 8 2 3 > < l p y cos u 6 xa x a 7 Bz 0 4 i12 h i12 5 >
y 2 z2 h 4p 2a : 2 2
x a y 2 z2
x a y 2 z2 2 39 > = x sin u 6 ya y a 7 4 5 1 1 h i h i
x2 z2 2 2 >
y a2 x2 z2
y a2 x2 z2 ;
N � 1X Bk cov Bk ; m N i1 i
� � k
m i B
� 1 � A Bk M m 2
3
where N=nfs/fm is the number of measured points in the given time � k and m � are the mean values of Bk and m. The interval, and B modulation amplitude M is: p M 2cov
m; m
4 The response of the plant follows from Eqs. (3) and (4) as: r PN � � k
mi m � � 2 i1 Bki B q A Bk PN N 2 � m i1
mi
5
We chose to calculate A(Bk) within 7 periods of modulation, i.e. within 10 s, which means n=7, N=2500. For the time step Dt between two reconstructed amplitudes we selected Dt=1 s. The reconstructed signal amplitudes are presented either as a function of time for all channels or as an iso®eld representation for dierent time instants. Equation (5) is independent of the sampling and modulation frequency; the only requirement is that the time interval used in the calculation is equal to a multiple of the modulation period. The time evolution of A(Bk) can be equivalently reconstructed by the short-time Fourier transform method (Akay 1995). We applied this method in our earlier work (Jazbinsek et al. 1999), where it was shown by a careful simulation study, as well as preliminary electric and magnetic measurements, that extremely slow events which accompany plant injury can be registered. Beside the amplitude at the modulation frequency, the Fourier transform reveals information about the measured signal at other frequencies, for example the characteristics of low-frequency noise and ampli-
7 where R is the distance from the source centre to the sensor and u is the angle between the current direction and the x-axis. This source represents a current, J=p/2a, uniformly distributed along a straight line of length 2a. For a ® 0 the linear source in Eq. (7) becomes equal to the CD source in Eq. (6). In the ®tting procedure we also included calculation of the covariance between the measured (modulated) magnetic ®eld and the simultaneously recorded modulation signal; the source depth (z-coordinate) in the models in Eqs. (6) and (7) is modulated with m(t) in Eq. (1). The model function is then A(Bz) from Eq. (5), where Bz is one of the basic models in Eqs. (6) and (7). Prior to measurements on plants, the garden peat as well as other materials that could possibly contain ferromagnetic materials, such as the containers, modelling clay used to mount the plants in the Plexiglas chamber and the chamber itself, were carefully tested for magnetic contamination.
Results The measurement section is organised according to the type of wound in¯icted:
518
1. Measurements with plants subjected to a serious wound (a large cut on the stem). 2. Measurements on plants experiencing a small wound induced by local burning: approximately 2 cm2 of a leaf were exposed to the ¯ame of a burning candle. Type 2 is further divided into two subsections: a. Plants with a reduced number of leaves under SQUID magnetometers. This was achieved by removing some leaves the day before measurement. b. Plants with a normal distribution of leaves under SQUID magnetometers. Altogether, eight plants were investigated. Several measurements were performed on each plant: some trial recordings without injury and one or two measurements with injury. The most illustrative examples will be shown in detail. The results of the measurements are presented as a time evolution of the signal [A(Bk) calculated from Eq. (5)] in all channels. The dotted silhouette of a given plant is superimposed on each of these graphs. In addition, some characteristic iso®eld maps are included. Before making plots, additional boxcar averaging at 25 s intervals was applied for further smoothing. In Fig. 3A the time evolution of a plant response before making a large wound is shown in all 49 channels. Under these conditions, a small activity in the area above the plant's leaves can be noticed (see also Fig. 2B for the distribution of leaves). Figure 3D shows the characteristic iso®eld map for this case. There is no indication of symmetry between the positive and negative iso®eld patterns, which is typical for a dipolar iso®eld pattern. On the contrary, there is a dramatic change after cutting the plant's stem and removing the top part. The clear symmetric dipolar-like iso®eld pattern indi-
Fig. 2 A Drawing of plant number 5. a1 and a2 denote leaves that were burnt in two separate measuring sessions, while a3 indicates the leaf base. B Drawing of plant number 8 cut at the indicated position 1 min before the measurement
cates an active localizable current source (Fig. 3E). From the time evolution of the signal A(Bk) in Fig. 3B and C, an exponential decay of electrophysiological activity is clearly noticeable. The characteristic decay time was about 10 min. Figure 2A illustrates the positioning of the plant for a measurement of type 2a. This plant was immersed in the standard recording solution with only one pair of leaves. Several experiments were performed: Fig. 4A shows the A(Bk) signal from the plant without recording solution in the chamber and with no stimulation. There is only background noise and some small disturbing artefacts. When the same plant was submersed in the recording solution, the response signal was not signi®cant. Nonetheless, some activity could be noticed, predominantly above the pair of leaves (Fig. 4B). After stimulation by burning on one of the younger leaves (leaf a2 in Fig. 2A), both the signal A(Bk) (Fig. 4C, D) and the iso®eld maps (Fig. 4E, F) reveal the onset of activity reminiscent of a slow depolarization starting approximately 4 min after stimulus onset and increasing in the following 6 min. During the subsequent time, all signals experience an amplitude reduction. Note that in this case, where one of the younger leaves was burnt, the plant's stem was oriented so that the y-axis pointed from the youngest leaf towards the roots (Fig. 4A). In other experiments, where one of the older leaves was burnt, as well as in the experiment with cutting injury (Figs. 2B and 3), the plant's stem was oriented in the opposite direction. It is evident from a comparison of the iso®eld maps in Fig. 4E and F that the centre of excitation moved along the stem about 3.5 cm in 5 min. For the case 2a (Fig. 4C, E and F), where the iso®eld lines well resembled the dipolar pattern, both source model functions [Eqs. (6) and (7)] were applied in the ®tting procedure. Source parameters were calculated for each second in a given time interval after the stimulation. The LS model gave slightly better results. That was to be expected because the elongated iso®eld pattern (cf. Fig. 4F) indicated the presence of a longer current distribution. In addition, we also obtained an estimate of the excitation length (2a). Table 1 summarizes the results of the ®tting procedure with the LS model for all measurements where we observed a dipolar response to burning (plant numbers 1, 5, 6, 7 and 8). Plant numbers 2, 3 and 4 also produced a magnetic signal upon burning, but with a non-dipolar magnetic ®eld distribution. For those plants with a dipolar magnetic ®eld, some equivalent current source parameters, averaged over a 1±3 min subinterval where the maximum level of activity is reached, are given. The depth of the source z was successfully localized within the acceptable region for all cases (see Fig. 1A). The LS length 2a gives an estimate of the excitation length, which is between 6 and 10 cm for stimulation by burning and between 4 and 5 cm for cutting injury. The CD strength and current J=p/2a show maximal levels of activity, equal to 4±17 nAm and 0.1±0.24 lA, respectively. The goodness of ®t (GOF) shows how well A(LS)
519
Fig. 3A±E Measurements on plant 8 (see Fig. 2B). Time evolution of the magnetic ®eld in all channels: A 25±10 min before cutting the plant and B 1±16 min after cutting. A sketch of the plant is shown with dotted lines and the inner side of the chamber is indicated by a dashed line. C The solid line represents the time evolution of the injury-related r.m.s. magnetic ®eld from panel B, full dots show the r.m.s. values of the magnetic ®eld each 15 s in the ®rst 10 min after injury. These values were ®tted with the exponential decay function shown by the dotted line. D and E iso®eld maps 10 min before and 1.5 min after injury, respectively. Here, t denotes time from the injury in s, m and M are minimal and maximal ®eld values in fT, and D the step between two iso®eld lines in fT. Solid, dash-dot-dash and dotted line styles represent positive, zero and negative iso®eld lines, respectively. Positions of magnetic sensors are shown by + and ± in accordance with the measured ®eld sign
®ts measured data. Two measurements (5a, 5b) were performed on the same plant within 16 h. In the ®rst, leaf a1 was burnt, and, in the second, leaf a2 (Fig. 2A). The angle u determines the direction of the current source, which in the present cases (with the exception of plant 6) is along the stem, i.e. approximately in the direction of the y-axis. For both measurements on plant number 5 the current pointed to the +y direction. In other plants (numbered 1, 7, 8) the current pointed in the
opposite direction. A reasonable explanation for this behaviour could be that the plant responds to an injury with the current pointed in the same direction (towards the roots), regardless of the injury site. Localization results (x,y,z coordinates of the equivalent current source) show that there is no signi®cant spreading of excitation in almost all cases. The only exceptions are the two measurements on plant number 5, where we noticed a time-limited excitation propagation with velocities between 0.5 and 2 cm/min. For all other cases it seems that the centre of excitation is almost ®xed, only the amplitude of response changing with time.
Discussion The biomagnetic measurements performed on V. faba plants provide complementary information to the electric potential dierence measurements on beans (Roblin 1985; Roblin and Bonnemain 1985) and other plant species in response to local wounding (e.g. Wildon et al. 1992; Stankovic et al. 1997; Herde et al. 1998). From the
520
Fig. 4A±F Measurements on plant 5 (see Fig. 2A). A Time evolution of all measured magnetic channels without recording solution and no stimulation by burning; B same as panel A but recording solution is included; C same as panel B but stimulation by burning is included 5 min after the beginning of measurements. D Time evolution of injury-related magnetic ®elds in one of the channels from panel C (the third channel in the fourth row). Notice the artefact at time = 5 min due to the burning stimulation procedure. E and F two iso®eld maps 5 and 10 min after injury, respectively. Here t denotes time after the beginning of measurement. Other labels are explained in Fig. 3D and E
calculated time sequence of the iso®eld maps, we can follow the spatial and temporal evolution of magnetic activity over a large area, in our case over the vital part of the V. faba plant. This additional information was obtained non-invasively and without touching the plant. In some cases where we obtained the iso®eld maps in a form close to a dipolar ®eld distribution, we used an
equivalent current dipole to model the magnetic ®eld distribution over the V. faba plant. Though it is dicult to ®nd an electrophysiological explanation for this type of current source in most cases, it seems to be a reasonable description of the current source in the case of a large wound (Fig. 3E). In this case, a strong localizable ¯ow of ions takes place at the wound. The estimated CD strength p and current J associated with the ionic transport obtained 1.5 min after the cutting injury were 6.6 nAm and 0.14 lA, respectively. The time decay of electrophysiological activity is determined from the r.m.s. values of the signal displayed in Fig. 3B. The result is shown in Fig. 3C; we obtained a characteristic decay time T=10 min (GOF=90%). Exponential decay was assumed. Similar behaviour was observed in injured human muscle, only the decay time being almost one order of magnitude longer (Mackert et al. 1999).
Table 1 Some averaged parameters and their standard deviations calculated by A(LS) Number
Case
zrz (cm)
prp (nAm)
2ar2a (cm)
JrJ (lA)
uru (°)
GOF (%)
1 5a 5b 6 7 8
2b 2a 2a 2a 2a 1
±5.241.10 ±5.720.07 ±5.570.05 ±5.540.10 ±5.480.15 ±5.240.05
4.10.9 17.20.5 11.00.5 11.30.2 8.00.9 6.60.3
9.40.5 7.20.1 6.20.3 6.80.2 8.11.2 4.60.2
0.150.02 0.240.01 0.180.02 0.170.01 0.100.03 0.140.01
±1080.8 97.70.4 89.61.6 53.16.3 ±94.74.0 ±88.80.3
59.02.3 74.21.2 81.51.4 70.03.7 67.52.7 74.12.9
521
The maximal currents obtained in plants with stimulation by burning were between 0.1 and 0.24 lA. These values were estimated from the CD strength p and the source length 2a (J=p/2a). From this current one can estimate the average order of magnitude of the current density of 0.01 lA/mm2, where it is assumed that the bean stem cross-section is approximately 20 mm2. The localization of maximal electrophysiological activity ± the position of the equivalent current source ± overlaps the stem location with an accuracy of better than 1 cm. The dynamics of the transient magnetic signal measured in every channel upon stimulation by burning was similar to the voltage changes recorded previously with extracellular electrodes on beans in response to the same kind of stimulus (compare Fig. 4D and Roblin and Bonnemain 1985). The congruent dynamics of both signals gives good evidence that both methods in essence report the same underlying electrical events. However, there are also signi®cant discrepancies in the results obtained by the two techniques, which have implications for understanding the signal induced by burning. The magnetic signal is detected ± other than the extracellular voltage signal ± over the larger area simultaneously. For cases belonging to groups 2a and 2b it was most pronounced in the area of the leaves and even more at the base of the leaves far removed from the site of stimulation (Fig. 4C). It is interesting to add a con®rming ®nding: the highest signal activity was also connected with the position of the leaves/petioles and the base of the leaves only after we positioned plants in the recording solution under the SQUID magnetometer (we term this a ``handling artefact'') before starting to stimulate by burning (e.g. Fig. 3). This suggests a high density of cells with electrical activity in leaves/petioles and leaf base tissue. The nature of these electrically active cells remains to be discovered. It is worth noting that bean plants have pulvini at the base of their petioles. Stimulation of these potentially electrically excitable motor cells (Freudling et al. 1980) could serve as a current source for the magnetic signal. However, since magnetic signals could also be observed in the node region after removing petioles and leaves (data not shown), it must be assumed that the stem also has a high density of electrically active cells in the node region. It is inherent to the ®nding that the magnetic signal occurs predominantly in correlation with leafs/petioles and nodes that the magnetic signal shows no signi®cant longdistance propagation. From this ®nding we conclude that the postulated signal which is sent out from the burned area is either not of electrical nature (e.g. a hydraulic wave or diusive compound) or that it is so small that its magnetic counterpart signal is smaller than the magnetometer sensitivity. In test measurements we estimated that the sensitivity limit of magnetic detection is about 10 fT, which corresponds to a dipole moment of 1 nAm at a distance of z=6 cm. Hence, if the propagated signal is electrical in nature, it must be associated with currents of less than 10 nA.
However, we also have to mention the possibility that the reduction or absence of a magnetic ®eld, detectable by SQUID magnetometers, is connected with the return current. Namely, SQUID senses the total magnetic ®eld in its vicinity. If the return current with the opposite direction of propagation is very close to the original current, then the two magnetic ®elds subtract and the SQUID sensor sees no net magnetic ®eld. It is very probable that in the stem region the sieve-tube element/ companion cell complex (Rhodes et al. 1996) serves as the pathway for electric signal propagation. This may limit the lateral extension of the return current from its source and hence explain the absence or the reduction of a magnetic signal above the stem region. The magnetic signal shows only a short propagation distance in some cases, such as for instance Fig. 4E and F for plant number 5. There the signal spreading velocity can be determined over a distance of 3.5 cm. The average signal velocity obtained from Fig. 4E and F is 0.7 cm/min. On the other hand, previous recordings of burning-stimulated voltage variations in beans also reported signals in the stem region and gave evidence for considerable long-distance propagation (Roblin and Bonnemain 1985). The discrepancy between the two ®ndings remains unknown. A possible explanation combining both ®ndings is the following: the woundinduced signal is electrical in nature. It is propagated by a small population of cells in the stem, i.e. the density of electrically active cells per cross-section of the stem area is low. In the node area, this signal triggers the electrical activity of cells that are present at a high density. This would explain the locally limited occurrence of the magnetic signal, a signal that is proportional to the integral eective current. Monitoring of voltage changes, on the other hand, is not directly proportional to the number of cells activated. With extracellular electrodes, it does not really matter if only a few or all cells in the vicinity of the electrode are stimulated. Considering the above-mentioned sensitivity limits of magnetic detection, we could estimate that in this case the density of electrically active cells in the node area must be at least 10 times higher than in the stem. Such tissue speci®city of electrical activity could in fact be physiologically relevant in the sense that it might promote spreading of a low-intensity signal from the stem into the petiole/leaf tissue. The leaf tissue, which comprises the main target for the wound signal, is proportionally much larger than the signal-conducting stem. Furthermore, the vascular system spreads out greatly in the leaf blade and probably imposes an increasing resistance for a spreading signal. Hence, a signal ampli®cation or transformation step at the petiole/stem junction appears useful in order to guarantee eective distribution of a wounding signal to the target cells. In conclusion, we can say that all measured plants responded to stimulation by burning and that the phenomenon was magnetically detected. We could not con®rm by magnetic measurements the long-distance spreading of electric activity. Correspondingly, it is not
522
yet possible to favour one of the three possible mechanisms of long-distance signalling in wounded plants mentioned in the introduction. Acknowledgements The authors would like to thank Mr. B. Raufeisen for the plant drawings. Two of the authors (V.J. and Z.T.) express their thanks for partial support in the framework of German-Slovene bilateral scienti®c cooperation.
References Akay M (1995) Wavelets in biomedical engineering. Ann Biomed Eng 23: 531±542 Bowles DJ (1990) Defence-related proteins in higher plants. Annu Rev Biochem 59: 873±907 Burgho M, Haberkorn W, Trahms L, Erne SN (1991) Forward and inverse calculations for extended sources. In: Nenonen J, Rajala H-M, Katila T (eds) Biomagnetic localization and 3D modeling. Helsinki University of Technology, Department of Technical Physics, Report TKK-F-A689, pp 98±107 Chessin M, Zipf AE (1990) Alarm systems in higher plants. Bot Rev 56: 193±235 Curio G, Erne SN, Burgho M, Wol H-D, Pilz A (1993) Noninvasive neuromagnetic monitoring of nerve and muscle injury currents. Electroenceph Clin Neurophys 89: 154±160 Drung D (1995) The PTB 83-SQUID system for biomagnetic application in clinic. IEEE Trans Appl Supercond 5: 2112±2117 Freudling C, Mayer W-E, Gradmann D (1980) Electrical membrane properties and circadian rhythm in extensor cells of the laminar pulvini of Phaseolus coccineus L. Plant Physiol 65: 966± 968 Herde O, Pena-Cortes H, Fisahn J (1995) Proteinase inhibitor II gene expression induced by electrical stimulation and control of photosynthetic activity in tomato plants. Plant Cell Physiol 36: 737±742 Herde O, Pena-Cortes H, Willmitzer L, Fisahn J (1998) Remote stimulation by heat induces characteristic membrane-potential responses in the vein of wild-type and abscisic acid-de®cient tomato plants. Planta 206: 146±153 Jazbinsek V, Thiel G, Mueller W, Trontelj Z (1999) Possible magnetic detection of injury currents in bean plants. In: Yoshimoto T, Kotani M, Kuriki S, Karibe H, Nakasato N (eds) Recent advances in biomagnetism. Tohoku University Press, Sendai, pp 1106±1109 Mackert BM, Mackert J, Wuebbeler G, Armbrust F, Wol K-D, Burgho M, Trahms L, Curio G (1999) Magnetometry of injury currents from human nerve and muscle specimens using superconducting quantum interference devices. Neurosci Lett 262: 163±166
Malone M (1992) Kinetics of wound-induced hydraulic signals and variation potentials in wheat seedlings. Planta 187: 505±510 Malone M, Alarcon J-J, Palumbo L (1994) An hydraulic interpretation of rapid, long-distance wound signalling in tomato. Planta 193: 181±185 Pearce G, Strydom D, Johnson S, Ryan CA (1991) A polypeptide from tomato leaves induces wound-indelible proteinase inhibitor proteins. Science 253: 895±898 Pickard BG (1973) Action potentials in higher plants. Bot Rev 39: 172±201 Press WH, Flannery BP, Teukolsky SA, Vetterling WT (1989) Numerical recipes ± the art of scienti®c computing. Cambridge University Press, Cambridge Rhodes JD, Thain JF, Wildon DC (1996) The pathway for systemic electrical signal conduction in the wounded tomato plant. Planta 200: 50±57 Roberts K (1992) Potential awareness of plants. Nature 360: 14±15 Roblin G (1985) Analysis of the variation potential induced by wounding in plants. Plant Cell Physiol 26: 455±461 Roblin G, Bonnemain J-L (1985) Propagation in Vicia faba stem of a potential variation induced by wounding. Plant Cell Physiol 26: 1273±1283 Ryan CA (1992) The search for the proteinase-inhibitor inducing factor PIIF. Plant Mol Biol 19: 123±133 Stankovic B, Davies E (1996) Both action potentials and variation potentials induce proteinase gene expression in tomato. FEBS Lett 390: 275±279 Stankovic B, Davies E (1998) The wound response in tomato involves rapid growth and electrical responses, systemically upregulated transcription of proteinase inhibitors and calmodulin and down-regulated translation. Plant Cell Physiol 39: 268±274 Stankovic B, Zawadzki T, Davies E (1997) Characterization of the variation potential in sun¯ower. Plant Physiol 115: 1083± 1088 Thain JF, Wildon DC (1993) Electrical signalling in plants. In: Schultz JC, Raskin I (eds) Plant signals in interactions with other organisms. American Society for Plant Physiology, Maryland, pp 102±115 Trontelj Z, Pirnat J, Luznik J, Jazbinsek V, Valencic V, Krizaj D, Vodovnik L, Jercinovic A (1989) Measurement of magnetic ®eld near an acute surgical injury on the rabbit's thigh. In: Williamson SJ, Hoke M, Stroink G, Kotani M (eds) Advances in biomagnetism. Plenum, New York, pp 517±520 Wildon DC, Thain JF, Minchin PEH, Gubb IR, Reilly AJ, Skipper YD, Doherty HM, O'Donnell PJ, Bowles DJ (1992) Electrical signalling and systemic proteinase inhibitor induction in the wounded plant. Nature 360: 62±65 Wuebbeler G, Mackert J, Armbrust F, Burgho M, Mackert B, Wol K-D, Ramsbacher J, Curio G, Trahms L (1998) SQUID measurements of human nerve and muscle near-DC injurycurrents using a mechanical modulation of the source position. Appl Supercond 6: 559±565