Biogeosciences, 9, 5143–5160, 2012 www.biogeosciences.net/9/5143/2012/ doi:10.5194/bg-9-5143-2012 © Author(s) 2012. CC Attribution 3.0 License.
Biogeosciences
Management, regulation and environmental impacts of nitrogen fertilization in northwestern Europe under the Nitrates Directive; a benchmark study H. J. M. van Grinsven1 , H. F. M. ten Berge2 , T. Dalgaard3 , B. Fraters4 , P. Durand5 , A. Hart6 , G. Hofman7 , B. H. Jacobsen8 , S. T. J. Lalor9 , J. P. Lesschen10 , B. Osterburg11 , K. G. Richards9 , A.-K. Techen11 , F. Vert`es5 , J. Webb12 , and W. J. Willems1 1 PBL
Netherlands Environmental Assessment Agency, Department: Water, Agriculture and Food, Bilthoven, The Netherlands Research International, Wageningen University and Research Centre, The Netherlands 3 Aarhus University, Department of Agroecology, Foulum, Denmark 4 National Institute for Public Health and the Environment, Bilthoven, The Netherlands 5 INRA, UMR1069, Sol Agro and Hydrosysteme, 35000 Rennes, France 6 Environmental Agency, Olton, UK 7 Ghent University, Department of Soil Management, Belgium 8 Institute of Food and Resource Economics, University of Copenhagen, Denmark 9 Teagasc, Crops Environment and Land Use Programme, Johnstown Castle, Wexford, Ireland 10 Alterra, Wageningen University and Research Centre, The Netherlands 11 Institute of Rural Studies, Johann Heinrich von Th¨ unen-Institut (vTI), Bundesforschungsinstitut f¨ur L¨andliche R¨aume, Wald und Fischerei, Germany 12 AEA Energy and Environment, Didcot, UK 2 Plant
Correspondence to: H. J. M. van Grinsven (
[email protected]) Received: 21 May 2012 – Published in Biogeosciences Discuss.: 22 June 2012 Revised: 16 November 2012 – Accepted: 19 November 2012 – Published: 14 December 2012
Abstract. Implementation of the Nitrates Directive (NiD) and its environmental impacts were compared for member states in the northwest of the European Union (Ireland, United Kingdom, Denmark, the Netherlands, Belgium, Northern France and Germany). The main sources of data were national reports for the third reporting period for the NiD (2004–2007) and results of the MITERRA-EUROPE model. Implementation of the NiD in the considered member states is fairly comparable regarding restrictions for where and when to apply fertilizer and manure, but very different regarding application limits for N fertilization. Issues of concern and improvement of the implementation of the NiD are accounting for the fertilizer value of nitrogen in manure, and relating application limits for total nitrogen (N) to potential crop yield and N removal. The most significant environmental effect of the implementation of the NiD since 1995 is a major contribution to the decrease of the soil N balance
(N surplus), particularly in Belgium, Denmark, Ireland, the Netherlands and the United Kingdom. This decrease is accompanied by a modest decrease of nitrate concentrations since 2000 in fresh surface waters in most countries. This decrease is less prominent for groundwater in view of delayed response of nitrate in deep aquifers. In spite of improved fertilization practices, the southeast of the Netherlands, the Flemish Region and Brittany remain to be regions of major concern in view of a combination of a high nitrogen surplus, high leaching fractions to groundwater and tenacious exceedance of the water quality standards. On average the gross N balance in 2008 for the seven member states in EUROSTAT and in national reports was about 20 kg N ha−1 yr−1 lower than by MITERRA. The major cause is higher estimates of N removal in national reports which can amount to more than 50 kg N ha−1 yr−1 . Differences between procedures in member states to assess nitrogen balances and water
Published by Copernicus Publications on behalf of the European Geosciences Union.
5144
H. J. M. van Grinsven et al.: Benchmarking the Nitrates Directive in northwestern Europe
quality and a lack of cross-boundary policy evaluations are handicaps when benchmarking the effectiveness of the NiD. This provides a challenge for the European Commission and its member states, as the NiD remains an important piece of legislation for protecting drinking water quality in regions with many private or small public production facilities and controlling aquatic eutrophication from agricultural sources.
1
Introduction
The main aim of the Nitrates Directive (1991: Directive 91/676/EEC; hereafter referred to as NiD) is to reduce water pollution caused or induced by nitrate and phosphorus from agricultural sources. The NiD is the most important piece of European (EU) regulation for reducing environmental impacts of fertilizer and manure and for increasing nitrogen use efficiency. The gross nitrogen balance, or nitrogen surplus, (Schr¨oder et al., 2004; Vries et al., 2011) is an important indicator to evaluate the environmental impacts of the Nitrates Directive, particularly for the water compartment. This makes the NiD an important supporting instrument for other EU directives i.e. the Drinking Water Framework Directive (98/83/EC), the Water Frame Directive (2000/60/EC) and the Marine Strategy Framework Directive (2008/56/EC). The NiD legally restricts annual farm application of manure to 170 kg ha−1 of nitrogen, or in case of derogation to inputs up to 250 kg ha−1 (Oenema, 2004). The tenacious problem of regional nitrogen (and phosphorus) surpluses can be resolved by manure transport to other regions and by manure processing. In the case of the Netherlands and the Flemish region, part of the (processed) manure is exported to other countries. Agricultural practices in general, and more specifically application rates and management of chemical fertilizers and animal manures, vary greatly between and within EU member states. This makes it interesting to compare nitrogen management and regulation between countries and relate this to the observed states and trends of nitrate concentrations in groundwater and surface water. Since the introduction of the NiD in 1991, EU member states have implemented several action programs and have delivered several monitoring reports. The EU Commission obliges member states to report on the results of these action programs. It also charged synthesizing studies on these national reports but these reports are not publicly available. However, the EU Commission did publish summaries of the national data and reports in 2007 and 2011. In addition, Fraters et al. (2011) evaluated the effectiveness of environmental monitoring programs for the NiD. However, overall insight into the effectiveness of the NiD in the EU is still limited and rarely published in peerreviewed journals. Together with the submission of the next set of national monitoring reports for the NiD, this paper could increase this insight and help to improve implementation of the NiD across the EU.
Biogeosciences, 9, 5143–5160, 2012
The combination of environmental directives and the Common Agricultural Policy should provide food security and a healthy natural environment in Europe while maintaining a level playing field for the agricultural entrepreneurs (De Clercq et al., 2001). This is particularly true for agriculture in northwestern EU member states as they compete to provide food to consumers in the so-called “London-Berlin-Paris triangle”. The purpose of this paper is to compare, evaluate and benchmark the implementation of the Nitrates Directive in the northwestern member states of the EU. The objective is to relate differences in implementation to differences in structure, intensity and practices of the agricultural sector and to sensitivity of soil water systems to nitrate pollution. Key issues of the NiD addressed in the benchmark are application rates of N in manure, the balance between applied N and crop requirements and water quality in relation to the ni−1 trate target of 50 mg NO− 3 L . The comparison is restricted to Denmark, Germany, the Netherlands, Belgium, the United Kingdom, Ireland and the northern part of France. Crop and fodder production potential per hectare on comparable soils in these countries are similar. Note however, that within the United Kingdom there are four separate governments and in Belgium two, which implement the Nitrates Directive in differing ways. Moreover, all these countries have regions with high livestock densities, causing feed requirements to exceed regional feed production, and manure production to exceed regional crop demands. 2 2.1
Materials and methods Data sources
This analysis combines various existing studies on implementation of the Nitrates Directive (van Dijk and Berge, 2009; ten Berge and Dijk, 2009), gross nitrogen balances from Eurostat (2012), monitored nitrate concentrations in groundwater and surface water in synthesizing reports (European Commission, 2007, 2011; Fraters et al., 2011) and various national reports on implementation and evaluation of the Nitrates Directive for the last reporting period (Anonymous, 2008a, b, c, d; Desimpelaere et al., 2008; Zwart et al., 2008). A complication when comparing water quality data among EU member states (and sometimes within a single member state) to evaluate the NiD are the large differences in monitoring procedures, e.g. with regard to sampling density (Table 1), monitoring frequency and groundwater sampling depth (Fraters et al., 2011; European Commission, 2011), and data and procedures for calculation of nitrogen balances (Panten et al., 2009). In 2007 the total number of sampling sites for groundwater was 31 000 and for surface water 27 000.
www.biogeosciences.net/9/5143/2012/
H. J. M. van Grinsven et al.: Benchmarking the Nitrates Directive in northwestern Europe Table 1. Density of groundwater and surface water sampling for the whole land surface in monitoring programs for the NiD (European Commission, 2011). Density of groundwater sampling stations (points/1000 km2 )
Density of surface water sampling stations (points/1000 km2 )
99 3 34 5 1 33 13
38 1 5 3 3 13 33
Belgium Germany Denmark France Ireland Netherlands United Kingdom
2.2
Nitrogen balance
In this study, calculation of the gross nitrogen balance (GNB) was based on the OECD method (OECD, 2007). In addition the soil N balance (SNB) is used which sometimes is confused with the soil surface N balance (SSNB). The GNB represents the total potential loading of nitrogen from primary agricultural production to the environment, but excluding N emissions from fossil fuel combustion for energy requirements for e.g. fertilizer manufacturing, housing, transport and soil and crop management and correcting for export and processing of manure. SNB or soil N surplus represents the total potential loading from nitrogen use on agricultural soil, while SSNB represents the total net nitrogen loading to the soil and water compartment. GNB: fertilizer + manure production + other inputs − net manure export − crop removal SNB: GNB − N-loss housing − N-loss storage SSNB: SNB − N-loss manure application Other inputs include N deposition and biological N fixation (BNF), where N deposition is the result of NH3 and NOx emissions from both agricultural and other sources, mainly transportation and energy generation. Choosing one of the balance indicators for monitoring and evaluation of NiD effects is determined mainly by data availability. Data requirements for GNB are lowest, but GNB does not correct for environmental measures reducing ammonia emission following from other EU directives like the National Emission Ceilings (NEC) directive (2001/81/EC) and the Integrated Pollution Prevention (IPPC) directive (96/61/EC). However, different calculation procedures, particularly for determining manure input and nitrogen removal by crops, and also inclusion or exclusion of N-losses during housing and storage (difference between gross and net soil balance) and of smaller input items, may need to be taken into account when comparing national or regional nitrogen balances. For this reason the use of a model for determining the nitrogen balance is an additional valuable tool to evaluate the www.biogeosciences.net/9/5143/2012/
5145
effectiveness of the NiD. Model approaches are inherently more consistent regarding calculation schemes, but without sound ground validation, have a risk of not accounting for regional differences in response of crop removal and water quality to nitrogen fertilization. For example, in the UK a model approach is used to estimate nitrogen loading as part of the NiD assessments. Loadings are calculated using the NEAP-N model (Lord and Anthony, 2000) along with an urban estimation model (Lerner, 2000). Leip et al. (2008) coupled the economic model CAPRI and the mechanistic biochemical model DNDC for evaluation of the effects of agrienvironmental policies on the European environment, for example on groundwater pollution with nitrate. Here we use the model MITERRA-EUROPE to apply a consistent methodology to all countries. 2.3
MITERRA-EUROPE
The model MITERRA-EUROPE (referred to as MITERRA hereafter) was used to quantify the nitrogen balances and nitrate leaching from agriculture on both EU-27 level, country level, and regional level. By applying a uniform calculation scheme as in MITERRA we could scrutinize results in the national reports and benchmark nitrogen surpluses and nitrate concentration at the more appropriate sub-national level. MITERRA consists of an input module with activity data and emission factors, a set of measures to mitigate ammonia and greenhouse gas emission and nitrate leaching, a calculation module, and an output module (Velthof et al., 2009; Lesschen et al., 2011). The database of MITERRA is on national and regional level (NUTS2, according Nomenclature of Territorial Units for Statistics in the EU) and includes data of N inputs, N outputs, livestock numbers, land use, crop types, soil type, and emission factors for NH3 , N2 O, and NOx , and leaching factors for NO3 . For this paper we used an updated version of MITERRA as described in Velthof et al. (2011). Crop areas were derived from EUROSTAT at NUTS2 level and crop yields from FAOSTAT at national level as the EUROSTAT data was incomplete. Grassland yields and N contents of grassland were estimated using the methodology of Velthof et al. (2009), because grassland yields are not available from statistics. The number of livestock in each year was derived from EUROSTAT. Data on annual N fertilizer consumption were collected from FAOSTAT. The N excretion of all livestock categories except dairy cows were obtained from the GAINS model (Klimont and Brink, 2004). A method was developed to estimate the N excretion from dairy cows on regional level based on milk yields, grassland yields, and N inputs (Velthof et al., 2011). The total manure N production was calculated at the NUTS2 level from the number of animals and the N excretion per animal and then corrected for gaseous N losses from buildings and storage. A method was developed to distribute the manure over crops taking account of the maximum Biogeosciences, 9, 5143–5160, 2012
5146
H. J. M. van Grinsven et al.: Benchmarking the Nitrates Directive in northwestern Europe
Table 2. Precipitation surplus and fraction of nitrogen surplus leaching to groundwater, the fraction leaching to surface waters and the runoff fraction of N in applied fertilizer, grazing and manure, used in the MITERRA model.
Belgium-Flemish Belgium-Walloon Denmark Northern France Germany Ireland Netherlands United Kingdom
Precipitation surplus mm
Fraction leaching to groundwater %
Fraction leaching to surface water %
Fraction in surface runoff %
396 479 280 356 295 554 420 450
23 11 24 13 13 10 17 11
9 12 6 10 10 8 7 10
3 4 2 5 4 3 3 3
annual manure application of 170 kg N ha−1 or higher in case of a derogation. Nitrogen fertilizer was distributed over crops relative to their nitrogen demand, taking account of the amount of applied manure and grazing manure and their respective fertilizer equivalence (Velthof et al., 2009). Further nitrogen inputs include biological N fixation, which is estimated as a function of land use and crop type (legumes) and nitrogen deposition that is derived at NUTS2 level from EMEP (EMEP, 2010). Nitrogen leaching in MITERRA is calculated by multiplying the soil N surplus by a region specific leaching fraction, which is based on soil texture, land use, precipitation surplus, soil organic carbon content, temperature and rooting depth (Table 2). Surface runoff fractions are calculated based on slope, land use, precipitation surplus, soil texture and soil depth (Velthof et al., 2009). These parameters are derived from more detailed spatial data sources, and weighted average values for agricultural land are used at the NUTS2 level. The nitrate concentration in leaching water is calculated by dividing the amount of nitrogen leaching from agriculture by the total water flux, which is calculated as the precipitation surplus, derived from the EuroPearl model (Tiktak et al., 2006), minus surface runoff. The MITERRA model has been used in several EU studies and outcomes have been compared with other model results and national reported values. De Vries et al. (2011) compared several models, including MITERRA, on nitrogen budgets, and showed that MITERRA outcomes are in line with other model results. The distribution of calculated mean NO3 concentrations in NUTS 2 regions of EU-15 according to MITERRA agreed very well with the distribution of the means of measured NO3 concentrations in the EU-15, according to measured data from 2000–2003 (Velthof et al., 2009).
Biogeosciences, 9, 5143–5160, 2012
3 3.1
Results Characteristics of agriculture and nutrient use in northwestern EU
Mean annual temperatures range between 8 and 12 ◦ C, with minimum daily temperatures in January around 0 ◦ C and maximum daily temperatures around 20 ◦ C in July. Mean annual precipitation ranges from values exceeding 1000 mm per year in western coastal regions to 500 mm per year in central France, and eastern UK and Germany (Tiktak et al., 2006). The combination of favorable climatic conditions, good agricultural practices and high inputs of fertilizer and manure allow high yields of cereals, potato, sugar beet, forage grass and maize and of milk, that generally exceed average values for the EU27 (Table 3). Yield differences per hectare in northwestern EU member states are largest for milk and ruminant meat because of large differences in shares of grazing beef and dairy cattle, areas of marginal grassland, grass in arable rotations (e.g. Denmark) and grazing intensity. Ireland, the UK and France hold large areas of less productive grassland on wet, peaty or mountain soils. All countries considered are net importers of substantial amounts of fodder and feed stuff, in the range of 200–400 kg per livestock unit (LSU; reference unit for livestock species based on feed requirement) in the period between 2000 and 2007 (FAOSTAT), with the exception of France (120 kg LSU−1 ). These differences explain a minor part of differences in milk and ruminant meat yield per hectare. Mean national livestock densities in the considered member states range between 0.9 LSU per hectare in northern France, which is near to the average in the EU27, to 3.4 LSU per hectare in the Netherlands (Table 4; using LSU definition according to Eurostat). The share of dairy cows (one dairy cow represents one Livestock Unit; LSU) ranges from 10 % in Denmark to 22 % in Ireland. Regional livestock densities can be much higher, with 8.9 LSU ha−1 in the southeastern part of the Netherlands, 6.0 LSU ha−1 in Flemish Region-Belgium and 3.7 LSU ha−1 in Brittany-France, and www.biogeosciences.net/9/5143/2012/
H. J. M. van Grinsven et al.: Benchmarking the Nitrates Directive in northwestern Europe
5147
Table 3. Mean annual yields in northwestern member states of the EU for cereals, forage maize, potato and sugar beet (Sources: FAOSTAT mean crop data are for the period 2000–2007; EFMA (2008), mean data for 2006–2009), and the sum of ruminant meat +0.1 × total milk production as a proxy for ruminant productivity per hectare of permanent grassland (Sources: production from FAOSTAT, data 2008, and grassland areas from Eurostat (2011), data 2007). FAO
Belgium Denmark France Germany Ireland Netherlands United Kingdom EU27
FAO FAO 2000–2007
FAO
FAO 2008
EFMA
EFMA 2006–2009
EFMA
Wheat ton ha−1
Forage maize ton ha−1
Potato ton ha−1
Sugar beet ton ha−1
Meat + 0.1 × Milk ton ha−1 grass land
All cereals ton ha−1
Potato ton ha−1
Sugar beet ton ha−1
8.2 7.1 6.9 7.3 8.9 8.2 7.7
11.1
43.4 39.5 41.4 40.9 35.2 43.5 41.6
67.9 57.3 76.5 59.1 48.6 61.6 54.7
1.09 1.67 0.50 0.85 0.36 1.85 0.25 0.43
8.8 5.9 7.2 6.5 7.0 8.2 7.1 5.0
46.0 44.7 45.7 40.1 32.8 46.3 41.6 29.0
65.0 55.7 82.5 58.0
8.6 8.8 11.2
63.2 61.7 62.1
Table 4. Main characteristics of agricultural sector in northwestern member states of the EU in 2007 (Eurostat, 2011).
Belgium Denmark France North-centralb Germany Ireland Netherlands United Kingdom EU27
Agricultural area (UAA) mln ha
Livestock density a LSU ha−1
Permanent Pasture % of UAA
Farm size ha UAA/holding
1.4 2.7 27.5 17.8 16.9 4.1 1.9 16.1 172.5
2.8 1.7 0.8 0.9 1.1 1.4 3.4 0.9 0.8
37 8 29 21 29 76 43 62 33
29 60 53 – 46 32 26 65 13
a In the EUROSTAT definition one LSU corresponds to the feed requirement of one adult dairy cow
producing 3000 kg of milk annually. b All departments above the line “Nantes-Dijon”.
are always associated with the presence of a large pig and/or poultry sector. Farm sizes per holding in the northwestern member states are much higher than the EU27 average. Nitrogen from manures constitutes a substantial proportion of total nitrogen fertilization, ranging between 40 % in Germany and Northern France, to 60–65 % in Belgium, Ireland and the Netherlands. In the Netherlands and the Flemish Region the net nitrogen excretion (after subtracting ammonia emission from housing and storage) exceeds the application limit of 170 kg ha−1 set by the NiD, by 40 and 12 kg ha−11 respectively, based on MITERRA results. These two countries require a combination of derogation, on the one hand, and export and processing of manure on the other hand, to be able to comply with the NiD at a national level. The sum of nitrogen excretion plus fertilizer use per hectare of utilized 1 Unless indicated otherwise the unit kg ha−1 refers to annual fluxes.
www.biogeosciences.net/9/5143/2012/
agricultural area (UAA) in the period 2005–2008 ranges between 138 kg ha−1 in France to 377 kg ha−1 in the Netherlands (Table 5) and exceeds mean values for EU12 (old member states) and EU27. 3.2
Application standards for nitrogen from manure and fertilizer
The most important restriction following from the NiD is the application limit for nitrogen from animal manure. Other restrictions following from the NiD are mandatory minimum manure storage capacities, prohibition periods for nutrient application, restrictions for nutrient application near water courses, on slopes and on frozen, waterlogged or snowcovered soils (van Dijk and ten Berge, 2009; Table 6). These restrictions should facilitate the achievement of the overall objective of the NiD to establish a balance between nutrient application and crop requirements. There are large Biogeosciences, 9, 5143–5160, 2012
5148
H. J. M. van Grinsven et al.: Benchmarking the Nitrates Directive in northwestern Europe
Table 5. Average annual inputs, crop removal and gross balance of nitrogen in 2005–2008 in northwestern member states of the EU (Eurostat, 2012).
Fertilizer
Inorganic manure
Gross
Other inputs
Removal
Gross N balance
191 101 112 125 155 194 111 98 89
119 98 52 93 55 210 101 58 50
kg N ha−1 Belgium Denmark France Germany Ireland Netherlands United Kingdom EU15∗ EU27
101 75 76 103 78 140 94 67 61
168 100 62 74 117 236 87 63 54
41 24 26 42 15 28 31 26 25
∗ EU15: member states between 1 January 1995 and 30 April 2004.
Table 6. Restrictions for application of fertilizer and manure in national implementations of the Nitrates Directive (Adapted from Dijk and Berge, 2009). DK
BFL
FR
GE1
UK
NL
IRL
yes yes
yes yes2
yes
yes yes
yes
yes yes2
yes
yes yes yes yes6
yes yes yes yes
yes4
yes
yes
yes
yes4 yes4
yes yes
yes yes
yes yes yes yes
Farm measures Fertilizer planning Keeping records Soil analysis Fertilization Closed periods for manure/fertilizers3 Low emission application No manure application on frozen, snow covered and waterlogged land Unfertilised zones along surface water5
yes yes7
Post-harvest measures Catch crops No tillage in autumn
yes4
yes yes
yes yes8
Other Policy Measures Max limit for livestock
yes
Maximum limits on N and P use Manure Total N (manure + fertilizers) Maximum N and P surpluses Maximum soil mineral N in autumn
yes yes
yes yes
yes yes4
yes
yes9
yes
yes yes
yes yes
yes yes
yes yes1
DK = Denmark, BFL = Belgium Flemish Region, FR = France, GE = Germany, UK = United Kingdom, NL = The Netherlands, IRL = Ireland 1 Implementation varies between states (L¨ander) of Germany, e.g. maximum soil mineral N autumn only in Baden Wurtemberg. 2 For NL in case farm has derogation. For BFL from 2013, on fields exceeding the threshold value of maximum soil mineral N in autumn. 3 For liquid manures generally between September/October and February. 4 In some departments within the NVZ’s. E.g. catch crops in western regions (Brittany and Normandy); Anonymous (2008a). 5 With large variation in width and length of unfertilized zones. 6 Increased from 2 m to 10 m from 2012 onwards. 7 No fertilizer within 2 meters of surface water. 8 Ploughing between July and November if green cover emergence of planted crop within 6 weeks of ploughing. 9 In small highly sensitive areas (e.g. coastal areas with green tides).
Biogeosciences, 9, 5143–5160, 2012
www.biogeosciences.net/9/5143/2012/
H. J. M. van Grinsven et al.: Benchmarking the Nitrates Directive in northwestern Europe
5149
Table 7. Overview of area in Nitrate Vulnerable Zones and derogations for grassland (mostly dairy) farms in 2009 (European Commission, 2011). Nitrate Vulnerable Zones area (%) Belgium Flemish Region Walloon Region Denmark France Germany Ireland Netherlands United Kingdom
68 100 422 100 45 100 100 100 39
Application limit for manure (kg N ha−1 )
Share of Agricultural land (%)
Share of farms (%)
12
10
4 0 50 %) explained by a much higher regional estimate of N removal, and to lesser extent by lower estimates of manure input (about 20 %) and chemical fertilizer (about 10 %). Regional data would suggest an overall nitrogen use efficiency (N removal over total N input from fertilizer and manures) of 80 %, which does not seem realistic. Nitrogen use efficiency in Brittany by MITERRA is about 40 %, as compared to 60 % for EU27. For Ireland, total N removal in MITERRA in 2008 is 23 kg N ha−1 lower than the average N removal between 2005 and 2008 in EUROSTAT and national reports. In Ireland 3.9 mln ha of UAA (95 %) is grassland. Mean N removal on grassland is estimated for EUROSTAT at 155 kg N ha−1 , while MITERRA calculates about 130 kg N ha−1 . Part of this difference may be due to different assumptions on reduction of yields and N removal for grazing as compared to cutting, and to different assumptions on shares of intensively and extensively managed grassland. Differences in N removal per hectare between intensive and extensive grassland can amount to a factor of two (Velthof et al., 2009). Another major source of discrepancy for Ireland between MITERRA results and national reporting is a higher gross input of N in manure. In Ireland almost 90 % of N production in manure is from cattle. Irish national reports use an N excretion value of 85 kg N per dairy cow (Anonymous, 2010), while MITERRA uses a value of 105 kg N per dairy cow (Velthof et al., 2011; Annex 1). The high value is based on a more dynamic approach accounting for regional differences in milk yields, grassland yields, and N inputs, while the low value is mainly a function of milk yield. Estimates of N removal for fodder and N excretion are related, as fodder is the major N input and manure N is the major output. For Ireland, N removal in Biogeosciences, 9, 5143–5160, 2012
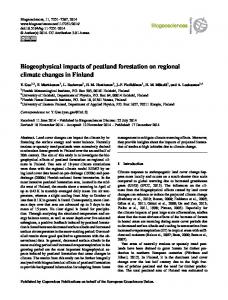
EUROSTAT (and national reports) is more than 30 % higher than N excretion. Even when taking into account N removal in milk and meat and N imports of feed concentrates, the large difference between N removal and N excretion may be an indication that either N removal is overestimated or N excretion is underestimated. On the other hand, excretion estimates by MITERRA do not seem to match with a relatively modest average milk yield in Ireland around 5000 kg per cow per year. Germany is the only country that has established targets for the surplus of N (90 kg ha−1 for 2006–2008) and phosphate (20 kg ha−1 in a six-year average); and managed to achieve these targets in 2008. The stricter targets of 60 kg N ha−1 as a three-year average from 2009–2011 onwards may also be achieved, but some intensive livestock farms and other farms with higher N surplus still have to increase their N efficiency. Infringements of these restrictions are not directly subject to fines, but will lead to administrative procedures with increasing obligations for farmers to adapt to the maximum surplus levels. Recent national census data indicate that since 2008 the use of chemical fertilizer in Denmark, Germany and the Netherlands is still decreasing, and along with that, probably also the soil surplus of nitrogen. The decrease of the purchase of chemical N fertilizer coincides with the increase in fertilizer prices since 2008 (Fig. 9). This price increase is not compensated by an increase of prices of agricultural commodities. Between 1990 and 2011 the price of nitrogen fertilizer in Europe has increased twice as fast as the price of wheat, but since 2007 both prices have become very volatile. In view of the high fertilizer prices farmers may tend to reduce or postpone fertilizer purchases. The latter hypothesis is supported by a decrease of purchase of chemical N fertilizer in Germany in 2009 and 2010. In Denmark and the Netherlands the purchase of N fertilizer was hardly affected, which can be explained by the presence of legal N application standards that are below the economic optimum. So changes of nitrogen use and surpluses since 2008 in part can be price effects which interfere with effects of the NiD. This price effect is more apparent for the use of inorganic phosphate fertilizer which increased since 2009 in all three countries. 4.3
Implications for the NiD
Monitoring and evaluation of the implementation and effects of NiD is crucial for its success. At a national level it is a requirement to maintain support from farmers and their local advisors, as the main actors involved, and for national governments to optimize policies. The main activities for monitoring and evaluation are registrations of farm resources and activities (fertilizer, livestock, UAA), monitoring of water quality and using calculation procedures and models to assess environmental loads and relate this to farm measures and water quality. These evaluation activities take place at the national level, with varying levels of detail and sophistication, www.biogeosciences.net/9/5143/2012/
H. J. M. van Grinsven et al.: Benchmarking the Nitrates Directive in northwestern Europe and in a more harmonized and generalized manner at the European level. For the latter, the European Commission uses institutes like the European Environment Agency (EEA) and the Joint Research Centers (JRC) and has initiated various service contracts, to improve datasets of agricultural activities, and develop and apply models to relate activities to N emissions and water quality (RAINS, GAINS, CAPRI, MITERRA). In spite of recent progress it is difficult to judge to what extent national implementation and evaluation of the NiD benefits from joint activities and what are major caveats in data and knowledge about the effects and effectiveness of the NiD. A typical conclusion from national evaluations is that the1 NiD has made a major contribution to reduction of the N sur-2 plus. Evaluation of the Danish Aquatic Plan II concluded that3 between 1998 and 2004 the reduction of N application stan-4 dards contributed 13 mln kg (32 %) to the total reduction of5 the soil N surplus (SSNB) of 80 mln kg, while increasing le-6 gal FE for N in manure contributed 10 mln kg (26 %) and re-7 duced N in feeding 4 mln kg (10 %) (Mikkelsen et al., 2010).8 Evaluation of the Dutch second action program concluded that between 1998 and 2004 the Mineral Accounting System (MINAS) led to an overall reduction of the net SSNB by 78 mln kg N (van Grinsven et al., 2005). Here the combination of reducing N-loss standards, and more efficient N management by better insight from keeping mineral accounts at farm level, contributed about 100 mln kg (67 %), while reduced N in feeding contributed 14 mln kg (19 %) and reducing livestock and increasing manure export 11 mln kg (14 %). In the Netherlands the dairy sector contributed most to reduction of the use of chemical fertilizer, and this reduction was both a learning effect of applying mineral accountancy at farm level and of enforcement of N-loss standards. In spite of various efforts at the European level to streamline procedures for monitoring and evaluation of the NiD, implementation and insight into the effectiveness still vary considerably. A first logical step is to further harmonize procedures for monitoring water quality and for assessing the nitrogen balance, while recognizing country specific monitoring needs to, for example, show the effectiveness of specific measures in an Action Program (Fraters et al., 2011). Another major source of difference among member states is how manure N is taken into account in recommendations as well as in the regulation of allowable N input. Nitrogen emissions from agricultural sources, particularly manures, are a major source of environmental pollution and welfare loss (Sutton et al., 2011). A logical next step for improving harmonization and effectiveness of the NiD is to demand stricter accounting of nitrogen in manures, e.g. by imposing a compulsory time path for increasing nitrogen fertilizer equivalencies for different types of manures in application limits (Csath´o and Radimszky, 2009). However, such steps require knowledge sharing, e.g. in defining codes of Good Agricultural Practice and adopting techniques to improve nitrogen efficiency in manures. Without that, a too fast and too strict regulation of www.biogeosciences.net/9/5143/2012/
5157
Fig.9.9.Trends Trends 1990 nitrogen and Figure sincesince 1990 of pricesofof prices nitrogenof fertilizer and offertilizer wheat in the EU,ofand trends wheat in the EU, and trends of total use of inorganic nitrogen fertilizer in agriculture in Germany (http://www.bmelv-statistik.de; N statistik.de; N fertilizer use in 1990 was 130 kgN/ha), Denmark (http://www.statbank.dk/; N fertilizer use in 1990 was 130 kg N ha−1 ), Denmark (http://www. fertilizer use in 1990 was 150 kgN/ha) and The Netherlands (http://statline.cbs.nl/StatWeb/; statbank.dk/; N fertilizer use in 1990 was 150 kg N ha−1 ) and the N Netherlands fertilizer use in (http://statline.cbs.nl/StatWeb/; 1990 was 220 kgN/ha) (downloaded October 31, 2012). N fertilizer use in 1990 −1 Note: MacSharry in 1992 and later reduced theNote: price support for cereals wasThe 220 kg N ha reform ) (downloaded 31 reforms October 2012). the MacSharry reform 1992 and later reforms reduced the price support and therefore also theinprice of wheat. for cereals and therefore also the price of wheat. of total use of inorganic nitrogen fertilizer in agriculture in Germany (http://www.bmelv-
nitrogen in manures may decrease the willingness of arable farmers to accept manure from livestock farmers, because of fear of insufficient N supply. In the future, increasing prices of nitrogen fertilizer may provide an additional economic incentive to reduce the use of chemical fertilizer and to increase the efficiency of manures. The NiD and the national implementation of restrictions on where, when and how much nitrogen in fertilizer and manure can be applied to agricultural land, will remain a major instrument to reduce nitrogen pollution in waters. However, we should also recognize that agricultural sources of nitrate are only part of the nitrogen burden. In 2005, diffuse agricultural sources in the EU on average contributed 55 % to the N load to surface waters,48the remainder coming from communal, industrial and natural sources. The agricultural shares for northwest European countries tend to be higher, ranging from 50 to 60 % in the UK, Germany, France and Belgium to 70–85 % in the Netherlands, Denmark and Ireland (inferred from Bouraoui et al., 2011). So even when all the measures under NiD have taken hold, it is unlikely that nitrate concentrations in surface water, and to a lesser extent in groundwater, will return to pre-industrial levels (Howden et al., 2011). For the immediate future the importance of the NiD for protecting drinking water may be best seen in those areas with private or small public drinking water facilities, using groundwater from shallow aquifers, as is the case in Denmark (van Grinsven et al., 2010). In order to protect their coastal waters, member states in deltas or estuaries of large cross boundary rivers, like the Netherlands and Romania, depend on the NiD, particularly when national implementation of the Water Framework Directive is limited to reducing nonagricultural sources of N. A problem when implementing the Biogeosciences, 9, 5143–5160, 2012
5158
H. J. M. van Grinsven et al.: Benchmarking the Nitrates Directive in northwestern Europe
NiD for this purpose is that the limit value of 50 mg L−1 does not apply to fresh waters and coastal waters (Nimmo Smith et al., 2007). Nonetheless, the NiD requires member states to protect such bodies at risk of eutrophication. The lack of a single standard along with the range of influences that bear on eutrophication can cause some confusion. For control of coastal eutrophication, e.g. in Brittany, a limit value around 5–10 mg NO3 L−1 would be more appropriate.
5
Conclusions
The most significant effect of the implementation of the NiD since 1995 in the northwest of the EU is a major contribution to the decrease of the nitrogen soil N balance and by that of the gross N load to the aquatic environment. This effect of the NiD has not yet manifested in a convincing decrease of nitrate concentrations in EU monitoring in groundwater and fresh surface waters since 2000. However, before 2000, introduction of Good Agricultural Practices for fertilization has decreased median and extreme nitrate concentration in many surface water systems in e.g. the Netherlands, Denmark and the Flemish Region. Only countries that operate long running monitoring programs in shallow groundwater in agricultural areas, viz. Denmark and the Netherlands, can detect a convincing decrease of nitrate concentrations. Without good opportunities to evaluate the effectiveness of NiD, it is difficult for the EU community to improve the NiD and implementation in member states may lose momentum. This benchmark study indicates that differences in calculation and data procedures between member states in northwestern EU for determining the nitrogen balances are such that comparison of effects of NiD on the N balance between countries is not yet possible. In particular the calculations methods for N excretion and N removal vary considerably among countries. Regarding compliance with application limit for N in manure also the definition of farm area differs between countries ranging from total farm area to the area where manure actually is applied. Harmonization of the rationale of national fertilizer recommendation systems is important for deriving N application standards that can lead to balanced fertilization, as required by the NiD, and eventually to create a transparent policy debate about balancing economic and environmental goals across the EU. Improved guidelines and procedures for monitoring water quality and registration of fertilizer use also would improve the evaluability of the NiD. Better selections of, and access to the collective monitoring results in EU synthesis reports and data facilities can help to improve the efficiency of our monitoring effort to evaluate the NiD. Implementation of the NiD in member states in the northwest of the EU is fairly comparable regarding restrictions for application of fertilizer and manure, but can be quite different regarding application standards for total N fertilization. Nitrogen application standards in national implementations Biogeosciences, 9, 5143–5160, 2012
of the NiD are closely linked to national nitrogen fertilizer recommendations. However, differences in national systems for nitrogen recommendations are substantial and resulting recommendations for specific combination of crops and soils and do not bear a clear relationship with differences in yield per hectare. At some point in the future, when the first and relatively easy environmental improvements by the present implementations of NiD are achieved, the NiD may need adjustment to become more effective, notably through more specific regulation of nitrogen in manure and through differentiation of targets with respect to water quality. This will also help to achieve the targets set in the Water Frame Work Directive. However, there is an immediate need to improve our data procedures to allow evaluation and benchmarking of adequacy and effectiveness of NiD implementation. Edited by: S. Reis
References Agreste: Bilan azote et phosphore – R´esultats 2010, Minist`ere de l’agriculture, Direction R´egionale de l’agroalimentaire et de la forˆet de Bretagne, Service de Statistique Agricole (Agreste), available at: http://draf.bretagne.agriculture.gouv.fr/ IMG/pdf/44-45 azote phosphore cle4b161d.pdf, 2012. Anonymous: Bilan de la mise en oevre de la Directive Nitrates ´ ´ en France (2004–2007), Minist`ere de l’ Ecologie, de l’ Energie, du D´eveloppement Durable et de l’Amenagement du Territoire, 2008a. Anonymous: Directive Nitrates (91/676), Rapport vise a l’articele 10, Partie I, Bilan et evolution de la qualit´e des eaux et des pratiques agricoles en R´egion Wallonne, Minist`ere de la R´egion Wallonne, Direction G´enerale des Ressources Naturelles en de l’Environnement, 2008b. Anonymous: Article 10 Nitrates Report 91/676/EEC Nitrates Report for Ireland 2004–2007, 2008c. Anonymous: Bericht gem¨aß Artikel 10 der Richtlinie 91/676/EWG des Rates vom 12 Dezember 1991 zum Schutz der Gew¨asser vor Verunreinigungen durch Nitrat aus landwirtschaftlichen Quellen, Mitteilung der Regierung der Bundesrepublik Deutschland, 2008d. Anonymous: Status and trends of aquatic environment and agricultural practice, Danish monitoring and action programmes in accordance with the Nitrates Directive (1991/676/EEC), Preliminary Summary Report to the European Commission, Danish Environmental Protection Agency, 2008e. Anonymous: Statutory Instrument S.I. No. 610 of 2010, Stationary Office, Dublin, Ireland, 2010. Anonymous: Normen en richtwaarden, Vlaamse Landmaatschappij, 2011. Bodemkundige Dienst van Belgi¨e: Wegwijs in de bodemvruchtbaarheid van de Belgische akkerbouw- en weilandpercelen (2008–2011), Heverlee, Belgium, 2012. Bouraoui, F., Grizzetti, B., and Aloe, A.: Long term nutrient loads entering European seas, European Commission Joint Research
www.biogeosciences.net/9/5143/2012/
H. J. M. van Grinsven et al.: Benchmarking the Nitrates Directive in northwestern Europe Centre, Institute for Environment and Sustainability, Ispra, Italy, 2011. Cardoso, A. C., Duchemin, J., Magoarou, P., and Premazzi, G.: Criteria for the identification of freshwaters subject to eutrophication: their use for the implementation of the Nitrates and Urban Waste Water treatment Directives, EUR Report 19810 EN, European Commission Joint Research Centre, Luxembourg, 2001. COMIFER: Calcul de la fertilisation azot´ee: guide m´ethodologique pour l’´etablissement des prescriptions locales, cultures annuelles et prairies Edn. 2011, available at: http://www.comifer.asso.fr/ images/stories/pdf/brochureazotemajmars%202012.pdf, 2011. Coulter, B. S. and Lalor, S. (Eds.): Major and micro nutrient advice for productive agricultural crops, 3rd Ed., Teagasc, Johnstown Castle, Wexford, 2008. Csatho, P. and Radimszky, L.: Two Worlds within EU27: Sharp Contrasts in Organic and Mineral Nitrogen-Phosphorus Use, Nitrogen-Phosphorus Balances, and Soil Phosphorus Status: Widening and Deepening Gap between Western and Central Europe, Comm. Soil Sci. Plant Anal. 40, 999–1019, 2009. Dalgaard, T., Olesen, J. E., Petersen, S. O., Petersen, B. M., Jørgensen, U., Kristensen, T., Hutchings, N. J., Gyldenkærne, S., and Hermansen, J. E.: Developments in greenhouse gas emissions and net energy use in Danish agriculture – How to achieve substantial CO2 reductions?, Environ. Pollut., 159, 3193–3203, 2011. Dalgaard, T., Bienkowski, J. F., Bleeker, A., Drouet, J. L., Durand, P., Dragosits, U., Frumau, A., Hutchings, N. J., Kedziora, A., Magliulo, V., Olesen, J. E., Theobald, M. R., Maury, O., Akkal, N., and Cellier, P.: Farm nitrogen balances in six European agricultural landscapes – a method for farming system assessment, emission hotspot identification, and mitigation measure evaluation, Biogeosciences Discuss., 9, 8859–8904, doi:10.5194/bgd9-8859-2012, 2012. De Clercq, P., Gertsis, A. C., Hofman G., Jarvis, S. C., Neeteson, J. J., and Sinabell, F. (Eds.): Nutrient Management Legislation in European Countries, Wageningen Press, The Netherlands, 2001. de Vries, W., Leip, A., Reinds, G. J., Kros, J., Lesschen, J. P., and Bouwman, A. F.: Comparison of land nitrogen budgets for European agriculture by various modeling approaches, Environ. Pollut., 159, 3254–3268, 2011. DEFRA: Fertiliser Manual (RB209), 8th Edition, United Kingdom, 2010. Desimpelaere, K., Lesage, E., Eppinge, r R., and Van Hoof, K.: Vierjaarlijks verslag in het kader van de Nitraatrichtlijn (91/676/EEG) voor het Vlaams Gewest, Vlaamse Landmaatschappij en Vlaams Milieumaatschappij, 2008. EFMA: Forecast of food, farming and fertilizer use in the European Union 2008–2018. European Fertilizer Manufacturers Association (now Fertilizers Europe), Volume 1, Executive summary and regional data, 2008. EMEP: EMEP Measurement Database. The Co-operative Programme for the Monitoring and Evaluation of the Long-Range Transmission of Air Pollutants in Europe, http://www.emep.int/, 2010. European Commission: Report from the commission to the Council and the European Parliament on implementation of the Council Directive 91/676/EEC concerning the protection of water against pollution caused by nitrates from agricultural sources for the period 2000–2003 SEC(2007)339/COM/2007/0120 final, Brussels,
www.biogeosciences.net/9/5143/2012/
5159
2007. European Commission: Report from the commission to the Council and the European Parliament on implementation of the Council Directive 91/676/EEC concerning the protection of water against pollution caused by nitrates from agricultural sources for the period 2004-2007 SEC(2010)118, COM(2007)47 final/2, Brussels, 2011. Eurostat, Pocketbook: Food from farm to fork, 2011. Eurostat, Nitrogen balance in agriculture (data September 2011), http://epp.eurostat.ec.europa.eu/statistics explained/index.php/ Nitrogen balance in agriculture, 17 January, 2012. Fenton, O., Richards, K. G., Kirwan, L., Khalil, M. I., and Healy, M. G.: Factors affecting nitrate distribution in shallow groundwater under a beef farm in South Eastern Ireland, J. Environ. Manage., 90, 3135–3146, 2009. Fenton, O., Schulte, R. P. O., Jordan, P., Lalor, S. T. J., and Richards, K. G.: Lag time: a methodology for the estimation of vertical and horizontal travel & flushing timescales to nitrate threshold concentrations in Irish aquifers, Environ. Sci. Policy, 14, 419– 431, 2011. Fernal, D. and Murray, A.: UK TAPAS Action Soil Nutrient Balances Final Report, DEFRA, 2009. Fraters, D., Kovar, K., Grant, R., Thorling, L., and Reijs, J. W.: Developments in monitoring the effectiveness of the EU Nitrates Directive Action Programmes, Bilthoven National Institute of Public Health and Environment, 2011. Grant, R., Blicher-Mathiesen, G., Jensen, P.G., Hansen, B., and Thorling, L.: Catchment monitoring 2009 – NOVANA, National Environmental Research Institute (NERI) & Geological Survey for Denmark and Greenland (GEUS), NERI report nr. 802, 2010. Gybels, K., Wustenberghs, H., Claeys, D. Verhaegen, E., Lauwers, L., and Kestemont, B.: Nutrient Balance for Nitrogen, Eurostat Grant Agreement 67101.2006.001-2007.093, Working paper no 22, Statistics Belgium, 2009. Hansen, B., Thorling, L., Dalgaard, T., and Erlandsen, M.: Trend reversal of nitrate in Danish groundwater, a reflection of agricultural practices and nitrogen surpluses since 1950, Environ. Sci. Technol., 45, 228–234, 2011. Hansen, B., Dalgaard, T., Thorling, L., Sørensen, B., and Erlandsen, M.: Regional analysis of groundwater nitrate concentrations and trends in Denmark in regard to agricultural influence, Biogeosciences, 9, 3277–3286, doi:10.5194/bg-9-3277-2012, 2012. Hoekstra, N. J., Lalor, S., Richards, K. G., O’Hea, N., Dungait, J., Schulte, R. P. O., and Schmidt, O.: The fate of slurry N fractions in herbage and soil during two growing seasons following application, Plant Soil, 342, 83–96, 2011. Howden, N. J. K., Burt, T. P. Worrall, F., Whelan, M. J., and Bieroza, M.: Nitrate concentrations and fluxes in the river Thames over 140 years (1868–2008): are increases irreversible?, Hydrol. Process., 24, 2657–2662, 2010. Klimont, Z. and Brink, C.: Modelling of Emissions of Air Pollutants and Greenhouse Gases from Agricultural Sources in Europe, IIASA IR 04-048, Laxenburg, Austria, 2004. Kronvang, B., Andersen, H. E., Børgesen, C., Dalgaard, T., Larsen, S. E., Bøgestrand, J., and Blicher-Mathiasen, G.: Effects of policy measures implemented in Denmark on nitrogen pollution of the aquatic environment, Environ. Sci. Policy, 11, 144–152, 2008.
Biogeosciences, 9, 5143–5160, 2012
5160
H. J. M. van Grinsven et al.: Benchmarking the Nitrates Directive in northwestern Europe
Leip, A., Marchi, G., Koeble, R., Kempen, M., Britz, W., and Li, C.: Linking an economic model for European agriculture with a mechanistic model to estimate nitrogen and carbon losses from arable soils in Europe, Biogeosciences, 5, 73–94, doi:10.5194/bg-5-73-2008, 2008. Lenders S., D’hooghe J., and Overloop S.: Bodembalans van de Vlaamse landbouw, cijfers voor 2007–2009, Departement Landbouw en Visserij and Vlaamse Milieumaatschappij, Brussel, 2012. Lerner, D.: Guidelines for estimating urban loads of nitrogen to groundwater, Defra project report NT 1845, 2000. Lesschen, J. P., Witzke, H. P., Berg, M. van den, Westhoek, H., and Oenema, O.: Greenhouse gas emission profiles of the European livestock sectors, Anim. Feed Sci.Tech., 166–167, 16–28, 2011. Lord, E. and Anthony, S.: MAGPIE: a modelling framework for evaluating nitrate losses at national and catchment scales, Soil Use Manage., 16, 167–174, 2000. Mikkelsen, S. A., Iversen, T. M., Jacobsen, B. H., and Kjoer, S. S.: Reducing nutrient losses from intensive livestock operations, in: Livestock in a changing landscape, experiences and regional perspectives, edited by: Gerber, P., Mooney, H. A., Dijkman, J., Tarawal, S., and De Haan, C., Island Press, Washington, 140– 153, 2010. Nimmo Smith, R. J., Glegg, G. A., Parkinson, R., and Richards, J. P.: Evaluating the Implementation of the Nitrates Directive in Denmark and England using an Actor-Orientated Approach, Eur. Env., 17, 124–144, 2007. OECD: OECD and EUROSTAT Gross nitrogen balances handbook, 2007. Oenema, O.: Governmental policies and measures regulating nitrogen and phosphorus from animal manure in European agriculture, J Anim. Sci., 82, 196–206, 2004. Panten, K., Rogasik, J., Godlinski, F., Funder, U., Greef, J.-M., and Schnug, E.: Gross soil surface nutrient balances: The OECD approach implemented under German conditions, Agr. Forest. Res., 1, 19–28, 2009. Schr¨oder, J. J., Scholefield, D., Cabral, F., and Hofman, G.: The effects of nutrient losses from agriculture on ground and surface water quality: the position of science in developing indicators for regulation, Environ. Sci. Policy, 7, 15–23, 2004. Sutton, M. A., Oenema, O., Erisman, J. W., Leip, A., Grinsven, H. van, and Winiwarter, W.: Too much of a good thing, Nature, 472, 159–161, 2011. ten Berge, H. and van Dijk, W.: Management of nitrogen inputs on farm within the EU regulatory framework, International Fertilizer Society – Publication Proceedings Proceeding 654, available at: http://www.fertiliser-society.org/Content/ Publications.asp, 2009. Tiktak, A., Boesten, J. J. T. I., van der Linden, A. M. A., and Vanclooster, M.: Mapping groundwater vulnerability to pesticide leaching with a process-based metamodel of EuroPEARL, J. Environ. Qual., 35, 1213–1226, 2006.
Biogeosciences, 9, 5143–5160, 2012
van Dijk, W. and ten Berge, H.: Agricultural nitrogen use in selected EU countries: a comparison of N recommendation, and restriction in response to the EU Nitrates Directive, Wageningen Plant Research International B.V., 2009. van Grinsven, H., Eerdt, M., van, Willems, J., Hubeek, F., and Mulleneers, E.: Evaluation of the Dutch manure and fertilizer policy, 1998–2002, in: Evaluating Agri-Environmental Policies: Design, Practice and Results, 398-410, ISBN 92-6401010-6, OECD, 2005. van Grinsven, H., Rabl, A., and de Kok, T. M.: Estimation of incidence and social cost of colon cancer due to nitrate in drinking water in the EU: a tentative cost-benefit assessment cost– benefit assessment, Environ. Health, 9, doi:10.1186/1476-069X9-58, 2010. Velthof, G. L., Oudendag, D., Witzke, H. P., Asman, W. A. H., Klimont, Z., and Oenema, O.: Integrated assessment of nitrogen losses from agriculture in EU-27 using MITERRA, J. Environ. Qual., 38, 402–417, 2009. Velthof, G. L., Lesschen, J. P., Webb, J., Pietrzak, S., Miatkowski, Z., Kros, J., Pinto, M., and Oenema, O.: The impact of the Nitrates Directive on gaseous N emissions Effects of measures in nitrates action programme on gaseous N emissions, Contract ENV.B.1/ETU/2010/0009 http://ec.europa.eu/environment/water/water-nitrates/pdf/ Final report impact Nitrates Directive def.pdf, 2012. Wang, L.,Stuart, M. E., Bloomfield, J. P., Butcher, A. S., Gooddy, D. C., McKenzie, A., Lewis, M. A., and Williams, A. T.: Prediction of the arrival of peak nitrate concentrations at the water table at the regional scale in Great Britain, Hydrol. Process., 26, 226– 239, 2012. Webb, J., Sørensen, P., Velthof, G., Amon, B., Pinto, M., Rodhe, L., Salomon, E., Hutchings, N., Burczyk, P., Menzi, H., and Reid, J. L.: Assessment of the variation of manure N efficiency throughout Europe and an appraisal of means to increase manure N efficiency, Adv. Agron., accepted, 2013. Wolter, R., Osterburg, B., and Tetzlaff, B.: Developments in monitoring the effectiveness of the EU Nitrates Directive Action Programmes: Approach by Germany, in: Developments in monitoring the effectiveness of the EU Nitrates Directive Action Programmes, edited by: Fraters, B., Kovar, K., Grant, R., Thorling, L., and Reijs, J. W., Bilthoven, National Institute of Public Health and Environment, 211–256, 2011. Zwart, M. H., Hooijboer, A. E. J., Fraters, B., Kotte, M., Duin, R. N. M., Daatselaar, C. H. G., Olsthoorn, C. S. M., and Bosma, J. N.: Agricultural practice and water quality in The Netherlands in the 1992–2006 period, National Institute for Public Health and the Environment, Bilthoven, 2008.
www.biogeosciences.net/9/5143/2012/