Steven Bouillon,1,2 Alberto V. Borges,3 Edward CastanËeda-Moya,4 Karen Diele,5. Thorsten Dittmar,6 Norman C. Duke,7 Erik Kristensen,8 Shing Y. Lee,7.
Click Here
GLOBAL BIOGEOCHEMICAL CYCLES, VOL. 22, GB2013, doi:10.1029/2007GB003052, 2008
for
Full Article
Mangrove production and carbon sinks: A revision of global budget estimates Steven Bouillon,1,2 Alberto V. Borges,3 Edward Castan˜eda-Moya,4 Karen Diele,5 Thorsten Dittmar,6 Norman C. Duke,7 Erik Kristensen,8 Shing Y. Lee,7 Cyril Marchand,9 Jack J. Middelburg,2 Victor H. Rivera-Monroy,4 Thomas J. Smith III,10 and Robert R. Twilley4 Received 3 July 2007; revised 9 November 2007; accepted 26 December 2007; published 9 May 2008.
[1] Mangrove forests are highly productive but globally threatened coastal ecosystems,
whose role in the carbon budget of the coastal zone has long been debated. Here we provide a comprehensive synthesis of the available data on carbon fluxes in mangrove ecosystems. A reassessment of global mangrove primary production from the literature results in a conservative estimate of �218 ± 72 Tg C a 1. When using the best available estimates of various carbon sinks (organic carbon export, sediment burial, and mineralization), it appears that >50% of the carbon fixed by mangrove vegetation is unaccounted for. This unaccounted carbon sink is conservatively estimated at �112 ± 85 Tg C a 1, equivalent in magnitude to �30–40% of the global riverine organic carbon input to the coastal zone. Our analysis suggests that mineralization is severely underestimated, and that the majority of carbon export from mangroves to adjacent waters occurs as dissolved inorganic carbon (DIC). CO2 efflux from sediments and creek waters and tidal export of DIC appear to be the major sinks. These processes are quantitatively comparable in magnitude to the unaccounted carbon sink in current budgets, but are not yet adequately constrained with the limited published data available so far. Citation: Bouillon, S., et al. (2008), Mangrove production and carbon sinks: A revision of global budget estimates, Global Biogeochem. Cycles, 22, GB2013, doi:10.1029/2007GB003052.
1. Introduction [2] Mangrove ecosystems thrive along coastlines throughout most of the tropics and subtropics. These intertidal forests play important ecological and socioeconomical roles, e.g., by acting as a nutrient filter between land and sea [e.g., Robertson and Phillips, 1995; Rivera-Monroy et al., 1999], contributing to coastline protection [e.g., Field, 1 Department of Analytical and Environmental Chemistry, Vrije Universiteit Brussel, Brussels, Belgium. 2 Centre for Estuarine and Marine Ecology (NIOO-KNAW), Netherlands Institute of Ecology, Yerseke, Netherlands. 3 Chemical Oceanography Unit, University of Lie`ge, Lie`ge, Belgium. 4 Department of Oceanography and Coastal Science, Wetland Biogeochemistry Institute, Louisiana State University, Baton Rouge, Louisiana, USA. 5 Zentrum fu¨r Marine Tropeno¨kologie, Bremen, Germany. 6 Department of Oceanography, Florida State University, Tallahassee, Florida, USA. 7 Australian Rivers Institute – Coasts and Estuaries, Griffith University Gold Coast, Queensland, Australia. 8 Institute of Biology, University of Southern Denmark, Odense M, Denmark. 9 UR 103, Institut de Recherche pour le De´veloppement (IRD), Noume´a, New-Caledonia. 10 U.S. Geological Survey, Florida Integrated Science Center, St. Petersburg, Florida, USA.
Copyright 2008 by the American Geophysical Union. 0886-6236/08/2007GB003052$12.00
1995; Vermaat and Thampanya, 2006], providing commercial fisheries resources [e.g., Constanza et al., 1997; Barbier, 2000; Diele et al., 2005], and as nursery grounds for coastal fish and crustaceans [Baran and Hambrey, 1998; Ro¨nnba¨ck, 1999; Mumby et al., 2004]. Tropical forests in general are a disproportionately important component in the global carbon cycle, and are thought to represent �30– 40% of the terrestrial net primary production [see Malhi and Grace, 2000; Clark et al., 2001a]. Although the area covered by mangrove forests represents only a small fraction of tropical forests, their position at the terrestrial-ocean interface and potential exchange with coastal waters suggests these forests make a unique contribution to carbon biogeochemistry in coastal ocean [Twilley et al., 1992]. The coastal zone (30° latitudes (4.7 ± 2.1 t ha 1 a 1, n = 16). No significant differences were found between 10 and 20° (9.1 ± 3.4 t ha 1 a 1, n = 47) and 20– 30° (8.8 ± 4.2 t ha 1 a 1, n = 62) latitudes (Figure 2). In order to scale these data to a global litter fall estimate, we assumed a global mangrove cover of 160,000 km2 [FAO, 2003], and a latitudinal distribution similar to that presented by Twilley et al. [1992], i.e., we assumed that the loss of mangrove cover over the past decade was similar in each latitudinal region. This results in a global litter fall estimate of 156 ± 45 Tg a 1, equivalent to 68.4 ± 19.7 Tg C a 1 using a carbon content of 44% (the latter is based on a compilation of literature and our own unpublished data, 2002 – 2006). This estimate is �25 Tg C a 1 lower than the most recent previous estimate [Jennerjahn and Ittekkot, 2002], which is largely due to a different areal extent used (160,000 km2 in this study, versus 200,000 km2 used by Jennerjahn and Ittekkot [2002]). 1 Auxiliary materials are available in the HTML. doi:10.1029/ 2007GB003052.
3 of 12
GB2013
BOUILLON ET AL.: GLOBAL MANGROVE CARBON BUDGETS
GB2013
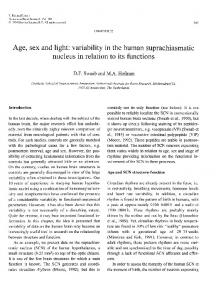
Figure 3. (a) Literature data on wood production plotted as a function of latitude and (b) relationship between litter fall rates and wood production, when simultaneously reported in the same source. [10] Estimates of aboveground wood production are relatively scarce. Twilley et al. [1992] mentioned 11 measures of wood production and estimated the total global wood production at 160 Tg C a 1 (for a global area of 200,000 km2). With 20 additional estimates of wood production (see Table 2 for data and sources), wood production estimates were found to range between 1.1 and 24.1 t ha 1 a 1, with no clear latitudinal trends in the still limited data set (Figure 3a). We compare two different approaches to estimate wood production by mangroves on a global scale: (1) On the basis of the average of all available wood production estimates (10.0 ± 5.6 t ha 1 a 1, n = 31), wood production can be estimated at 66.4 ± 37.3 Tg C a 1 (using a %C of 41.5%, based on a compilation of literature data) and, alternatively, (2) for a selection of these data where concurrent litter fall estimates are also available (Table 2 and Figure 3b), we estimate an average wood/litter production ratio of 1.03 ± 0.54 (n = 23). This ratio, which is within the range reported for other tropical forest ecosystems [Malhi et al., 2004] can subsequently be used to convert global litter fall rates (see above paragraph, this section) to an estimated global wood production of 161 ± 95 Tg a 1, or 66.7 ± 39.6 Tg C a 1. Both estimates are very similar, but significantly lower than the previously mentioned estimate (160 Tg C a 1 [see Twilley et al., 1992]), even when correcting for a 20% decrease in global area of mangroves (128 Tg C a 1) that occurred between the two estimates. It should also be noted that the data on which our extrapolations are based are from studies measuring biomass increments over time, and that this approach does not consider processes such as natural gap formation and regeneration, which can result in significant natural biomass turnover [Duke, 2001]. [11] While belowground roots, pneumatophores and prop roots can form a substantial fraction of the total mangrove biomass [e.g., Komiyama et al., 1987; Mall et al., 1991], estimates of belowground production are even scarcer, which is undoubtedly due to the methodological difficulties involved. Of the four studies that have reported belowground root production estimates [McKee and Faulkner, 2000; Gleason and Ewel, 2002; Sa´nchez, 2005; E. Castan˜edaMoya et al., unpublished data, 2002 – 2006], three were used for further analysis, since the rates presented by Gleason and Ewel [2002] referred only to the top 15 cm. Given the limited number of data (n = 16), we first compared these
root production estimates (all for mixed species assemblages) with concurrently reported litter fall rates, which resulted in a root/litter production ratio (in C equivalents) of 1.20 ± 0.76 (n = 16). Applying this ratio to our global litter fall rate, global root production can be estimated at 82.8 ± 57.7 Tg C a 1. Although this may appear to be high, our estimated root/litter production ratio for mangroves is considerably lower than ratios reported for productive terrestrial forest ecosystems (typically 2.2 – 2.5, see Raich and Nadelhoffer [1989]). This indicates that our root production estimate is likely to be conservative. The partitioning of biomass between belowground and aboveground biomass may also be dependent on nutrient availability, yet the precise impact of nutrient limitation or nutrient additions on belowground allocation and root turnover are not well understood [Nadelhoffer, 2000; Hendricks et al., 2006] and to our knowledge, no studies have assessed such relationships in mangroves. Moreover, it must be stressed that because of the measurement approach (ingrowth of roots), the published root production estimates refer only to fine root production. Although fine roots may not always be the dominant root fraction in terms of biomass (e.g., Komiyama et al. [1987] and Fiala and Hernandez [1993]; depending on how fine roots are defined), they are considered the most active component and may therefore contribute more to NPP than coarse roots [Clark et al., 2001b]. Coarse root production in mangroves has to our knowledge not been measured or estimated separately, and will require careful consideration of methodological issues, given the variety of different root structures formed by various mangrove types (e.g., stilt roots, cable roots, pneumatophores). Production of stilt roots by Rhizophora spp., however, is in most cases included in the existing estimates of wood production, since these are included in allometric relationships to estimate total aboveground biomass [e.g., see Sherman et al., 2003]. [12] When comparing our estimated rates of litter, wood, and (fine) root production, it becomes evident that litter production only amounts to �32% of the total mangrove NPP. A few reports have made a direct comparison of litter fall rates and total NPP, and indeed suggested that litter fall represents �30% of the overall NPP [see Alongi et al., 2005, and references therein]. These estimates match well with our global extrapolations, and hence, indicate that our numbers are realistic and likely to be valid within reason-
4 of 12
BOUILLON ET AL.: GLOBAL MANGROVE CARBON BUDGETS
GB2013
GB2013
Table 2. Synthesis of Wood Production Data (and Litter Fall, if Available) in Mangrovesa Site
Wood Production
Wood/Litter Production
Litter Fall
Reference
0 – 10°S or °N Malaysia Malaysia Phuket (Thailand) Malaysia Java (Indonesia) Java (Indonesia) Java (Indonesia) Java (Indonesia) Java (Indonesia) Kala Oya (Sri Lanka) Kala Oya (Sri Lanka) Erumathivu (Sri Lanka) Erumathivu (Sri Lanka)
11.8 24.1 20 6.7 13.96 13.75 13.75 14.18 14.60 6.76 5.62 4.34 1.40
Puerto Rico Estero Pargo (Mexico) Boca Chica (Mexico) Hainan (China) Dominican Republic Dominican Republic Dominican Republic Laguno de Terminos (Mexico) Laguno de Terminos (Mexico) Laguno de Terminos (Mexico)
3.07 7.72 12.06 11.5 16.3 11.8 6.6 1.96 1.11 1.99
Florida (United States) Fujian (China) Hong Kong Florida (United States) Florida (United States) Shark River, Florida (United States)
13.9 8.69 13.3 7.31 13.33 12.57
Shark River, Florida (United States) Shark River, Florida (United States)
11 8.2 7.37 7.1 8.2 10.4 6.23 5.52 4.41 3.74
0.61 1.70 1.87 1.95 1.72 1.40 1.09 1.02 0.98 0.37
Ong et al. [1979]b Ong et al. [1979]b Christensen [1978]b Putz and Chan [1986] Sukardjo and Yamada [1992] Sukardjo and Yamada [1992] Sukardjo and Yamada [1992] Sukardjo and Yamada [1992] Sukardjo and Yamada [1992] Amarasinghe and Balasubramaniam Amarasinghe and Balasubramaniam Amarasinghe and Balasubramaniam Amarasinghe and Balasubramaniam
[1992] [1992] [1992] [1992]
10 – 20°S or °N 8.34 12.52
0.93 0.96
4.96 3.01 4.14
0.58c 0.58c 0.58c 0.40 0.37 0.48
20 – 30°S or °N 12.2
1.14
6.87
1.94
8.46
1.49
4.01
8.03
0.50
11.90
10.68
1.11
Golley et al. [1962]b Day et al. [1987]b Day et al. [1987]b Lin et al. [1990]b Sherman et al. [2003] Sherman et al. [2003] Sherman et al. [2003] Day et al. [1996] Day et al. [1996] Day et al. [1996] Ross et al. [2001] Lin et al. [1985]b Lee [1990]b Sell [1977]b Sell [1977]b Ewe et al. [2006] and E. Castan˜eda-Moya et al., unpublished data, 2002 – 2006 Ewe et al. [2006] and E. Castan˜eda-Moya et al., unpublished data, 2002 – 2006 Ewe et al. [2006] and E. Castan˜eda-Moya et al., unpublished data, 2002 – 2006
Expressed in t ha 1 a 1. Data are sorted per latitudinal zone. Data previously compiled by Twilley et al. [1992]. c Average value for wood/litter production mentioned by Sherman et al. [2003] for different vegetation types. a
b
able limits. The overall global NPP of mangroves (using an areal extent of 160,000 km2) can therefore be estimated at �218 ± 72 Tg C a 1, using the indirect approach described above for the wood production component. [13] This estimate of NPP should be considered conservative, since (1) coarse root production data are not available and their contribution is therefore not included, (2) we do not account for direct herbivory in this context, although it represents a formal component of NPP (i.e., litter fall rates were not corrected for leaf damage or direct consumption, see further), and (3) a number of other components of NPP such as the exudation of dissolved organic carbon by roots [Clark et al., 2001b] are as yet unknown for any mangrove system.
4. Sinks of Mangrove Production 4.1. Organic Carbon Export [14] Despite the longstanding debate on the role of mangrove forests in exporting organic carbon to the coastal
zone [e.g., Lee, 1995; Jennjerjahn and Ittekkot, 2002; Dittmar et al., 2006], the number of quantitative estimates remains very limited: we only found six and seven estimates for DOC and POC export, respectively, and 11 estimates for total organic carbon export (see Table 3). If the average rates of DOC export (150 ± 134 g C m 2 a 1) and POC export (137 ± 172 g C m 2 a 1) are combined, they are within the range of independent estimates for total organic carbon (TOC) export (252 ± 277 g C m 2 a 1). Scaling these to a global level results in estimated exports of 44.6 ± 30.5 Tg C a 1 and 40.3 ± 44.3 Tg C a 1 based on the sum of DOC (24 ± 21 Tg C a 1) and POC (22 ± 27 Tg C a 1) export estimates or when scaling the TOC export rates, respectively. Although based on a small data set with significant shortcoming, our estimates are within the same range as previous global estimates, which are either partially based on the same data [Twilley et al., 1992] or were derived independently [Jennerjahn and Ittekkot, 2002; Dittmar et al., 2006]. Note that these export estimates only refer to direct export of organic carbon, and do not include move-
5 of 12
BOUILLON ET AL.: GLOBAL MANGROVE CARBON BUDGETS
GB2013
GB2013
Table 3. Summary of Literature Data on Particulate, Dissolved, and Total Organic Carbon (POC, DOC, and TOC) Export From Mangrovesa Site/Country
POC Export
Australia New Zealand Australia Hong Kong Hong Kong Zanzibar (Tanzania) Florida (United States) Brazil Florida (United States) Brazil
420 110 340 2 5 65 16
Florida (United States) Malaysia Florida (United States) Florida (United States) Florida (United States) Australia Australia Australia Papua New Guinea Florida (United States)
DOC Export
230 48 44 56 144
TOC Export
295 64
381 176 186 292 91 332 7 994 343 7.1
a
Data Source Boto and Bunt [1981] Woodroffe [1985] Robertson [1986] Lee [1989] Lee [1990] Machiwa [1999] Twilley [1985] Dittmar and Lara [2001] Romigh et al. [2006] Dittmar and Lara [2001], Dittmar et al. [2006] Davis et al. [2001] Gong and Ong [1990] Heald [1969] Odum and Heald [1972] Lugo and Snedaker [1974] Woodroffe et al. [1988] Boto and Wellington [1988] Alongi et al. [1998] Robertson and Alongi [1995] Sutula et al. [2003]
Adapted from Lee [1995] and updated with more recent data. Fluxes are expressed in g C m
ment of animal biomass dependent on mangrove-derived carbon, which has also been proposed as a potential mechanism for organic matter export [e.g., see Lee, 1995]. 4.2. Burial [15] Three different studies have estimated global organic carbon burial rates in mangrove systems, each using a different approach. Twilley et al. [1992] compiled the available data on organic carbon burial rates, while Jennerjahn and Ittekkot [2002] estimated global carbon burial rates on the basis of a number of assumptions, i.e., (1) that litter fall provides the dominant organic carbon input in the sediments, (2) a global litter fall of 92 Tg C a 1, and (3) that 50% of the litter is exported and 25% mineralized. Duarte et al. [2005], on the basis of the data compiled by Chmura et al. [2003], presented both a bottom-up estimate (i.e., upscaling of carbon burial rates) and an estimate derived from global mangrove community mass balance. Despite the different approaches used, they all result in a very similar estimate at �23 Tg C a 1. Since no significant new data are available, we have scaled this number to the surface area used here (160,000 km2), which results in a global organic carbon burial rate of 18.4 Tg C a 1. Note that none of the literature sources provided an estimate of uncertainty on these global burial rates, hence no error was propagated in further calculations. 4.3. CO2 Efflux as a Proxy for Mineralization [16] Total mineralization in mangrove sediments has typically been estimated through measurements of CO2 fluxes from sediments. Such data are available for a wide range of mangrove systems, and have been measured both under inundated conditions (i.e., as the increase in DIC through time in overlying water during sediment incubations, e.g., Alongi et al. [2004]) and exposed conditions (typically as gaseous CO2 increase through time in a closed
2
a 1.
or flowthrough benthic chamber, e.g., Kristensen and Alongi [2006]). Since the flux rates in our data set were not significantly different between exposed and inundated sediments (p > 0.05 and >0.2 for light and dark conditions), data were pooled for further analysis (Figure 4). Dark fluxes from sediments range between 6 and 241 mmol CO2 m 2 d 1, with an average of 61 ± 46 mmol m 2 d 1 (n = 82). Under light conditions about half of the available flux data show a net CO2 uptake (Figure 4), with an average influx of 15 ± 54 mmol m 2 d 1 (n = 14). These lower CO2 fluxes result from CO2 uptake during photosynthesis by benthic
Figure 4. Boxplot compilation of available data on CO2 fluxes from mangrove sediments (exposed and inundated, under dark and light conditions) and from the water column in mangrove-surrounding waters. Positive fluxes correspond to a CO2 efflux, negative fluxes indicate net CO2 uptake. Full data and data sources are presented by Kristensen et al. [2008].
6 of 12
GB2013
BOUILLON ET AL.: GLOBAL MANGROVE CARBON BUDGETS
GB2013
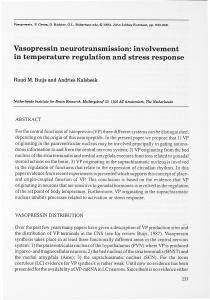
Figure 5. Synthesis of current literature estimates of the fate of mangrove production and a comparison with our estimates of total NPP. Asterisk in Figure 5, bottom, indicates no error estimate reported for organic carbon burial rates. primary producers and should therefore not be taken into account since we are interested in assessing mineralization of mangrove-derived organic matter. Moreover, this light flux is based on a very limited data set and should be used with caution given the extreme variability in these data. [17] Mangrove creek waters have consistently been found to show high CO2 oversaturation, and hence, are a net source of CO2 to the atmosphere, with average CO2 flux estimates for a given system generally >20 mmol m 2 d 1 [Borges et al., 2003]. We compiled 21 estimates on waterair CO2 fluxes (see Table S2) with an overall average of 59 ± 52 mmol m 2 d 1. For most of these data, CO2 fluxes were estimated on the basis of water column pCO2 and gas transfer velocities estimated from field wind speed measurements (see Borges et al [2003] for discussion). [18] It must be stressed that these sediment and water column estimates relate only to net CO2 fluxes, and not to overall mineralization rates (see discussion below, section 5.1). Upscaling CO2 fluxes for sediments and the water column separately is somewhat problematic, since the surface areas to be used are not static in these intertidal systems. However, given the similar magnitude in CO2 efflux from both sediments in the dark and water column, we estimated the overall CO2 efflux from mangrove systems to be in the order of �60 ± 45 mmol m 2 d 1. This results in a global estimate of 42 ± 31 Tg C a 1.
5. Gaps in the Carbon Budget [19] All the abovementioned estimates of organic carbon sinks (export, burial, and CO2 efflux) together only accounted for �45% of the estimated NPP (Figure 5), thus
leaving a surprisingly large part of the mangrove production unaccounted for (112 ± 85 Tg C a 1, which is equivalent in magnitude to �30 – 40% of the global riverine flux of organic carbon). Assuming that mangrove forests are in equilibrium and are currently not showing net biomass accumulation, this implies that either some sink components of the global mangrove C budget are severely underestimated, and/or that some quantitatively important pathways for mangrove-derived organic matter removal have been overlooked in previous budget studies. Although we must stress that the existing literature does not provide sufficient data to fill this gap, a closer look at several mechanisms and processes may explain and solve part of this discrepancy. In particular, the potential importance of export of mangrove carbon as dissolved inorganic carbon (DIC), the emission of CO2 from sediments via burrows and along pneumatophores, and the consumption and respiration of organic matter by faunal communities will be discussed below, sections 5.1 and 5.2. 5.1. Mineralization and Export of Inorganic Carbon [20] Mineralization is generally considered to be a major fate of plant production in coastal ecosystems [Duarte and Cebria´n, 1996]. However, when based on sediment CO2 fluxes, benthic mineralization only represents �15% of the total mangrove NPP. For a number of reasons, however, these CO2 emission rates are unlikely to serve as appropriate proxies for mineralization: [21] 1. Core incubations typically use sediments which are free of pneumatophores and crab burrows. Recent data, however, indicate that these structures are important as vectors for enhancing CO2 exchange, and add considerably
7 of 12
GB2013
BOUILLON ET AL.: GLOBAL MANGROVE CARBON BUDGETS
Figure 6. Examples of differences in DIC (gray symbols) and DOC (open symbols) inputs in mangrove creeks. (a) Nonconservative distributions of DIC and DOC in a tidal mangrove creek at Mtoni, Tanzania (S. Bouillon and A.V. Borges, unpublished data, 2005); note the different scales on the y axes. (b) Tidal variations in DIC and DOC in a mangrove creek in Ras Dege, Tanzania [Bouillon et al., 2007c]. Arrows in Figure 6, top, indicate the amount of ‘‘excess’’ DIC and DOC; in Figure 6, bottom, arrows indicate the range of variations in DIC and DOC.
to the total CO2 flux from the sediment [Kristensen et al., 2008]. Crab burrows can be very complex, abundant, and deep structures, and thus greatly enhance the surface area of the sediment-air or sediment water interface where exchange of CO2 or DIC can take place [Thongtham and Kristensen, 2003]. Similarly, CO2 emission rates were found to be greatly enhanced when Sonneratia or Avicennia pneumatophores were included in the measurements, with CO2 emission rates equivalent to 0.2 –0.7 mmol CO2 d 1 per individual pneumatophore (E. Kristensen, unpublished data, 2005). [22] 2. An unknown part of CO2 released from pneumatophores and rooted sediments might represent plant respiration rather than heterotrophic respiration (i.e., mineralization). Since our mangrove carbon budget is based on net primary production, the CO2 release due to autotrophic respiration should not be included, but there are currently insufficient
GB2013
data to estimate this contribution [Lovelock et al., 2006]. This stresses the need for novel methodological approaches that allow quantitative estimates of the partitioning of measured CO2 fluxes between autotrophic and heterotrophic respiration. [23] 3. Lateral transport of DIC resulting from mineralization via pore water drainage is not taken into account using the standard approach used to estimate sediment mineralization: the latter is based on the assumption that efflux of carbon dioxide equates with depth-integrated mineralization. Mangrove pore waters are typically rich in total alkalinity and DIC [e.g., Ovalle et al., 1990; Bouillon et al., 2007a], indicating that buildup of inorganic carbon resulting from mineralization occurs. Lateral transport of DIC-enriched mangrove pore water to creeks thus results in an underestimation of mineralization rates if based on sediment-water carbon dioxide effluxes only. The impact of mineralization in intertidal sediments and subsequent lateral transfer on the DIC dynamics in mangrove creeks has been demonstrated in a number of studies [e.g., Ovalle et al., 1990; Borges et al., 2003; Bouillon et al., 2007c]. [24] In order to assess the potential magnitude of lateral CO2 transport, we evaluated the water column concentrations of DIC and DOC along the salinity gradient in a number of mangrove systems. Because of lateral inputs into creek waters, DIC and DOC typically show a nonconservative pattern in the mangrove creek water column (see Figure 6). The relative amounts of ‘‘excess’’ DIC and DOC (DDIC and DDOC) can thus be considered proportional to their relative export rates, on the condition that the tidal variations in both parameters are similar, so that their overall relative fluxes are not influenced by the variations in flow rates during the tidal cycle [e.g., Dittmar and Lara, 2001]. We compiled data from several mangrove creeks in different regions (see Table 4), and calculated the amount of excess DOC and DIC for each of these data sets. This was based either on deviations from conservative mixing scenarios, or by comparing the amounts of DIC and DOC relative to reference concentrations at the outer boundary, i.e., where lowest DIC and DOC concentrations were found (see Figure 6). Although such data sets are only available from a limited number of sites (n = 5), the resulting calculations consistently show that DDIC exceeds DDOC, by a factor of �3 – 10 (Table 4). Under the assumption that
Table 4. Overview of Ratios of Excess DIC to Excess DOC (DDIC/DDOC) in Different Mangrove Creeksa DDIC/DDOC Stdev Ca Mau (Vietnam)
6.6
2.9
Gazi (Kenya) Ras Dege (Tanzania) Mtoni (Tanzania)
8.3 10.5 8.8
5.1 2.0 6.7
Gaderu (India)
3.0
1.2
a
n
Source
26 S. Bouillon and A. V. Borges, unpublished data, 2005 24 Bouillon et al. [2007b] 17 Bouillon et al. [2007c] 19 S. Bouillon and A. V. Borges, unpublished data, 2005 13 Bouillon et al. [2003]
The n represents the number of data between end-members for each system for which ratios of excess DIC to excess DOC (DDIC/DDOC) could be determined. See text for details.
8 of 12
GB2013
BOUILLON ET AL.: GLOBAL MANGROVE CARBON BUDGETS
GB2013
both originate mainly from the tidal exchange and therefore follow the same tidal variations [e.g., Bouillon et al., 2007c], this implies that DIC export should exceed DOC export to the same degree. Assuming a global DOC export rate in the order of 24 ± 21 Tg C a 1 (see above, section 4.1), and using the available data on DDIC/DDOC ratios, tidal DIC export would represent 178 ± 165 Tg C a 1. Other processes may obviously affect DIC and DOC pools after their export from the system boundaries (e.g., CO2 efflux, mineralization or photodegradation of DOC), but data to assess this further are currently not available. It must be noted that the estimated tidal DIC export in principle includes the cumulated DIC released from mangrove sediments during tidal inundation, DIC released from permanently inundated sediments, and DIC from organic carbon degradation in the mangrove creek waters (which has seldom been measured). However, it does not include the sediment CO2 emission during exposure or CO2 exchange between the water column and atmosphere. Thus, although there are insufficient data to fully constrain CO2 emission from sediments and tidal DIC export, our analysis clearly illustrates that sediment mineralization is likely to be much higher than suggested by standard CO2 flux measurements alone. We thus suggest that a much larger fraction of mangrove production than previously anticipated may be mineralized and either emitted directly to the atmosphere, or exported as DIC to adjacent waters.
river flow) on litter dynamics vary substantially among different mangrove settings [Twilley et al., 1997]. [27] Quantitative estimates of carbon processing by the entire faunal community are scarce: the only detailed estimate available is that by Koch and Wolff [2002], who studied the energy balance of key species of epifauna in a Brazilian mangrove forest. For the high intertidal site in their study (where Ucides cordatus, a crab species known to feed substantially on mangrove material, was dominant), secondary production and respiration of key faunal species indicate a total assimilation rate equivalent to 15– 20 mmol C m 2 d 1. Even for individual species, the few data available confirm the substantial role of mangrove fauna. Thus, Thongtham and Kristensen [2005] found that the assimilation (i.e., production + respiration) of the sesarmid crab Neoepisesarma versicolor at a density of 5 ind. m 2 is equivalent to �40– 60 mmol C m 2 d 1 in a Thai mangrove forest. When taking into account that faunal communities rely only partially on mangrove-derived carbon, these numbers stress the potential role of faunal production and respiration for the mangrove carbon budget. Reliable quantitative extrapolations on a global scale, however, require substantial research efforts to provide a broader database on the faunal impact.
5.2. Secondary Production and Respiration by Fauna [ 25 ] Although NPP formally includes biomass lost through direct feeding [Clark et al., 2001b], we did not include this component in our budget estimates. The generally low levels of direct herbivory (typically