307
The Journal of Experimental Biology 205, 307–320 (2002) Printed in Great Britain © The Company of Biologists Limited 2002 JEB3800
Implanted electrode recordings from a praying mantis auditory interneuron during flying bat attacks Jeffrey D. Triblehorn* and David D. Yager Department of Psychology, University of Maryland, College Park, MD 20742-4411, USA *e-mail:
[email protected]
Accepted 14 November 2001 Summary Using an implanted electrode, we recorded the cessation of 501-T3 activity is probably due both to the responses from the ultrasound-sensitive mantis increasing PRR and to the decreasing pulse duration that interneuron 501-T3 during flying bat attacks in a large occur in the terminal buzz phase of a bat attack. 501-T3 flight room where the mantis served as the target. 501-T3 may be actively shut off at high PRRs and/or intensities to responds to each vocalization emitted with multi-spike protect the interneuron from habituation while the mantis bursts when pulse repetition rates (PRRs) are below performs an escape response. The cessation of 501-T3 55 pulses s–1. As PRR increases and pulse durations fall activity is consistent with the lack of a very late below 3 ms, 501-T3 ceases burst activity. On average, ultrasound-mediated evasive response by the mantis. spike bursts cease 272 ms before contact (when the bat is However, cessation of 501-T3 activity may allow a true 73 cm away from the preparation). The timing of cessation ‘last-chance’ response to be mediated by other neural of activity in 501-T3 is similar to the latency for the systems. diving portion of the response of the mantid (242 ms). Experiments using vocalizing stationary bats confirm that Key words: audition, defence, behaviour, Dictyoptera, echolocation, insect, hearing, Parasphendale affinis, mantid, Mantodea, 501-T3 responds more reliably to longer pulse durations neuroethology, neurophysiology. (⭓3 ms) when intensities are below 90 dB pe SPL. The
Introduction Echolocating insectivorous bats pose a threat to insects flying at night. Many insects possess tympanate auditory systems sensitive to the ultrasonic frequencies used by these hunting bats (for reviews, see Hoy, 1998; Yager, 1999; Stumpner and von Helversen, 2001). Upon detection of ultrasonic bat vocalizations, these insects usually perform some evasive maneuver effective in eluding their bat predators. Evasive behaviors range from the simple (such as ceasing flight and dropping) to the complex (sharp turns and power dives). The timing of the response can be critical since beginning an escape response too early or too late could decrease its effectiveness. In addition, an insect species may exhibit multiple behaviors dependent on the intensity of the threat. For example, a moth will turn away from the direction of a bat that is far away but will fly erratically when the bat is close (Roeder, 1967). Some moths and tiger beetles even produce ultrasonic clicks when bats are close (Dunning, 1968; Acharya and Fenton, 1992; Yager and Spangler, 1997). Similarly, mantids will turn when a bat is far away but will enter a power dive when the bat is close (Yager et al., 1990). Therefore, it is important that insects use relevant cues produced by the bat to assess the level of danger and perform the appropriate response at the optimal time on the basis of this assessment. Bat vocalizations contain several cues that insects could use
to determine their distance from a bat. One cue is sound intensity, but this can be ambiguous. A bat may lower the intensity of its vocalization as it approaches a prey item (Surlykke and Moss, 2000). Therefore, a single intensity may represent a bat that is farther away and making loud vocalizations or a bat that is much closer but vocalizing at a lower intensity (Fullard, 1984). A bat also changes the emission rate of its vocalizations (referred to as pulse repetition rate or PRR) as it searches for and tries to capture an insect. These changes are divided into the search phase, the approach phase and the terminal buzz phase (comprising buzz I and buzz II) (Kalko, 1995; Surlykke and Moss, 2000). The vocalization pulses decrease in duration and increase in repetition rate in each successive phase. The increase in PRR provides more information to the bat about the location of the target and the decrease in pulse duration may prevent echo overlap (Schnitzler et al., 1980; Simmons and Grinnell, 1980; Kalko, 1995). Both PRR and pulse duration may indicate how close a bat is to capturing the insect. Finally, there are changes in the frequency-modulated (FM) sweeps that comprise the individual vocalizations of many bat species. As a bat approaches a target, there is a decrease in the beginning and ending frequencies of the FM sweeps as well as in the bandwidth.
308
J. D. Triblehorn and D. D. Yager
Frequency changes are probably not very useful to most insects. Many ultrasound-sensitive interneurons are broadly tuned (Nolen and Hoy, 1987; Faure and Hoy, 2000a; Triblehorn and Yager, 2001) and may not be sensitive to the changes in frequency content in emitted pulses. Pulse duration may also not be a very useful cue to insects. Although bat pulses decrease predictably in duration as a bat approaches and attempts to capture a target, insect auditory systems are also less sensitive to these shorter pulses (Tougaard, 1999; Faure and Hoy, 2000a). As a result, these shorter bat pulses may not activate the insect auditory system strongly enough to elicit an evasive response. Although pulse duration may be important, PRR may be the most reliable cue for the insect to assess the level of danger posed by the bat. In the arctiid moth Cycnia tenera, Fullard (1984) found that the lowest thresholds able to elicit ultrasonic clicking behavior occurred at 30–50 pulses s–1, similar to PRRs in the beginning of the terminal buzz phase. Playback experiments using a recorded Eptesicus fuscus attack vocalization sequence (approach and terminal buzz phases) confirmed that C. tenera does not produce clicks until the terminal buzz phase, suggesting that PRR is a cue for the initiation of clicking behavior (Fullard et al., 1994). Fullard (1984) also found that the number of tympanal nerve spikes elicited per pulse decreased with increasing PRR. Sound intensity and pulse duration can also interact to influence the auditory system’s ability to follow PRRs. In katydids, the ultrasound-sensitive T-cell encodes at least 50 % of the pulses in a stimulus train using 40 kHz tones up to 70 pulses s–1 for loud tones (90 dB SPL), but performance decreases with decreasing intensity (42 pulses s–1 at 70 dB SPL, 24 pulses s–1 at 50 dB SPL) (Faure and Hoy, 2000a). The T-cell follows a pulse train mimicking a bat stimulus (10 ms pulse duration, 14.25 pulses s–1) better than one mimicking a conspecific song (30 ms pulse duration, 14.25 pulses s–1) (Faure and Hoy, 2000b). The praying mantis possesses a single ear located on the ventral surface between the metathoracic legs (Yager and Hoy, 1987). Most species with auditory ability hear best within the range 30–50 kHz, but some species (termed broadly tuned species) are equally sensitive to higher frequencies (Triblehorn and Yager, 2001). A praying mantis typically responds to ultrasound during flight by dorsiflexing its abdomen, extending its forelegs, rolling its head and changing its wing-beat phase and frequency. In free flight, this produces evasive maneuvers ranging from random turns to power dives, depending on stimulus strength, that are effective in evading capture by bats (Yager et al., 1990). Mantids have several mirror-image pairs of auditory interneurons; auditory interneuron 501-T3 has been most extensively characterized (Yager and Hoy, 1989). It is a broadly tuned interneuron sensitive to the ultrasonic frequencies used by echolocating bats. Its tuning is similar to the audiograms of other bat-avoiding insects. 501-T3 probably receives direct input from the auditory afferents, and it has a large axon (17 µm in diameter) with a short
latency for action potentials to reach the prothorax (8–12 ms) and a high conduction velocity (4 m s–1) (Yager and Hoy, 1989). These characteristics make it highly probable that 501-T3 has a role in initiating the evasive response of the mantis. In the present experiment, we examined the neural responses of 501-T3 to echolocation vocalizations emitted by a free-flying bat in a large flight room. Other studies have examined the responses of physiological insect preparations to real bat vocalizations, but their focus was to determine either whether gleaning bats could be detected (Faure et al., 1993; Faure and Barclay, 1994) or to measure insect batdetection distances (Fullard and Thomas, 1981; Schul et al., 2000). Many of these studies also focused on auditory responses to bat search calls not necessarily directed at the physiological preparation. Our study is unique since it focuses on the responses to bat approach and terminal buzz vocalizations during a capture attempt. A chronically implanted electrode allowed us to record the neural responses from a suspended mantis that served as the capture target for the free-flying bat. Since bat vocalizations emitted during attack sequences in the flight room are similar to those in the field and the preparation was the target of the attack (and thus the vocalizations), this paradigm provides the most accurate information to date to address how an insect auditory system responds to changes in bat vocalizations during capture attempts in the field. Materials and methods Animals We tested male Parasphendale affinis (Beier, 1968) (Mantidae; Mantinae; Miomantini) 7–21 days after their molt to adulthood. The mantids were raised in our colony maintained at 25–30 °C and 30–50 % relative humidity with a 14 h day length. All mantids were housed individually as adults and fed flies twice a week. We used three bats (Eptesicus fuscus) in these experiments (one male and one female for the bat attack experiments and a different male for the stationary bat vocalization experiments). The two males came from a cave in Ontario, Canada, captured in March 2000, and the female came from District Heights, MD, USA, captured in June 2000. The bats used for bat attack experiments were trained to capture tethered mealworms and were experienced in capturing freeflying mantids in the flight room (described below). The bat used for the stationary bat vocalization experiment was trained to echolocate while sitting on a platform for use in echolocation experiments. Neurophysiology Clip electrodes We recorded neural responses using a single clip electrode similar to that described by Ye et al. (1995). The clip electrode consists of a 25 µm diameter formvar-insulated nichrome wire (A-M systems) embedded in 2-ton epoxy (Devcon).
Mantis auditory interneuron responses during bat attacks
309
Door
Bat release point X
Mantis Calibrated space
Closet Camera 1
Camera 2
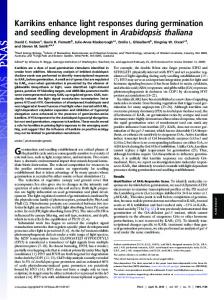
Fig. 2. Diagram of the flight room (6.4 m×7.3 m×2.5 m) and the experimental arrangement for the bat attack experiments. The gray box represents the calibration space for the high-speed video cameras (2.2 m×1.9 m×1.6 m). The dashed lines illustrate the two typical flight path types for the bat attacks (direct approach, blue line; indirect approach, red line).
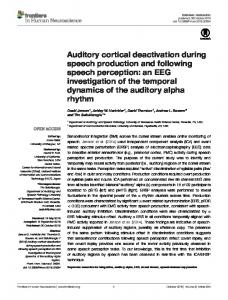
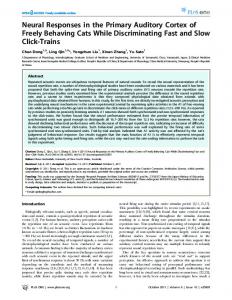
mantis in a horizontal position during the experiment. Fig. 1 shows the tethered preparation. Although the agar kept the electrodes in place, it was weak enough for the electrodes to slip out when the bat grabbed the mantis during an attack. In no case did the electrodes remain in the preparation as the bat grabbed the mantis and there was, therefore, no danger of the bat consuming the electrodes. Fig. 1. The implanted electrode arrangement in the hanging tethered mantis preparation. Scale bar, 10 mm. The right-hand wire holds the clip electrode and the connective, the middle wire holds the indifferent lead and the left-hand wire stabilizes the mantis in a ‘flight-like’ posture.
Implantation Each mantis was chilled slightly until immobile. The legs and wings of the mantis were removed before fixing it ventralside up using wax. After removing a rectangular portion of the ventral cuticle between the prothoracic and metathoracic legs, the clip was inserted into the mantis body cavity and the connective was placed inside. Care was taken not to damage the tracheal system. We replaced the cuticle and applied agar (Fisher Science) to help keep the electrode in place. The connectives were cut just posterior to the prothoracic ganglion (to eliminate large-amplitude visual units from our recordings) and between ganglia A1 and A2 (to eliminate large-amplitude units from the wind-sensitive cercal system). A second single nichrome wire (not a clip electrode) was inserted dorsally into the prothoracic body cavity to serve as an indifferent electrode. A third, non-recording wire was also placed dorsally in the tip of the abdomen to provide additional support and relieve stress on the two recording wires. Agar was also applied at the insertion site of these two wires and at the dorsal and ventral sides of the abdomen. The three wires were soldered to gold connectors attached to 36-gauge braid-shielded stereo wire (Belden). The agar and the non-recording wire helped hold the
Flight room All experiments were conducted in a carpeted flight room (6.4 m×7.3 m×2.5 m) at the University of Maryland, College Park, under low light levels. The ceilings and walls were lined with acoustic foam (Sonex I, Illbruck, USA). During bat attack experiments, we recorded the bats’ flight and capture behavior on two synchronized high-speed video recorders (Kodak MotionCorders) at 240 frames s–1. A 25-point calibration frame (2.2 m×1.9 m×1.6 m; Peak Performance Technologies) placed in the center of the room was filmed in both camera views. The three-dimensional positions of the bat and the mantis preparation (as well as the distance between them) were analyzed using these images and commercial motion-analysis software (Motus, Peak Performance Technologies). The preparation was placed within the calibration frame, 50 cm offcenter towards the cameras. Fig. 2 shows a diagram of the flight room arrangement. Bat attack experiments The tethered mantis with electrode was hung 90–100 cm from the ceiling in the center of the flight room by alligator clips attached to shielded coaxial cable that carried neural signals to the amplifier (A-M Systems, model 1700). The bat was placed on a platform 1.5 m high, 3.37 m away from the hanging preparation. An Ultrasound Advice microphone positioned below the mantis preparation (30 cm above the floor, 175 cm below the mantis) recorded the bat vocalizations
310
J. D. Triblehorn and D. D. Yager
for frequency and timing information (see Sound recordings section). A bat detector (Pettersson, model 100) was also placed at the site of the microphone. A four-channel DAT (Sony PCM-R500) stored the amplified neural signals, the bat detector output, the synchronization pulses from the video system and the trigger signal to stop the video and sound recording systems after digitization (BioLogic DRA-400) for off-line analysis. In some trials, the bat struck the tether, but the electrodes remained in the preparation. In these cases (four cases), another trial was acquired if 501-T3 still responded to ultrasound and the recording quality was still good. Stationary bat vocalization experiments To examine how the mantis auditory system responds to real bat vocalizations of different intensities and durations, chronic electrodes recorded auditory responses to a stationary bat vocalizing while on a platform at different distances from the mantis preparation. The electrode implantation procedure was the same for the static bat vocalization experiments except that we substituted superglue (CrazyGlue) for agar to keep the electrodes in place, but agar was still applied on the abdomen to help maintain a horizontal posture. The tethered mantis was placed in the corner of the flight room, attached to the ceiling in the same manner as for the bat attack experiments. A Brüel & Kjaer 2231 sound level meter with a 4135 6.25 mm microphone (protective grid off) mounted slightly below (microphone centered approximately 4 mm below) and behind (approximately 4–5 mm) the preparation’s ear recorded bat vocalizations. This microphone is highly sensitive to direction and, because of its close proximity to the mantis ear, provided an accurate measurement of the vocalizations acting on the mantis ear. The bat sat on a movable platform placed, at 1 m increments, 1–6 m away from the preparation in random order. We recorded data in 4 s blocks and attempted to capture only the loudest calls at a given distance (since these calls indicated that the bat’s head was aimed at the preparation). The same DAT recorder stored the neural responses and trigger signal used to stop the sound recording system. Sound recordings The output from the Ultrasound Advice or Brüel & Kjaer microphone was bandpass-filtered (10–100 kHz) and amplified using a Stewart Electronics (model VBF 44) filter (–110 dB at 1.5fc). An IoTech 512 Wavebook controlled by a Dell Inspiron laptop computer directly digitized the signals at 240 kHz during the bat attack experiments and at 250 kHz for the stationary bat vocalization experiments. We used a MATLAB-based program developed by Aaron Schurger (in the laboratory of Dr Cynthia Moss) to analyze bat vocalizations from the bat attack experiments. This program provided the start and stop times and frequencies for the vocalizations as well as the peak frequency and relative amplitude. For the stationary bat vocalization experiments, we used Superscope II (GW instruments) on a Macintosh G4 computer to measure the amplitude and duration of the
vocalizations. We converted amplitudes to peak equivalent dB SPL (dB pe SPL) (Stapells et al., 1982) by comparing the peak-to-peak amplitudes of the bat vocalizations with the amplitudes of 25 kHz pure tones of known sound pressure level (SPL) [based on maximum root mean square (RMS) in 1 s intervals using the Brüel & Kjaer 2231 sound level meter]. The calibration tones were 300 ms in duration with a 10 ms rise/fall time. We recorded calibration tones in the flight room using the same sound recording procedures as for the stationary vocalization experiments. Data analysis For both experiments, we analyzed neural signals stored on DAT using Superscope II after digitization (instruNet, model 100B) on a Macintosh G3 computer. Means and standard deviations are reported unless indicated otherwise. Statistical tests were conducted using InStat 2.02a (GraphPad Software, Inc). The Student’s t-test was used in cases of equal variances; in other cases, we used the nonparametric Mann–Whitney U-test. The significance level for all statistical tests was 0.05. Table 1. Summary of bat vocalization parameters for the three phases of the bat attack (18 trials, 14 mantis preparations) Approach
Buzz I
Buzz II
Phase begins (ms before contact) Mean S.D. Minimum Maximum
1162.5 216.3 867 1820
458.3 104.9 305 672
219.4 30 185 283
Phase begins (cm before contact) Mean S.D. Minimum Maximum
– – – –
128.3 37.6 81 204
61.8 10.5 47 85
Phase duration (ms) Mean S.D. Minimum Maximum
704.2 223.6 366 1258
229.8 93.7 66 355
167 42.4 93 228
Peak frequency of vocalizations (kHz) Mean S.D.
38.2 5.3
30.1 1
24.9 1.1
Pulse repetition rate (pulses s–1) Mean S.D. Minimum Maximum
12.9 1.3 10.4 15.5
46.7 10 29.2 66.8
130.1 14.7 100 147.4
Pulse duration (ms) Mean S.D.
3.8 0.3
2.7 0.37
1.3 0.3
Sweep rate (kHz ms–1) Mean S.D.
12.4 1
17.9 1.5
24.7 2.7
Mantis auditory interneuron responses during bat attacks
311
60
Begin frequency
40 20
End frequency
6 5 4 3 2 1 0 –1.2 –1 –0.8 –0.6 –0.4 –0.2 0 Time to contact (s)
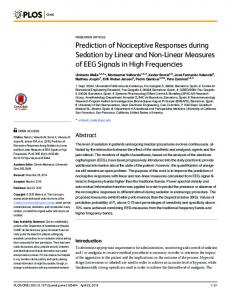
Results The bat attack results presented here come from 18 trials (14 different mantis preparations) in which the bat made contact with the mantis or the tether just above the mantis at the end of the attack sequence. Bat vocalization behavior The bats vary their vocalizations as they navigate around the room and as they approach and attempt to capture the mantis neural preparation (Fig. 3). PRR increases, while pulse duration decreases. The bandwidth of the vocalizations decreases (based on the beginning and ending frequencies of the vocalizations) and the sweep rate increases. The peak frequencies and relative amplitude also change. In the present experiment, the attack sequence is divided into three phases: stable approach, buzz I and buzz II (Fig. 3). Bats do not produce search-type vocalizations within the flight room (Surlykke and Moss, 2000). We defined the beginning of the stable approach phase as the time when the bat reached a stable vocalization PRR after leaving the platform. We took the start of the buzz I phase as the time when the bat increased its PRR above 20 pulses s–1 as it neared the target and the start of the buzz II phase as the time when the PRR reached 100 pulses s–1 and once again stabilized at this high PRR. PRR changed the most during the buzz I phase. Fig. 2 illustrates the flight room arrangement and the two types of path that the bat used when attacking the mantis. The majority of the trials (lasting between 1200 and 1600 ms)
60 50 40 30 20 10 0 60 50 40 30 20 10 0
Relative amplitude (V2)
Pulse duration (ms)
PRR (Hz)
0 180 150 120 90 60 30 0
Sweep rate (kHz ms–1)
Frequency (kHz)
80
Peak frequency (kHz)
Buzz I
Fig. 3. Example of the changes in different bat vocalization parameters during an attack sequence from one trial. The shaded areas mark the beginning and end of the approach, buzz I and buzz II phases. In the approach phase, pulse repetition rate (PRR) is consistent, pulse durations are over 3 ms and the bandwidth of the echolocation vocalizations is broad (based on the beginning and end frequencies). In the buzz I phase, PRR increases and pulse duration decreases. In the buzz II phase, PRR is over 100 pulses s–1, pulse duration continues to decrease, the sweep rate increases and the bandwidth of the echolocation vocalizations narrow. In the beginning of the buzz II phase, the relative amplitude of the echolocation vocalizations increases (probably as a result of the bat approaching the microphone located near the mantis target), but the relative amplitude drops in the second half of the buzz II phase (approximately 100 ms before contact).
0.2 0.4
Approach
Buzz II
30 20 10 0 –10 –1.2 –1 –0.8 –0.6 –0.4 –0.2 0 Time to contact (s)
0.2 0.4
consisted of the bat leaving the platform and flying directly towards the target. For longer trials (in which the bat flew around the room), we reduced the analysis to the point in the trial when the bat began its attack on the target (on the basis of the stable approach phase definition). Table 1 provides a summary of the bat vocalization parameters (see also Bat vocalization behavior section in the Discussion). Clip electrode recordings of 501-T3 Previous extracellular recordings using a suction electrode placed over the caudal cut end of the prothoracic connective from 47 mantis species reveal three spike types in response to ultrasound (Yager, 1999). Large action potentials (signal-tonoise ratio typically >5:1) with a latency of 8–12 ms firing in a phasic-tonic pattern are always present. Occasionally, a very low amplitude tonic unit is visible above the background activity, and a very high amplitude phasic unit appears with a long latency at high sound pressure levels. Simultaneous extracellular and intracellular recordings reveal that the large phasic-tonic unit is activity in 501-T3, first described in Mantis religiosa (Yager and Hoy, 1989). 501-T3 exhibits several characteristics that distinguish it from other units in extracellular recordings: (i) it responds to ultrasound, (ii) it is not spontaneously active, (iii) action potentials reach the prothorax with a short latency (8–12 ms) and (iv) its action potentials are of large amplitude because of its large axon diameter. The ultrasonic bat vocalizations in this experiment evoked neural activity in the prothoracic connective, as measured by
312
J. D. Triblehorn and D. D. Yager Fig. 4. (A) Example of an electrode implant recording (upper) with the corresponding bat vocalizations taken from the bat detector (below). The responses of 501-T3 are in red. 501-T3 responses occur only after a bat vocalization, and each vocalization elicits a 501-T3 response, indicating that the interneuron can encode the bat’s pulse repetition rate. Time scale, 50 ms; voltage scale, 20 mV. (B) Same recording with the time scale expanded to illustrate that the responses of 501-T3 (in red) to a single bat vocalization contain multiple spikes. The first spike in each burst of 501-T3 activity has a larger amplitude than the following spikes because of its very high phasic firing rate. Time scale, 10 ms; voltage scale, 20 mV.
A
amplitude of auditory-evoked spikes was large and easily distinguishable even in recordings exhibiting high levels of background neural activity. Neural responses elicited by bat B vocalizations did not resemble in amplitude and/or shape other responses occurring spontaneously in the absence of a bat vocalization (thus indicating a non-spontaneously active unit). The latency of vocalization-elicited responses was 10–14 ms (corrected for distance differences between the mantis and microphone locations). On the basis of these parameters, we are confident that the recorded auditory-evoked neural responses came from 501-T3. In the present study, 501-T3 responds only in a phasic manner, with no tonic component. This is probably because of the short-duration bat vocalizations. Neither the low-amplitude unit nor the very large amplitude, long-latency component appeared in the neural recordings during any of the trials. the clip electrode. Fig. 4 shows an example of a typical The neural traces shown in Fig. 4 (and subsequently in extracellular recording of auditory responses (in red in Figs 5 and 7) seem to show that the amplitude of the auditory Fig. 4A) to bat vocalizations using the clip electrode spike is not constant, suggesting that the spike bursts may technique. 501-T3 burst rate (top trace) increases as the contain action potentials from auditory units other than 501repetition rate of the bat vocalizations (bottom trace) increases. T3. Several observations argue against this. Because of the Each vocalization can elicit a burst of spikes from 501-T3, very high initial firing rate of 501-T3, spike heights decrease evident when the time scale is expanded (Fig. 4B). The progressively. This decrease is evident in both intracellular and extracellular recordings from 501Response reduced T3 (Yager and Hoy, 1989) and is also exhibited in Bat leaves 207 ms, 62 cm the trace shown in Fig. 4B. Another source of platform Contact variation in spike amplitude comes from the background neural activity and noise. Although the auditory-evoked spikes are easily distinguishable within this background activity, it can alter the spike amplitude. A third source of variation occurs in the long neural traces showing responses during the entire attack sequence (Figs 4A, 5, 7). The lower resolution of the Superscope II data analysis program for viewing long traces of data alters the spike amplitude. These differences disappear, however, when the time scale is expanded (thus increasing the resolution).
Stable approach vocalizations begin
Begin buzz I Begin buzz II 327 ms, 96 cm 185 ms, 55 cm
Fig. 5. Example of a B1 flying bat attack trial. The upper trace is the neural recording and the bottom trace the corresponding bat vocalizations taken from the bat detector. The responses of 501-T3 are in red. The different phases of the bat attack are indicated. Time scale, 50 ms; voltage scale, 10 mV.
Mantis auditory interneuron responses during bat attacks Distance to contact (cm)
A
Buzz I
6
Buzz II
Bat pulse duration (ms) and PRR (pulses s–1)
5 100
4 3
10
2 1
1 –1.4 –1.2 –1 –0.8 –0.6 –0.4 –0.2 0
Bat PRR (pulses s–1) and 501-T3 burst rate (bursts s–1)
1000
B
Buzz I
Number of action potentials
1000
OS OS OS 218 157 88 32
0 0.2 0.4
Buzz II
100
10
1 –1.4 –1.2 –1 –0.8 –0.6 –0.4 –0.2 0 Time to contact (s)
0.2 0.4
Fig. 6. (A) The bat pulse duration (red line, no symbols, left axis in ms), pulse repetition rate (PRR; red line/circles, left axis in pulses s–1) and 501-T3 spikes per burst (blue line/circles, right axis) for the corresponding B1 trial in Fig. 5. The top axis is distance to contact (cm). OS, out of the calibrated space. 501-T3 burst responses cease before the buzz II phase begins (indicated by the right-hand dotted line). (B) A comparison of the bat PRR (red line/circles, in pulses s–1) with the burst rate of 501-T3 (blue line/triangles, in bursts s–1) to illustrate accurate following of bat vocalization emissions by 501-T3 during the stable approach phase and into the buzz I phase until responses cease entirely.
Responses of 501-T3 to flying bat attacks Fig. 5 shows the neural trace and corresponding bat vocalizations for a 1400 ms trial. Fig. 6A shows, for the same trial, the bat PRR (red line, circles), the pulse duration (red line, no symbols) and the number of spikes elicited in each 501-T3 response burst (blue line, circles). Fig. 6B compares the bat’s PRR (red line, circles) with the burst rate of 501-T3 (blue line, triangles). When the bat first leaves the platform, its flight can be somewhat unstable. This is reflected in its vocalizations:
313
the first vocalizations in Figs 5 and 6 have shorter durations and the PRR is not consistent. The later constant PRRs (approximately 13 pulses s–1) and corresponding pulse durations (>3 ms) are indicative of a stable flight pattern with goal-directed echolocation (the goal being the mantis target). In this trial, the bat achieves stable approach behavior 1150 ms before contact. The stable approach vocalizations are emitted at 12 pulses s–1 and are 3–4 ms in duration. 501-T3 begins responding 900 ms before contact, and each vocalization elicits a burst response of 3–5 spikes (shown clearly in Fig. 5 and Fig. 6A). The accurate coding of bat PRR (Fig. 6B) continues into the buzz I phase, when PRRs increase. However, in the middle of buzz I, the interneuron stops responding completely, and no more responses are elicited even though the bat continues to vocalize. The number of spikes elicited in each burst declines earlier than the accuracy of coding of bat PRR, changing from 3–5 spikes per burst during the approach and the beginning of the buzz I phases to 1–2 spikes per burst as PRR increases (Fig. 6A). However, it is important to note that the decline in the number of spikes elicited per burst also correlates with the decrease in pulse duration (Fig. 6A). To summarize this trial, 501-T3 follows bat PRRs up to 64 pulses s–1. The number of spikes elicited per burst declines as PRR increases and pulse duration falls below 3 ms. Pulse duration continues to decrease until contact. The last response from 501-T3 (a single spike) occurs 207 ms before contact when the bat is 62 cm from the target. This trial is categorized as a B1 trial. B1 trials include cases in which the output of 501T3 changes from spike bursts to either complete cessation of neural activity or one (and only one) single-spike between burst cessation and complete cessation of neural activity. B1 cases accounted for 55 % of all trials. In B1 trials, the last spike burst occurred 266.6±53.6 ms before contact (75.4±9.8 cm away from the preparation, N=10). In cases where a single spike occurred after burst cessation (half of B1 trials), the single spike occurred 221.8±49.1 ms before contact (66.8±8.7 cm away from the preparation, N=5). Fig. 7 shows the neural responses of 501-T3 and the corresponding bat vocalizations for a different 1400 ms trial. Fig. 8 is comparable with Fig. 6. This trial is similar to the previous trial in many ways. 501-T3 responses begin once the bat achieves a stable approach PRR and pulse duration. Each vocalization elicits a burst (3–5 spikes each) through the approach phase and into the beginning of the buzz I phase. As in the previous trial, burst responses cease during the buzz I phase as PRR increases. This is also the point at which accurate coding of the bat PRR by 501-T3 begins to fail (60 pulses s–1) and the vocalization pulse duration falls below 3 ms. Burst responses cease 211 ms before contact, when the bat is 59 cm from the target. However, this trial differs from the B1 trials because, after burst cessation, single-spike responses continue to be produced into the buzz II phase. In the buzz II phase, 501-T3 completely ceases all activity. In this trial, single-spike responses end 127 ms before contact
314
J. D. Triblehorn and D. D. Yager
when the bat is 42 cm away. We refer to trials in Bat leaves Response reduced which 501-T3 burst responses and accurate PRR platform 211 ms, 59 cm coding end during the buzz I phase but several Contact single-spike responses continue to be produced into the buzz II phase as B2 trials. B2 trials accounted for 45 % of the trials. In these trials, the last spike burst occurred 278.9±87.8 ms before contact (69.8±15.4 cm away from the preparation, N=8). The last single spike response occurred 96±54.8 ms (34.4±14.3 cm away from the preparation, N=8). No significant differences exist between the bat vocalization parameters occurring in B1 and B2 trials. Table 2 shows these comparisons. Fig. 9 summarizes our data on the cessation of 501-T3 activity (for both multi-spike bursts and single-spike responses) for B1 and B2 trials (in terms of time to contact and distance to contact). This figure also illustrates the difference between B1 and B2 trials. The last burst (diamonds) and last spike (crosses) data points for B1 (red Stable approach Begin buzz I Begin buzz II symbols) are clustered, while those for B2 (blue vocalizations begin 393 ms, 107 cm 189 ms, 54 cm symbols) have a greater separation. There are no Fig. 7. Example of a B2 flying bat attack trial. The upper trace is the neural significant differences between the times recording and the bottom trace the corresponding bat vocalizations taken from the and distances when spike bursts end in B1 and bat detector. The different phases of the bat attack are indicated. Time scale, 50 ms; B2 trials [Student’s t-test; time, t(16)=0.3664, voltage scale, 10 mV. not significant; distance, t(16)=0.9506, not significant]. However, there are differences between the times and distances when single-spike responses Table 2. Statistical test results comparing bat vocalization end [Student’s t-test; time, t(10)=4.0840, P3 ms (39%)
60 50 40 30
0 45 50 55 60 65 70 75 80 85 90 95 8 PAR-16-36 >3 ms pulses (47 vocalizations) 7 ,3 ms pulses (18 vocalizations) 6
20
Pulses ,3 ms (61%)
10 0 50–59 60–69 70–79 80–89
.90
(38,311) (224,265) (131,98) (41,17)
(4,1)
Vocalization intensity (dB pe SPL)
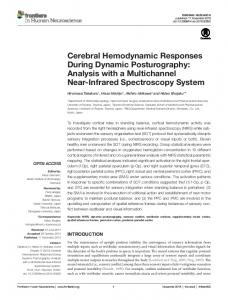
5 4 3 2 1 0 45 50 55 60 65 70 75 80 85 90 95 Vocalization intensity (dB pe SPL) Fig. 12. Number of 501-T3 spikes per burst elicited by bat vocalizations at different intensities for two mantids in the stationary bat vocalization experiment. Responses are separated into vocalizations 3 ms and longer (purple triangles) and those less than 3 ms (green triangles). For PAR-17-16, 269 of the 311 vocalizations shorter than 3 ms and 26 of the 87 vocalizations of 3 ms or longer between 50 and 65 dB pe SPL did not elicit a response, and their data points overlap. For PAR-16-36, the only large overlaps are at 69 dB pe SPL (no response) for vocalizations of less than 3 ms (five cases) and at 57 dB pe SPL (no response) for vocalizations of 3 ms or longer (six cases).
vocalization duration and increase in PRR characteristic of the terminal buzz resembled those of field recordings. Laboratory PRRs during the buzz II phase reached 167 pulses s–1. In our study, we also did not detect search vocalizations, but this does not concern us since we are interested in the vocalizations emitted in the later stages of a bat attack. Average maximum PRRs in our study (133 pulses s–1) were lower than those recorded both in the field and in the laboratory by Surlykke and Moss (167 pulses s–1). However, this difference is not important because 501-T3 shuts down before the bat reaches these PRRs. In our study, the buzz durations (mean 430.2±112.2 ms; range 235–686 ms, N=18) were shorter than
Fig. 13. Percentage of 501-T3 responses (either single-spike or multi-spike bursts) to vocalizations of different intensity ranges for pulses 3 ms and longer (purple circles) and pulses less than 3 ms (green circles). The numbers in parentheses indicate the number of vocalizations at each intensity (purple for pulses 3 ms or longer, green for pulses less than 3 ms). 501-T3 responds more reliably to longer bat vocalizations (durations of 3 ms or longer) at all intensities except those that are very loud (>90 dB pe SPL) or very quiet (