than other 'undisturbed' areas. Keywordsâ Surface water, contamination, heavy metals, geochemical parameters, Mooiriver, Potchefstroom. I. INTRODUCTION.
7th International Conference on Latest Trends in Engineering & Technology (ICLTET'2015) Nov. 26-27, 2015 Irene, Pretoria (South Africa)
Mapping of Surface Water Quality in the Vicinity of Potchefstroom based on Mining Pollutants Elvis Fosso-Kankeu, Divan P. Van der Berg, Frans Waanders, Alusani Manyatshe, Nico Lemmer, and H. Tutu
complex process that is driven by physical, biological and chemical factors. In short, AMD is formed when sulphide minerals undergo oxidative dissolution [6]. AMD water has a low pH, a high specific conductivity and is high in heavy metal and sulphate concentrations [7; 8; 9]. The occurrence of AMD is observed in both active and abandoned mines [8; 6]. Agricultural activities may contribute in different ways to the pollution of freshwater resources. These contributions include effects on water chemistry, biocide leaching, suspended loads from soil erosion, changes in the hydrological system and effects of exotic species used [10]. The need and drive to optimize crop yields has led to large quantities of artificial nitrogen being used by the agricultural industry over the past few years [11]. Mining activities in South Africa are among the largest contributors to the pollution of surface water as they produce a large volume of tailings dumps [12], and due to poor management of these tailings dumps they increase the level of pollution in surface water. The key in protecting and preserving the water resources of South Africa is to develop a water efficient economy with the necessary treatment plans in place [13]. With different activities contributing to the water pollution in the West Rand area, it is important to find the sources of contamination in order to better prevent the contamination [14].
Abstract— Surface water is considered as one of South Africa’s most limiting natural resources. The reality is that many of our natural water resources are contaminated by various activities. Various water treatment plants, industries and agricultural areas along the Mooi River depend on its water. These waters travel through mining and urban areas that may contribute to the pollution of the water. This study sampled and tested 35 different points along the Mooi River and connected streams in Potchefstroom area. Contaminants tested for using a Spectro-photometer included sulphate, nitrate, and cyanide. An ICP-OES analyser was used to test concentrations of Ag, Al, As, Ca, Cd, Cr, Fe, K, Mg, Mo, Ni, Pb, U, and Zn. Geochemical parameters such as the pH, temperature, ORP, electronic conductivity and dissolved oxygen concentrations were also tested using a pH-meter. The alkalinity and chloride concentrations were tested using titration techniques. Both filtered and non-filtered samples were tested. The results showed that several of the samples tested for had contaminant concentrations that exceeded the maximum allowable concentrations for drinking water, set by the South African National Standard (SANS) and the World Health Organization (WHO). These results indicate that areas with mining activities tend to have higher concentrations of contaminants than other ‘undisturbed’ areas.
Keywords— Surface water, contamination, heavy metals, geochemical parameters, Mooiriver, Potchefstroom I. INTRODUCTION
II. METHODOLOGY
F
OR many years water has been considered a vital raw material of social development and organization [1].The scarcity of water quality can be exacerbated through pollution by effluents from anthropogenic sources such as industrial, mining activities, domestic sewage, wastewater treatment plant and agricultural land which are directly or indirectly discharged into aquatic environment [2, 3, 4], as well as natural processes such as erosion and weathering of crustal materials [5]. One of the most significant sources of contamination in many countries is Acid Mine Drainage (AMD). AMD is a
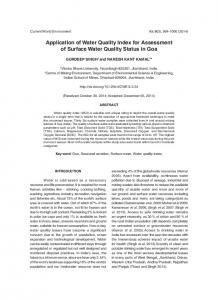
A. Sampling The first step in this study was to collect water samples at 35 various geologically determined sites along the Mooi River and Orkney areas. These water samples were collected during summer. The sites of sampling ranged from the Doornfontein mine near Carletonville to Potchefstroom as well as from the Klerkskraal dam to Potchefstroom. The Potchefstroom dam and Boskop dam were also important points of interest. The coordinates of these sampling sites were recorded using a GPS system and the sampling bottles were then labelled accordingly. The numbering system was done numerically from sample 1, which is the furthest upstream to sample 35, downstream. The flow of the numbers is thus a representation of the flow of the water. The Google Earth map in Figure 1 shows where all of the points are located. Figure 2 is an image of the Potchefstroom area.
Elvis Fosso-Kankeu is with the School of Chemical and Minerals Engineering of the North West University, Bult area-Potchefstroom-South Africa. Frans Waanders is with the School of Chemical and Minerals Engineering of the North West University, Bult area-Potchefstroom-South Africa Divan Van der Berg is with the School of Chemical and Minerals Engineering of the North West University, Bult area-Potchefstroom-South Africa http://dx.doi.org/10.15242/IIE.E1115014
43
7th International Conference on Latest Trends in Engineering & Technology (ICLTET'2015) Nov. 26-27, 2015 Irene, Pretoria (South Africa)
III. RESULTS AND DISCUSSION A. Fitness of water The fitness of the surface water samples was investigated by comparing the concentrations of the various parameters tested for to the standards set for drinking water by SANS [15] and the WHO [16]. This comparison provides an indication of how far from the drinking water norm/standard these samples deviate and thus also to which extent they are contaminated. In Table 4.1, a summary of the geochemical parameters is shown. Table 4.2 represents the major anion concentrations; values in ‘bold’ indicate that these concentrations were above the standards set for drinking water by SANS [15] and the WHO [16]. Tables 4.3 and 4.4 show some of the heavy metal concentrations. The measured and determined values of the geochemical parameters are presented in Table 4.1; as a general trend, there was no major concern with regard to the pH values in all the sampling sites; however, compared to the acceptable range, the alkalinity of the water was mostly very high. The high alkalinities observed can be due to minerals from the soil which dissolve in the water [17]. The Carletonville area is known to be underlain by dolomite rock which certainly contributes to the release of carbonate into the water network flowing down to Potchefstroom, hence the higher alkalinity which is also reported to contribute to an increase of pH [18]. The negative ORP values recorded, correspond with the high pH values observed. Other geochemical parameters tested for were temperature and dissolved oxygen. The temperature of the surface water samples ranged from 14.7 to 27°C. The dissolved oxygen concentrations ranged from 4.7 to 9.0 mg/L. The low DO values found are mainly attributed to slow moving/flowing water at these points, which were from an eye and a slow moving stream. From Table 4.3 it is seen that three sampling points had sulphate concentrations that exceeded the maximum allowable concentrations set by SANS [15] and the WHO [16] for drinking water. The amount of chloride was within the limits and four samples had nitrate concentrations that exceeded the limit. Almost all of the samples had cyanide concentrations that were above the standard. According to the WHO [16], an excess of cyanide in drinking water may cause cardiovascular, respiratory and neuro-electric alterations. The brain is reported to be the organ that is most sensitive to cyanide toxicity. Heavy metals finding their way in the water sources may adversely affect the aquatic flora and fauna, but more importantly may be linked to human poisoning if present in drinking water. Tables 4.5 and 4.6 show that the majority of samples contained higher concentrations of heavy metals that exceeded in some cases the limits set by SANS [15] and the WHO [16] for safe drinking water. The high concentrations of Ag, Ca, Cd, Fe, Mg, Ni, and Pb, were indicative of the potential contamination from mining activities in the area.
Fig. II.1: Google Earth image of sampling sites
Fig. II.2: Google Earth image of Potchefstroom sites
Water samples were collected in 500 mL clean plastic containers which were washed and rinsed three times with the water from the sampling site to prevent any contamination from elsewhere. Three samples in 500 mL plastic containers were collected per sampling site to ensure that enough sample was available for analysis. At each dam, samples were collected from different depths using a depth-sampler designed and manufactured at the North-West University (NWU). Directly after sampling, the following physico-chemical parameters were measured using a pH combined electrode with integrated temperature probe: Temperature (°C), pH, Electrical conductivity EC (mS/cm), Dissolved oxygen DO (mg/L), and Redox potential Eh (mV). The pH-meter was calibrated before field work started, using reference buffer solutions. The samples were then stored in cooler boxes filled with ice to ensure that the samples were preserved during transportation to the laboratory were further analyses were done. B. Laboratory analyses The alkalinity (as HCO3- and CO3-) was measured by titrating with 0.2 N H2SO4 acid. The concentrations of sulphate (SO42-), nitrate (NO3-), free chlorine (Cl) and cyanide (CN-) were measured using a COD and Multiparameter Bench Photometer HI 83099 (Hanna Instruments Inc., USA). The concentration of chloride was measured by titrating with a silver nitrate and sodium chloride solution. The heavy metal concentrations were analyzed using an inductively coupled plasma optical emission spectrometer (ICP-OES).
http://dx.doi.org/10.15242/IIE.E1115014
44
7th International Conference on Latest Trends in Engineering & Technology (ICLTET'2015) Nov. 26-27, 2015 Irene, Pretoria (South Africa)
TABLE III.1 GEOCHEMICAL PARAMETERS Sample Number
pH 1 2 3 4 5 6 7 8 9 10 11 12 13 14 15 16 17 18 19 20 21 22 23 24 25 26 27 28 29 30 31 32 33 34 35
8.37 8.39 9.22 8.80 8.03 7.39 7.40 7.41 8.15 8.31 8.28 8.34 8.40 8.38 8.44 8.32 8.35 8.15 8.19 8.32 8.37 8.39 8.38 8.40 8.45 8.47 8.50 8.41 8.29 8.26 8.06 8.15 8.50 8.37 8.43
TABLE III.2 MAJOR ANIONS CONCENTRATIONS
Geochemical Parameters Eh Ec Alkalinity Carb Alk mV mS/cm mg/l CaCO3 mg/l CaCO3 -76.00 0.45 880.00 18.57 -78.00 0.43 624.00 14.25 -125.00 1.40 608.00 83.75 -100.00 0.37 836.00 46.12 -58.00 1.11 796.00 7.83 -21.00 0.82 856.00 1.93 -21.00 0.81 1012.00 2.30 -22.00 0.85 938.00 2.20 -69.00 0.72 1136.00 14.28 -69.00 0.74 916.00 16.82 -78.00 0.72 812.00 14.08 -81.00 0.69 848.00 16.78 -83.00 0.70 756.00 17.31 -83.00 0.69 788.00 17.18 -86.00 0.69 724.00 18.21 -72.00 0.68 744.00 14.24 -75.00 0.67 828.00 16.79 -63.00 0.70 832.00 10.72 -66.00 0.71 732.00 10.45 -72.00 0.71 220.00 5.20 -83.00 0.70 1040.00 21.66 -83.00 0.75 1112.00 24.11 -83.00 0.69 992.00 21.21 -83.00 0.72 1120.00 24.83 -87.00 0.70 1016.00 25.38 -79.00 0.71 220.00 6.23 -83.00 0.71 244.00 8.42 -77.00 0.71 216.00 6.29 -67.00 0.77 236.00 5.12 -73.00 0.76 264.00 31.39 -61.00 0.76 228.00 2.96 -63.00 0.82 264.00 4.06 -85.00 0.78 364.00 11.52 -81.00 0.71 220.00 5.82 -87.00 0.72 220.00 6.67
Sample Number 1 2 3 4 5 6 7 8 9 10 11 12 13 14 15 16 17 18 19 20 21 22 23 24 25 26 27 28 29 30 31 32 33 34 35
B. Potential sources of water contamination Statistical summaries of the geochemical parameters are shown in Table 5. In Table 6, statistical summary of the major anion concentrations are shown, which include sulphate (SO42), nitrate (NO3-), chloride (Cl-) and cyanide (CN-). Table 7) represents the statistical summary of the heavy metals. From Table 5 it is seen that the total alkalinity of samples taken upstream of Potchefstroom was significantly higher than samples collected in the Potchefstroom area. This significant difference may be attributed to the variation in soil from the different areas. The upstream area contains more dolomite rock which increases the alkalinity of the water in contact with it [18]. The pH values in all two areas were very similar and fairly high. The upstream pH values varied between 7.39 and 9.22, while in the Potchefstroom area the pH range was 8.06 to 8.50. Although the mine effluents did not seem to significantly impact the pH, the minimum values were recorded in those areas and it is therefore likely that a chemical imbalance will result into an acidic pH. The slightly lower pH values found upstream, may be due to the Doornfontein mine which pumps its treated waste water into the Mooi River at sampling point 4. The Eh and EC of both areas were very similar.
http://dx.doi.org/10.15242/IIE.E1115014
45
Major Anions Sulphate Chloride Nitrate mg/l mg/l mg/l 0.00 13.33 0.00 0.00 10.00 2.50 595.00 76.67 0.20 525.00 73.33 0.00 315.00 66.67 2.40 150.00 43.33 18.80 140.00 33.33 8.40 160.00 43.33 3.10 110.00 30.00 4.30 110.00 33.33 0.00 100.00 36.67 6.30 100.00 40.00 0.20 110.00 36.67 0.80 100.00 40.00 0.00 110.00 40.00 0.90 110.00 33.33 8.50 110.00 33.33 2.00 120.00 40.00 0.20 110.00 33.33 1.60 120.00 33.33 4.10 90.00 36.67 21.60 100.00 56.67 5.50 110.00 36.67 0.00 100.00 36.67 0.00 110.00 43.33 1.90 100.00 36.67 11.20 95.00 30.00 2.20 100.00 40.00 4.70 180.00 46.67 0.60 120.00 26.67 0.00 120.00 43.33 0.00 110.00 53.33 5.80 550.00 150.00 6.50 160.00 40.00 0.00 100.00 43.33 28.00
Cyanide mg/l 3.00 2.00 3.00 3.00 3.00 2.00 3.00 2.00 1.00 2.00 1.00 1.00 1.00 1.00 1.00 1.00 1.00 2.00 2.00 2.00 1.00 1.00 1.00 0.00 0.00 1.00 0.03 1.00 2.00 2.00 1.00 0.00 33.00 1.00 1.00
7th International Conference on Latest Trends in Engineering & Technology (ICLTET'2015) Nov. 26-27, 2015 Irene, Pretoria (South Africa)
TABLE III.3 HEAVY METALS CONCENTRATIONS Sample Number 1 2 3 4 5 6 7 8 9 10 11 12 13 14 15 16 17 18 19 20 21 22 23 24 25 26 27 28 29 30 31 32 33 34 35
Ag mg/l 0.00 0.00 0.00 0.00 0.00 0.00 0.00 0.00 0.00 0.01 0.07 0.01 0.00 0.00 0.00 0.00 0.00 0.00 0.00 0.04 0.01 0.02 0.02 0.00 0.00 0.12 0.05 0.59 0.00 0.00 0.01 0.00 0.01 0.02 0.05
Al mg/l 0.00 0.00 0.63 0.14 0.30 0.00 0.00 0.00 0.03 0.05 3.85 0.05 0.00 0.05 0.09 0.00 0.00 0.00 1.60 0.10 0.30 0.40 0.06 0.11 0.14 0.21 0.16 0.13 0.09 0.00 0.43 0.00 0.14 0.04 0.04
Heavy metals As Ca mg/l mg/l 0.00 38.43 0.57 37.60 5.00 102.92 2.07 102.25 4.84 78.26 3.51 71.40 4.61 68.45 2.30 68.40 0.84 218.50 0.00 216.60 0.00 217.30 0.00 213.40 0.31 212.50 0.26 210.30 0.95 211.40 2.20 44.35 2.10 45.48 0.00 48.75 0.00 52.80 2.35 51.22 1.43 208.70 0.00 208.40 0.00 210.10 0.00 210.20 0.00 212.00 4.53 48.43 3.67 48.64 2.06 48.73 2.25 66.15 0.97 53.36 1.38 49.88 0.00 38.69 0.00 185.80 1.76 48.89 1.08 49.26
Cd mg/l 0.00 0.17 0.07 0.09 0.05 0.15 0.09 0.01 0.15 0.11 0.14 0.09 0.25 0.08 0.14 0.00 0.24 0.03 0.14 0.03 0.15 0.15 0.09 0.08 0.13 0.20 0.70 0.09 0.15 0.00 0.21 0.00 0.10 0.02 0.20
Cr mg/l 0.00 0.00 0.00 0.00 0.00 0.00 0.00 0.00 0.00 0.00 0.00 0.02 0.03 0.00 0.00 0.06 0.03 0.00 0.06 0.00 0.00 0.00 0.00 0.00 0.00 0.06 0.06 0.01 0.00 0.02 0.09 0.00 0.03 0.00 0.00
Fe mg/l 0.00 0.00 0.00 0.00 0.00 0.00 0.00 0.00 5.71 0.10 11.34 0.65 6.90 0.39 8.29 0.00 0.00 0.00 9.45 8.47 0.47 0.68 0.20 0.34 0.69 22.00 36.00 17.80 7.69 0.66 6.95 0.00 15.60 8.48 14.00
U mg/l 0.01 0.06 0.04 0.07 0.00 0.00 0.00 0.00 0.05 0.01 0.03 0.00 0.00 0.00 0.00 0.01 0.00 0.00 0.05 0.01 0.00 0.00 0.00 0.00 0.04 0.00 0.00 0.00 0.03 0.00 0.00 0.00 0.00 0.00 0.00
Zn mg/l 0.00 0.00 0.16 0.00 0.00 0.00 0.00 0.00 0.30 0.07 0.08 0.16 0.56 0.24 0.29 0.00 0.03 0.00 0.56 0.25 0.28 0.10 0.29 0.21 0.09 0.25 0.33 0.00 0.09 0.00 0.00 0.00 0.00 0.01 0.00
From Table 6, it is seen that the concentrations of sulphate in the upstream were slightly higher than in Potchefstroom areas, indicating the potential source of AMD contamination. The concentration of sulphate found upstream in the Doornfontein mine canal was 595 mg/L, and the sulphate concentration in the Ikageng canal in Potchefstroom was 550 mg/L. Both these sample sites are located near mining activities, which may suggest that polluted waters from the respective mines are potentially polluting these points. High chloride concentrations were found in the Ikageng canal (150 mg/L) which suggests some chloride contamination from this mine. The highest concentration of nitrate was found just downstream of an agricultural college in the Potchefstroom area, which indicates the potential presence of fertilizers in the water that are used for agricultural activities. The highest nitrate concentration upstream was found in an area with a lot of cattle, which can potentially mean that the cattle dung is contributing to the high nitrate concentration. Very high cyanide concentration of 33 mg/L was found in the Ikageng canal, which indicates potential contamination from this mine which mostly focuses on gold mining and may therefore use cyanide as a leaching agent. There was no statistical significant difference between the concentrations of heavy metals at the different sampling sites; however according to the results in Table 7, some elements were relatively abundant in specific areas. Uranium (U) was mainly found upstream of Potchefstroom, where mining activities are taking place. Co-occurrence of higher concentrations of Ca and Mg was observed upstream of Potchefstream, confirming the impact of dolomite rock on the geochemistry of streams that flow across that area. Arsenic (As) was higher upstream, and its presence in surface water around Potchefstroom could probably result from contamination of water flowing through the mining areas upstream. It was quite surprising to record high concentration of Fe in Potchefstroom and the source could not be identified. In general, the heavy metals contamination in the Potchefstroom area was slightly less than in the upstream area; as already mentioned, the mining activities could have been the major source of these pollutants.
TABLE III.4 HEAVY METALS CONCENTRATIONS Sample Number 1 2 3 4 5 6 7 8 9 10 11 12 13 14 15 16 17 18 19 20 21 22 23 24 25 26 27 28 29 30 31 32 33 34 35
K mg/l 1.43 9.75 1.22 5.38 5.08 20.17 13.14 12.79 2.38 4.93 13.24 13.48 13.02 16.72 12.88 12.98 12.94 12.89 13.11 3.17 3.37 3.54 2.87 2.32 2.07 11.67 9.34 6.85 39.41 25.88 27.93 0.00 0.99 0.95 2.56
Mg mg/l 28.39 27.67 72.00 71.00 42.02 38.25 37.33 39.85 195.60 199.90 202.00 199.50 199.20 198.00 198.80 41.07 42.09 39.65 43.09 36.56 188.80 191.30 195.00 199.00 199.70 40.37 39.89 39.52 50.53 20.00 40.19 28.33 124.10 35.94 35.38
Heavy metals Mo Ni mg/l mg/l 0.51 0.00 0.29 0.00 0.10 0.00 0.00 0.15 0.17 0.06 0.00 0.00 0.00 0.00 0.00 0.00 1.10 0.00 0.91 0.00 0.88 0.00 0.62 0.00 1.07 0.00 0.35 0.00 0.65 0.00 0.14 0.00 0.25 0.00 0.00 0.00 0.00 0.32 0.58 0.28 0.65 0.00 0.60 0.00 0.38 0.00 0.54 0.00 0.69 0.00 23.50 0.00 0.41 0.51 0.13 0.00 0.38 0.03 0.13 0.00 0.31 0.28 0.80 0.31 0.99 0.13 0.17 0.13 0.04 0.00
http://dx.doi.org/10.15242/IIE.E1115014
Pb mg/l 0.72 0.32 0.00 0.00 0.21 0.25 0.22 0.00 0.39 0.44 0.70 1.25 0.73 0.67 0.21 0.00 0.00 0.00 0.00 0.00 0.30 1.21 0.89 0.59 1.01 5.13 0.13 0.00 0.00 1.01 0.00 0.00 0.00 0.00 0.00
46
7th International Conference on Latest Trends in Engineering & Technology (ICLTET'2015) Nov. 26-27, 2015 Irene, Pretoria (South Africa)
TABLE III.5 STATISTICAL GEOCHEMICAL PARAMETERS
TABLE III.6 STATISTICAL MAJOR ANIONS
TABLE III.7 STATISTICAL HEAVY METALS
Wonderfontein area. In general though the Boskop and Potchefstroom dams were not significantly contaminated and can be grouped with the Klerkskraal dam which was the least contaminated point in the system.
IV. CONCLUSION This study was able to identify some significant points of contamination in the water system of the Mooi River in the vicinity of Potchefstroom. The most contaminated areas within the study were found to be those in close proximity to mining activities. Contamination from upstream was predominantly found near the Doornfontein mine. The mine’s canal discharges its water into the Mooi River at sampling point 4, which is identified as the source of upstream contamination. The Ikageng canal, flowing from a mine dam, was identified as the largest contributor to contamination in Potchefstroom. The high concentrations of other contaminants are linked to contamination from upstream which indicates that these contaminants do not totally precipitate in the system, and are transported downstream. The upstream and Potchefstroom areas were dominated by high levels of Ca, Mg, sulphate and alkalinity. The upstream area is underlain by dolomite rock which is certainly the contributing factor to the high alkalinity in the area. The high Ca, Mg and sulphate concentrations are linked to the Doornfontein mine as well as mining activities from the upper http://dx.doi.org/10.15242/IIE.E1115014
ACKNOWLEDGEMENT The authors are grateful to the sponsor from the North-West University and the National Research Foundation (NRF) in South Africa. The contribution of Dr O. Ntwampe is really appreciated. REFERENCES [1]
[2]
[3]
47
Sabhapandit, P., Saikia, P. & Mishra, A.K. 2010. Statistical analysis of heavy metals from water samples of Tezpur sub-division in Sonitpur district, Assam, India. International Journal of Applied Biology and Pharmaceutical Technology, 1 (3). Manickum, T., John, W., Terry, S. & Hodgson, K. 2014. Preliminary study on the radiological and physicochemical quality of the Umgeni Water catchments and drinking water sources in KwaZulu-Natal, South Africa. J Environ Radioact, 137:227-240, Nov. http://dx.doi.org/10.1016/j.jenvrad.2014.07.015 Fosso-Kankeu E, Mulaba-Bafubiandi A, Mamba BB, Barnard TG. 2009. Mitigation of Ca, Fe, and Mg loads in surface waters around mining areas using indigenous microorganism strains. Journal of Physics and Chemistry of the Earth, Vol 34, pp 825-829.
7th International Conference on Latest Trends in Engineering & Technology (ICLTET'2015) Nov. 26-27, 2015 Irene, Pretoria (South Africa)
[4]
[5]
[6]
[7]
[8]
[9]
[10] [11]
[12]
[13]
[14] [15]
[16]
[17]
[18]
http://dx.doi.org/10.1016/j.pce.2009.07.005 Fosso-Kankeu E, Mulaba-Bafubiandi AF, Mamba BB and Barnard TG. 2011. Prediction of metal-adsorption behaviour in the remediation of water contamination using indigenous microorganisms. Journal of Environmental Management, 92 (10), pp 2786-2793. http://dx.doi.org/10.1016/j.jenvman.2011.06.025 Simeonov, V., Stratis, J.A., Samara, C., Zachariadis, G., Voutsa, D., Anthemidis, A., et al. 2003. Assessment of the surface water quality in Northern Greece. Water Res, 37 (17):4119-4124. http://dx.doi.org/10.1016/S0043-1354(03)00398-1 Simate, G.S. & Ndlovu, S. 2014. Acid mine drainage: Challenges and opportunities. Journal of Environmental Chemical Engineering, 2 (3). http://dx.doi.org/10.1016/j.jece.2014.07.021 Akcil, A. & Koldas, S. 2006. Acid Mine Drainage (AMD): causes, treatment and case studies. Journal of Cleaner Production, 14 (1213):1139-1145. http://dx.doi.org/10.1016/j.jclepro.2004.09.006 Anawar, H.M. 2013. Impact of climate change on acid mine drainage generation and contaminant transport in water ecosystems of semi-arid and arid mining areas. Physics and Chemistry of the Earth, Parts A/B/C, 58-60:13-21. http://dx.doi.org/10.1016/j.pce.2013.04.002 Nyquist, J. & Greger, M. 2009. A field study of constructed wetlands for preventing and treating acid mine drainage. Ecological Engineering, 35 (5). http://dx.doi.org/10.1016/j.ecoleng.2008.10.018 Moss, B. 2008. Water pollution by agriculture. Philos Trans R Soc Lond B Biol Sci, 363 (1491):659-666, Feb 12. Zhang, Y., Li, F., Zhang, Q., Li, J. & Liu, Q. 2014b. Tracing nitrate pollution sources and transformation in surface- and ground-waters using environmental isotopes. Sci Total Environ, 490:213-222, Aug 15. Rosner, T. & van Schalkwyk, A. 1999. The environmental impact of gold mine tailings footprints in the Johannesburg region, South Africa. Engineering and Environmental Geology, 59:137-148. Ntengwe, F.W. 2005. An overview of industrial wastewater treatment and analysis as means of preventing pollution of surface and underground water bodies—the case of Nkana Mine in Zambia. Physics and Chemistry of the Earth, Parts A/B/C, 30 (11-16):726-734. http://dx.doi.org/10.1016/j.pce.2005.08.014 Opperman, I. 2008. The Remediation of surface water comtamination: Wonderfonteinspruit. 1. University of South Africa. SANS. 2005. South African National Standard Drinking water. Standards South Africa, http://apps.who.int/iris/bitstream/10665/44584/1/9789241548151_eng. pdf Date of access 20 May 2015. WHO. 2011. Guidelines for drinking water quality, fourth edition. World Health Organization, http://apps.who.int/iris/bitstream/10665/44584/1/9789241548151_eng. pdf Date of access 20 May 2015. Bajpai, R. 2012. Comparative analyses of physicochemical parameters of Hasdeo river barrage & Arpa River water samples of Bilaspur region. International Journal of Scientific and Reasearch Publications, 2 (9):2250-3153. Malan, J.D. 2002. The impact of the gold mining industry on the water quality of the Kromdraai catchment. Geography and Environmental Management: University of Johannesburg. https://ujdigispace.uj.ac.za Date of access 19 Oct. 2015.
The corresponding author is currently a Senior Lecturer in the School of Chemical and Minerals Engineering at the North-West University (Potchefstroom). He is an NRF rated researcher who has published journal articles, book chapters and book. Dr Elvis Fosso-Kankeu has been the recipient of several merit awards.
http://dx.doi.org/10.15242/IIE.E1115014
48