May 23, 2014 - Eric Finot, Eric Lesniewska, and Jean-Pierre Goudonnet ..... 16 N. Nonnenmacher, J. Greschner, O. Wolter, and R. Kassing, J. Vac. Sci. Technol ...
Mapping the influence of stress on the surface elasticity with an atomic force microscope Eric Finot, Eric Lesniewska, Jean-Pierre Goudonnet, and Jean-Claude Mutin Citation: Applied Physics Letters 73, 2938 (1998); doi: 10.1063/1.122636 View online: http://dx.doi.org/10.1063/1.122636 View Table of Contents: http://scitation.aip.org/content/aip/journal/apl/73/20?ver=pdfcov Published by the AIP Publishing Articles you may be interested in Compositional mapping of surfaces in atomic force microscopy by excitation of the second normal mode of the microcantilever Appl. Phys. Lett. 84, 449 (2004); 10.1063/1.1642273 Surface wrinkling of two mutually attracting elastic thin films due to van der Waals forces J. Appl. Phys. 90, 6098 (2001); 10.1063/1.1418424 Surface stress induced deflections of cantilever plates with applications to the atomic force microscope: Rectangular plates J. Appl. Phys. 89, 2911 (2001); 10.1063/1.1342018 Investigations of surface forces between gypsum crystals in electrolytic solutions using microcantilevers J. Chem. Phys. 111, 6590 (1999); 10.1063/1.479950 Localized surface elasticity measurements using an atomic force microscope Rev. Sci. Instrum. 68, 4498 (1997); 10.1063/1.1148420
This article is copyrighted as indicated in the article. Reuse of AIP content is subject to the terms at: http://scitation.aip.org/termsconditions. Downloaded to IP: 193.52.246.36 On: Fri, 23 May 2014 13:39:14
APPLIED PHYSICS LETTERS
VOLUME 73, NUMBER 20
16 NOVEMBER 1998
Mapping the influence of stress on the surface elasticity with an atomic force microscope Eric Finot, Eric Lesniewska, and Jean-Pierre Goudonnet L.P.U.B. CNRS 5027—Universite´ de Bourgogne, F-21011 Dijon, France
Jean-Claude Mutin L.R.R.S. CNRS 5613—Universite´ de Bourgogne, F-21011 Dijon, France
~Received 17 November 1997; accepted for publication 21 September 1998! This letter reports an original experimental observation of the lateral stress effects on pure surface. The surface elasticity has been separated from topographical informations at the microscopic and atomic levels. The stress applied to the sample leads to modify the stiffness of the surface and affect the force modulation images. Measurements also revealed that the spring constant and the quality factor of cantilevers play an important role in the contrast mechanism of the elasticity images. © 1998 American Institute of Physics. @S0003-6951~98!03246-X#
The atomic force microscopy ~AFM!,1 is now used to examine the sample deformation occurring when the rigid tip presses the surface. It has been previously reported that force measurements with the atomic force microscope or with nanoindenters can be used to determine local surface properties.2–9 However, we can notice that the measurement of the elastic indentation by this method has some uncertainties due to the evaluation of the tip geometry and the problem of slipping of the tip on the sample. On the other hand, mapping the local properties by analyzing the force at each point of the image is still long and sets problems of thermal drifts.10 As matter stand, the force modulation technique, that is to say vibrating a cantilever in contact of the sample, has shown different contrasts on various materials on surfaces.11–14 A criticism we would raise is that the contrast can be connected not only to different stiffnesses but also to different adhesions or frictions resulting of different materials. We know of no source where the force modulation technique exposes the pure elastic feature on a pure surface. Our approach in this letter is to use this technique on a pure cleaved surface to distinguish between the real surface stiffness and the others components. This goal needs an optimization of the force modulation in finding the appropriate cantilever. In this attempt, sets of experimental data with different cantilevers were collected while varying the stress applied to the sample. Theoretical modeling15 of the vibrating lever in the contact of the surface permits us to choose the spring constant k of the cantilever in order not only to sufficiently relax the surface but also to not damage it. A bimorph vibrates with an amplitude A bim at a high pulsation v 52 p f and induces at the end of the cantilever a tip oscillation a tip at the same frequency. The response function G of the cantilever is given by G5 a tip/A bim 5 k/„A~ k1S2m v 2 ! 2 1 ~ 2 p f D ! 2 …1/2 . ~1! D, S, and F 0 are, respectively, the dissipation constant, the surface stiffness, and the constant force acting between the surface and the tip. a tip is smaller on a stiff surface than on a smooth one.
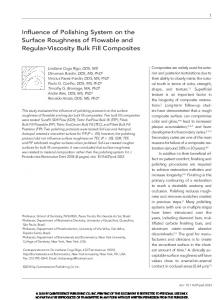
A nanoscope III scanning probe microscope ~Digital Instruments Inc., Santa Barbara, CA! equipped with a force modulation setup and a D type scanner ~12 mm!, is operated in contact mode. Various silicon nitride or silicon cantilevers ~Park Scientific Instruments, Sunnyvale, CA! of spring constant k equal to 0.03, 0.12, 0.36, 0.58, and 1.55 N/m, are mounted on a bimorph, which vibrates perpendicular to the sample surface ~z direction!. The thickness of the different cantilevers is estimated by measuring their resonant frequency n. The associated spring constant k is then calculated. The effective mass of the cantilever is given by m 5k/(2 pn ) 2 . The knowledge of the dissipation term D is a crucial factor for the response of the cantilever. The physical origin of the dissipation term comes from the hydrodynamic interaction. Vibrating the cantilever causes fluid to flow in and out from the intermediate region between the cantilever and the sample.16 The quality factor of the cantilever evaluated to 50 far away from the surface tends to zero in contact of the surface and therefore the coefficient D can largely increase to a value higher than 100 mN s m21. Hence, the choice of the good couple ~k,D! is critical for obtaining a dependence of G with the stiffness S of the surface. Taking into account the error on k and D, a qualitative variation of G is given versus S and the spring constant k ~Fig. 1!. In the contact mode, phenomena of friction or torsion of the cantilever with the slip of the tip on the surface also have to be considered. Classical tests consisting of zooming, rotating the scanning area to ensure the direction, and the spacing of the phenomena are described below. The surface stiffness dictates the choice of the spring constant k of the cantilever. k does not have to exceed 0.2 N/m for soft biological samples while in the gypsum case, k should be in the range 0.4–1 N/m to have the greatest contrast in the force modulation image. The hard samples (S ;20 N/m) require spring constants k as large as 1.5 N/m. The miniature vice (mass52.5 g) is mounted on the piezoelectric tube. The tightening of two parallel plans permits us to apply a pressure on two edges of a lamellar crystal. The studied surface is the ~010! face of gypsum (CaSO4•2H2O). 17 This is readily explained by its elastic modulus being ten times lower than that of the rigid tip of
This article is copyrighted as indicated in the article. Reuse of AIP content is subject to the terms at: http://scitation.aip.org/termsconditions. Downloaded to IP: 0003-6951/98/73(20)/2938/3/$15.00 2938 © 1998 American Institute of Physics 193.52.246.36 On: Fri, 23 May 2014 13:39:14
Appl. Phys. Lett., Vol. 73, No. 20, 16 November 1998
Finot et al.
2939
FIG. 1. Theoretical response G of the cantilever vs the stiffness S of the surface for different spring constant taking the coefficient of dissipation D into account.
silicon nitride, so that the elastic feature exclusively comes from the surface. Cantilevers with different k are scanned in contact of the sample with a small vertical oscillation at the frequency of the bimorph ( f 58.8 kHz). The amplitude a tip increases with the small amplitude A bim and then comes to saturate. Experimentally, a tip and A bim were selected in order to have the maximum response amplitude a tip for the lowest drive amplitude A bim . The images of the gypsum sample show the best contrast for cantilevers with k equal to 0.56 N m21, a result consistent with Fig. 1. The experimental response G exp50.059 for k50.56 N/m conducts to estimate a gypsum stiffness S of about 6 N/m. FIG. 2. ~a! Topography (10310 nm) of the gypsum ~010! face in contact Figure 2 is a comparison between the high resolution mode. F app,100 pN. At low force, the contact mode is sensitive to the imaging (10310) nm2 obtained in the contact mode @Fig. water molecules of the upper plane. ~b! Stiffness (10310 nm) of the gyp2~a!# and in the force modulation mode @Fig. 2~b!#. Gypsum sum ~010! face in the force modulation mode. A bim52.45 nm. a tip crystal has a monoclinic structure with a perfect cleavage 50.2 nm. The elastic response of the surface ~sulfate terahedrons in bright! parallel to its ~010! lattice plane caused by its layered strucfollows the crystallographic parameters of the surface. ture. These layers composed by chains of calcium and sulfate tetrahedron are bound together with structural water molshearing process. Enlarging and rotating the scan, and scanecules. Structural water molecules compose the upper plane ning by trace and retrace method guarantee the direction and of the ~010! face. The resolution of the force modulation the periodicity of the strips. Therefore, the observed phemode is inferior to that of the contact mode. The force modunomenon does not result from friction or slip of the tip along lation is only sensitive to the sulfate groups organized folthe surface. What is more, it must be emphasized that the lowing the crystallographic parameters ~space group: C2/c, observations of strips were only feasible with cantilevers a50.568 nm, c50.629 nm, b 5113°5) but is insensitive to with k of about 0.6 N/m. In light of the previous theoretical the structural water molecules of the upper plane contrary to arguments, the visualized strips can be put down to an elastic the information obtained in the contact mode. This observafeature of the surface. To test whether the presence of the tion suggests that the true atomic resolution ~height image! in strips is due to the lateral stress, the gypsum sample is contact mode @Fig. 2~a!# is available only with small applied strongly pressed in a miniature vice according various direcforce, in the opposite case, it merges into an image of elastions in the ~010! plane. If the stress is parallel to the @001# ticity. direction, no elastic modulation is observed. On the contrary, At a microscopic level, when the sample is slightly when the sample is pressed in the @100# direction, the clear maintained in miniature vice, the elasticity of the ~010! gypstrips appear again with a periodicity similar to the case of sum face was flat. Nevertheless, the elastic response of the the glued sample except that no shearing process is outlined. surface largely hinges upon the stress. The first observations The latter process is only observed when the stress has a were done with the gypsum crystals glued to metallic tabs. In direction that differs from the crystallographic axes. The latthe force modulation image @Fig. 3~b!#, some clear strips eral pressure applied to the sample also has an influence on appear with a periodicity of about 1 mm and a width of 200 the periodicity of the clear strips. The greater the lateral nm. The direction of these strips is the @001# crystallographic stress is, the more the periodicity decreases. The minimum direction of the ~010! gypsum face and it is insensitive to the periodicity of 240 nm should correspond to the limit size of atomic steps of the surface. However, the clear strips can This article is copyrighted as indicated in the article. Reuse of AIP content is subject to the terms at: http://scitation.aip.org/termsconditions. Downloaded to IP: move up 50 nm near the topographic steps reflecting the crushed gypsum crystals. In this condition, some dark strips 193.52.246.36 On: Fri, 23 May 2014 13:39:14
2940
Finot et al.
Appl. Phys. Lett., Vol. 73, No. 20, 16 November 1998
FIG. 4. Gypsum sample strained laterally in miniature vice. Force modulation image (434 m m). When the sample is strongly pressed in a direction close to the @100#, the stiffness of the surface is not uniform with the appearance of elastic nodes ~bright truncated part at the bottom!. The periodicity of the clear strips ~arrows! is reduced to 240 nm.
derstanding not only the elastic feature of gypsum but also presumably the cracking of this material. The authors acknowledge the valuable suggestions of A. Dereux and C. Le Grimellec. Financial support was provided by the Association Technique de l’Industrie des Liants Hydrauliques, the Lafarge Society, the Conseil Re´gional de Bourgogne, and the Ministe´re de la Recherche Scientifique. G. Binnig, C. F. Quate, and C. Gerber, Phys. Rev. Lett. 56, 930 ~1986!. J. Cleveland, S. Manne, D. Bocek, and P. Hansma, Rev. Sci. Instrum. 64, 403 ~1993!. 3 E. Finot, E. Lesniewska, J. C. Mutin, and J. P. Goudonnet, Scanning Microsc. 10, 697 ~1996!. 4 R. Overney, D. P. Leta, C. F. Pictroski, M. H. Rafailovich, Y. Liu, J. Quinn, S. Sokolov, A. Eisenberg, and G. Overney, Phys. Rev. Lett. 76, 1272 ~1996!. 5 M. Heuberger, G. Dietler, and L. Schlapbach, J. Vac. Sci. Technol. B 14, 1250 ~1996!. 6 S. Hues, C. Draper, and R. Colton, J. Vac. Sci. Technol. B 12, 2211 ~1994!. 7 A. Weisenhorn, M. Khorsandi, V. Gotzos, and H.-J. Butt, Nanotechnology 4, 106 ~1993!. 8 N. Burnham, D. Dominguez, R. Mowery, and R. Colton, Phys. Rev. Lett. 64, 1931 ~1990!. 9 G. Blackman, C. Mate, and M. Philpott, Phys. Rev. Lett. 65, 2270 ~1990!. 10 S. Kipp, R. Lacmann, and M. A. Schneeweiss, Ultramicroscopy 57, 333 ~1995!. 11 M. Radmacher, M. Fritz, J. P. Cleveland, D. A. Walters, and P. K. Hansma, Langmuir 1, 3 ~1994!. 12 M. Radmacher, R. Tillmann, and H. Gaub, Biophys. J. 64, 735 ~1993!. 13 M. Radmacher, R. Tillmann, M. Fritz, and H. Gaub, Science 257, 1900 ~1992!. 14 P. Maivald, H. J. Butt, S. A. C. Gould, G. B. Prater, B. Drake, J. A. Gurley, V. B. Ellings, and P. K. Hansma, Nanotechnology 2, 103 ~1991!. 15 D. Sarid, Scanning Force Microscopy with Applications to Electric, Magnetic, and Atomic Force Microscope ~Oxford University Press, Oxford, 1991!. 16 N. Nonnenmacher, J. Greschner, O. Wolter, and R. Kassing, J. Vac. Sci. Technol. B 56, ~1991!. 17 E. Finot, E. Lesniewska, J. C. Mutin, and J. P. Goudonnet, Surf. Sci. 384, 201 ~1997!. 1 2
FIG. 3. Gypsum crystal glued onto metallic tabs. ~a! Topography (10 310 m m) of the gypsum ~010! face. Steps of 4 nm height. ~b! Stiffness of the same area elasticity are oriented in the @001# direction of the crystal with a periodicity of 1 mm. The dark lines are the response of the steps. They cross the bright strips ~greater stiffness! induced by the stress.
appear on the image of force modulation. When the sample is strongly pressed, some elastic nodes are observed corresponding with a curved surface ~Fig. 4!. The loosening of the vice restores the first observed elastic properties. This produces a proof of reversible properties. The periodicity and the orientation of the clear strips reflect a microscopic phenomenon resulting from a property of the gypsum crystalline structure. The @001# orientation of the strips is due to the atomic structure that reveals the feasibility of the slipping of the calcium sulfate chain according to the @001# direction. To conclude, the experiments presented above clearly demonstrate the capability of the force modulation technique to point out the effect of stress on the elasticity of a pure material. These results are relevant to interpreting the images of AFM in the contact mode and in the force modulation mode. In addition, this work shows that the fact of gluing a relatively soft material such as gypsum can induce a stress in the surface. This technique provides a possible guide for un-
This article is copyrighted as indicated in the article. Reuse of AIP content is subject to the terms at: http://scitation.aip.org/termsconditions. Downloaded to IP: 193.52.246.36 On: Fri, 23 May 2014 13:39:14