Jul 20, 1994 - airship operating within about 50 km of the Oregon coast. The flights ... profiling of the MBL, (2) profiling the MBL when marine stratus is ..... cycles (during the life-time of the stratus). .... directly below was visible but was soon lost as the line of .... ground and 900 m (3000 ft) on nearly half the days on which.
JOURNAL
OF GEOPHYSICAL
RESEARCH,
VOL. 99, NO. D7, PAGES 14,443-14,459, JULY 20, 1994
Marine boundary layer measurementsof new particle formation and the effectsnonprecipitating clouds have on aerosol
size distribution
W. A. Hoppel, G. M. Frick, and J. W. Fitzgerald Remote Sensing Division, Naval Research Laboratory, Washington, D.C.
R. E. Larson
1
SFA Incorporated, Landover, Maryland
Abstract. Measurements of aerosol size distributions (0.005 < r < 20 /am), cloud droplet spectra, SO2, 03, CN, and other supportingquantitieswere made in the cloudtopped and clear marine boundary layer (MBL) from an airship operating within about 50 km of the Oregon coast. Comparisonof size distribution of interstitial aerosol within the cloud with the size distribution below the cloud clearly indicates that the processingof the aerosol through (nonprecipitating)stratus can lead to increased mass of the subset of particles which had served as cloud condensationnuclei (CCN). This increase in mass in the CCN results in a distinct "cloud residue" mode in the size distribution measured below the cloud. In all cases the aerosol mass in the cloud
residue mode greatly exceeded the mass in the interstitial mode, even though the number concentration of interstitial particles sometimesexceeded the CCN concentration. Evidence of new particle formation in clear air was also found on numerous occasions. Analyses of the data indicate that the growth of newly formed particlesinto the observedsize rangeis consistentwith gasphaseoxidationof SO2 to sulfate and subsequent condensation on the aerosol. However, the exact nucleation process, whether by homogeneousnucleation, ion-assistednucleation, or heterogeneousnucleation on precursor embryos, is still an open question. require (1) a nearly stationary platform within an air mass, e.g., Lagrangian measurements; (2) vertical profiling mea1Measurements were made of aerosol size distributions, surementsdownwind of localized sourceswhere high spatial trace gases, and other supporting measurements from an resolution is required, e.g., plumes from stationary and airship operating within about 50 km of the Oregon coast. slowly moving sources; or (3) measurements where lowThe flightswere made between August 10 and 29, 1992. The speed sampling decreases the difficulty of sampling and/or purpose of the experiment was to demonstrate the utility of samplingerrors, e.g., sampling cloud droplets and hydroman airship as a platform to measure atmospheric aerosols, eters. The slow airspeed of the airship can also be a cloud microphysics, and trace gas chemistry in the marine significant disadvantage by limiting the meteorological conboundary layer (MBL) in preparation for more comprehenditions under which it can operate and the range to the order sive measurementsto be conductedin air massesadvecting of 150 km from its base of operation. off the East coast. The 1992 demonstration measurements The airship used in the experiments reported here was the can be classifiedinto three types of experiments:(1) clear air US-LTA model 138S airship and is shown in Figure 1. A profiling of the MBL, (2) profiling the MBL when marine stratus is present, and (3) measurementsof ship plumes. gasoline-powered generator which can provide 55 amps of Results of the profiling measurementsshowingthe effects of 115 V, 60 Hz power was mounted external to the gondola; cloud processing on the aerosol size distribution and evi- 500 kg of scientific equipment was mounted in three instrudence of new particle formation by heteromolecular nucle- ment racks inside the gondola and particle-sampling equipment was mounted 1.8 m below the nose of the airship (see ation are presented in this paper. Figure 1). In addition to the scientific payload, a pilot plus two scientists could be accommodated during the flights. A 2. Airship and Instrumentation further discussionof the airship's capabilities as a platform The slow airspeed of an airship immediately suggestsits for boundary layer research can be found in the work of candidacy as a research platform for experiments which Frick and Hoppel [1993]. The instruments installed on the airship during the 1992 •Workperformed at RemoteSensing Division,NavalResearch measurementsare shown in Table 1, together with the size Laboratory, Washington, D.C. range for the particle measurements and lowest detectable Copyright 1994 by the American GeophysicalUnion. concentrations for the trace gas measurements. All the 1.
Introduction
Paper number 94JD00797.
instruments
0148-0227/94/94 JD-00797505.00
gondola except for the PMS (CSASP-100HV) optical particle 14,443
were mounted
in three instrument
racks in the
14,444
HOPPEL
ET AL.'
MARINE
BOUNDARY
LAYER
MEASUREMENTS
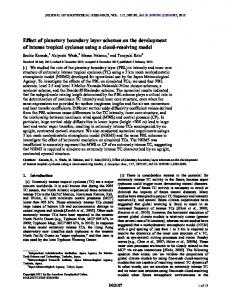
Figure 1. US-LTA 138S airship. The PMS optical particle counter (OPC) is mounted below the nose of the airship together with the inlet to the samplingtube. counter (OPC) which was mounted under the nose of the aircraft, as shown in Figure 1, and the radon measurement which was mounted on the side of the gondola opposite the generator. Air samples for the instruments in the gondola were taken through an inlet locatedjust below the PMS OPC instrument (1.8 m below the nose of the airship) through a 6.3-cm-diameter Teflon tube 20 m long. The airflow through
to deploymentindicated the loss of SO2 in the tube, at the stated airflow, was too small to observe, as was the loss of
particles larger than 0.01-/am radius. There was a small (---10%) loss of particles at the lower limit (0.005/am) of the differential mobility analyzer (DMA). This is less than the diffusion loss of particles in the DMA. However, the loss within
the DMA
is accounted
for
in the
data
inversion
thetubewasabout0.57m3 s- 1resulting in a residence time scheme, whereas no correction for the tube loss has been in the tube of less than 6.5 s. Laboratory measurementsprior
Table 1.
applied.
Airship Instrumentation Instrument
Range/Sensitivity Aerosol
NRL DMA size spectrometer Optical size spectrometer(PMS CSASP-100HV) TSI condensationparticle counter (3022)
Trace
0.005 < R < 0.6 0.30 < R < 25 90% Det. at R = 0.0075 50% Det. at R = 0.003 Gas
o. 1 ppb 2.0 ppb 1.0 ppb
SOz analyzer (TECO model 43S) NOx analyzer (Dasibi model 2108) Ozone (Dasibi model 1008) Supporting Radon (as air mass tracer)
I pCi m-3
Pressure
3 mbar 0.2øC 0.3øC 0.5øC
Temperature Dew point temperature (General Eastern 1200 APS) IR Surface Temperature (Everest model 4000 ALCS) Three-wavelength nephelometer (NOAA)
10-7 m-l
NRL, Naval Research Laboratory; DMA, differential mobility analyzer.
HOPPEL ET AL ßMARINE
BOUNDARY
LAYER
To remove cloud droplets from the air sample, a virtual 1000 impactor which removed particles larger than 6.5 /am (cut radius for 90% removal efficiency) was located at the entrance of the tube. A heater just after the impactor assembly 800 raised the temperature of the air 3øC to reduce the relative humidity and prevent condensationin the tube. In retrospect, the 6.5/am was not a good choicefor the cut size. In some clouds, especially those of continental origin having E 600 high CCN concentrations,the cloud droplet spectrapeaked at radii as small as 6- to 7-/am radius. In these cases a significant number of cloud droplets escaped removal, reevaporated, and reappeared as (interstitial) aerosol. For the U--- 400 casesdiscussedin this paper the cloud droplets were large