AQUATIC MICROBIAL ECOLOGY Aquat Microb Ecol
Vol. 69: 59–67, 2013 doi: 10.3354/ame01622
Published online April 17
Marine fungi may benefit from ocean acidification Evamaria Krause1,*, Antje Wichels1, Luis Giménez2, Gunnar Gerdts1 1
Alfred Wegener Institute for Polar and Marine Research, Biologische Anstalt Helgoland, Kurpromenade 201, 27498 Helgoland, Germany 2 School of Ocean Sciences, Bangor University UK, Askew Street, Menai Bridge, Anglesey LL59 5AB, UK
ABSTRACT: Recent studies have discussed the consequences of ocean acidification for bacterial processes and diversity. However, the decomposition of complex substrates in marine environments, a key part of the flow of energy in ecosystems, is largely mediated by marine fungi. Although marine fungi have frequently been reported to prefer low pH levels, this group has been neglected in ocean acidification research. We present the first investigation of direct pH effects on marine fungal abundance and community structure. In microcosm experiments repeated in 2 consecutive years, we incubated natural North Sea water for 4 wk at in situ seawater pH (8.10 and 8.26), pH 7.82 and pH 7.67. Fungal abundance was determined by colony forming unit (cfu) counts, and fungal community structure was investigated by the culture-independent fingerprint method Fungal Automated Ribosomal Intergenic Spacer Analysis (F-ARISA). Furthermore, pH at the study site was determined over a yearly cycle. Fungal cfu were on average 9 times higher at pH 7.82 and 34 times higher at pH 7.67 compared to in situ seawater pH, and we observed fungal community shifts predominantly at pH 7.67. Currently, surface seawater pH at Helgoland Roads remains > 8.0 throughout the year; thus we cannot exclude that fungal responses may differ in regions regularly experiencing lower pH values. However, our results suggest that under realistic levels of ocean acidification, marine fungi will reach greater importance in marine biogeochemical cycles. The rise of this group of organisms will affect a variety of biotic interactions in the sea. KEY WORDS: pH reduction · F-ARISA · Helgoland Roads · Microcosms Resale or republication not permitted without written consent of the publisher
Both filamentous fungi and unicellular yeasts are widely distributed in marine environments. They have been reported from coastal, open ocean and deep-sea waters, as well as from salt marshes and mangroves, and colonize a variety of substrates (Gao et al. 2010, Jones 2011). Due to their ability to degrade complex substrates such as lignocellulose and calcareous structures, they are important decomposers of herbaceous and woody remains and animal carcasses in the seas (Newell 1996, Hyde et al. 1998, Richards et al. 2012). Furthermore, a variety of symbiotic and pathogenic interactions of fungi with algae and the marine fauna have been reported (Hyde et al. 1998, Richards et al. 2012). Planktonic fungi are particularly abundant in coastal surface waters, with
diversity and abundance being positively correlated to phytoplankton biomass (Gao et al. 2010, Gutiérrez et al. 2011). Together with prokaryotes, planktonic fungi mediate the decomposition of particulate to dissolved organic matter and are capable of releasing nutrients from recalcitrant material (Wang et al. 2012). However, their role in marine biogeochemical cycles is not completely understood, and their importance as degraders of organic matter in marine ecosystems as well as their diversity may have been greatly underestimated (Gao et al. 2010, Gutiérrez et al. 2011, Jones 2011, Amend et al. 2012, Wang et al. 2012). Since the industrial revolution, seawater pH has dropped by 0.1 units, and may decrease by a further 0.7 units within the next 3 centuries (Caldeira & Wickett 2003). Concerning heterotrophic microbes,
*Email:
[email protected]
© Inter-Research 2013 · www.int-res.com
INTRODUCTION
Aquat Microb Ecol 69: 59–67, 2013
60
the consequences of ocean acidification have mainly been discussed for bacterial processes and diversity (Liu et al. 2010, Joint et al. 2011). While bacterial numbers seem to be unaffected (Allgaier et al. 2008, Krause et al. 2012), experiments predict changes in bacterial growth efficiency, carbon assimilation and extracellular enzyme activity (Grossart et al. 2006, Liu et al. 2010, Piontek et al. 2010, Teira et al. 2012). However, marine fungi have been neglected in previous ocean acidification studies. The majority of fungi cannot take up particles by phagocytosis and rely on osmotrophic feeding, i.e. they release extracellular enzymes to break down complex polymers and take up monomers by transport through the plasma membrane (Richards et al. 2012, Wang et al. 2012). This transport is driven by their plasma membrane potential, which primarily depends on the H+-electrochemical gradient (Davis 2009, Orij et al. 2011). In neutral to alkaline environments, establishing this gradient is challenging and limits fungal growth (Davis 2009, Orij et al. 2011). A reduction in pH may consequently relieve pH stress on marine fungi. A similar benefit from moderate pH reductions was recently discussed for marine bacteria (Teira et al. 2012). In the present study, we carried out acidification experiments in microcosms in spring 2011 and 2012 with the natural fungal community from Helgoland Roads, North Sea. We show that even small reductions in seawater pH directly affect fungal abundance and community structure and discuss results in relation to the natural pH variability at the study site.
MATERIALS AND METHODS
and 8°C in 2012). Jars were mixed daily by inversion, and 5 replicate jars per treatment were analysed each week.
Colony forming units (cfu) After 2 and 4 wk, we determined fungal abundance by cfu counts at 7 to 8°C (in situ temperature) and at 18°C (average of the yearly maximum seawater temperature at Helgoland Roads, calculated as the mean of the upper 10% of temperatures recorded at the study site from 2000 to 2010; data obtained from the Helgoland Roads time-series, Wiltshire et al. 2008). We chose these temperatures to find out whether different fungal groups (coldadapted versus warm-adapted) were present and reacted differently to pH. Samples from the initial seawater sample (10, 100 and 500 ml) and from the experiment (10 and 100 ml) were filtered through sterile nitrocellulose filters (0.45 µm pore size, 47 mm diameter, grey with grid; Sartorius) applying low pressure (100 mbar). Filters were placed onto Wickerham’s YM agar (0.3% yeast extract, 0.3% malt extract, 0.5% peptone, 1.0% dextrose and 2.0% agar, pH 6.2), prepared with sterile-filtered seawater from the sampling site and supplemented with 250 mg l−1 chloramphenicol (Sigma) to prevent bacterial growth. Furthermore, samples of 500 µl were directly plated onto Wickerham’s YM agar plates by spreading with glass beads. Triplicate samples of each volume were incubated at both temperatures in the dark. After 4 to 5 d (18°C) or 12 to 16 d (7 or 8°C), all filamentous and yeast-like colonies were counted by eye.
Experimental set-up We collected water at the Helgoland Roads station (54° 11.3’ N, 7° 54.0’ E) on 14 April 2011 and on 3 May 2012. The station is located near the island of Helgoland, approximately 50 km off the German coast in the North Sea. Seawater samples were incubated either at the current in situ seawater pH (8.10 in 2011 and 8.26 in 2012) or adjusted to pH 7.82 or 7.67 with 2 M HCl. The mean surface pH in the southern North Sea may reach these values at 700 or 1000 ppm of atmospheric CO2, respectively (Blackford & Gilbert 2007). Per pH treatment, we incubated water samples in 20 replicate 1.6 l glass jars (acidwashed, autoclaved) with air-tight rubber seals. Jars were incubated in the dark over a period of 4 wk at in situ temperature on the day of sampling (7°C in 2011
Community DNA extraction and Fungal Automated Ribosomal Intergenic Spacer Analysis (F-ARISA) In a cultivation-independent approach, DNA from filter-enriched biomass of the microcosms was directly extracted and subjected to community analysis by F-ARISA (Ranjard et al. 2001). Volumes of 800 ml were filtered through sterile nitrocellulose filters (0.45 µm pore size, 47 mm diameter, grey with grid; Sartorius). A quarter of each filter was suspended in 700 µl STE buffer (6.7% sucrose, 50 mM Tris-HCl, 1 mM EDTA, pH 8) with 200 µl of a mixture of 0.1 mm zirconia/silica and 1.0 mm zirconia beads (BioSpec Products). Mechanical lysis was performed using a FastPrep® FP120A Instrument (Qbiogene) for 40 s at 6.0 m s−1. DNA extraction was performed
Krause et al.: Ocean acidification effects on marine fungi
as previously described (Sapp et al. 2007), omitting the lysozyme step and using an increased cell lysis temperature of 65°C. DNA concentration and purity were determined by photometry using an Infinite 200 PRO NanoQuant (Tecan). To determine whether the different incubation temperatures selected for different fungal populations, DNA from bulk cfu filters with mycel was extracted and analysed by F-ARISA (only in 2011; filters with 100 ml sampling volume). After 5 d (18°C) or 13 d (7°C), cfu filters were removed from the agar plates and cut into quarters. Each quarter was subjected to mechanical lyses as described above. Lysates of the 4 quarters of each filter were combined and an aliquot of 500 µl was used for DNA extraction. DNA from bulk cfu filters with mycelium was additionally purified with the GENECLEAN® Turbo Kit (Qbiogene). We amplified the ITS1-5.8S-ITS2 region using forward primer 2234C (5’-GTT TCC GTA GGT GAA CCT GC-3’) and reverse primer 3126T (5’-ATA TGC TTA AGT TCA GCG GGT -3’; Ranjard et al. 2001), the latter labelled with an infrared dye. PCR reactions (25 µl) contained 50 ng template DNA, 2.5 µl Taq Buffer (10×), 0.56 µM of each primer, 300 µM dNTPs and 1.4 U Taq DNA polymerase (5 Prime). Cycling conditions were: 94°C for 3 min, followed by 30 cycles of 94°C for 1 min, 55°C for 30 s and 68°C for 1 min, with a final step at 68°C for 5 min. Separation of PCR products using a LI-COR 4300 DNA Analyzer (LI-COR Biosciences) and analysis of gel images with the Bionumerics 5.10 software (Applied Maths) were carried out as previously described (Krause et al. 2012). Community structure was analysed based on the Jaccard coefficient.
Statistical analyses The experiment was based on a crossed factorial design. To prevent bias by the lack of some data in 2011, we analysed the 2 years separately. For community structure analyses, the experimental factors were Week (fixed) and pH (fixed). For analysis of cfu l−1, additional factors were Temperature (fixed) and Jar, nested in the interaction Week × pH and considered as a random factor. Fungal abundance was analysed through factorial ANOVAs with Statistica 7.1 (StatSoft), using Tukey’s HSD test for post-hoc comparisons. Community structure was analysed by permutational multivariate ANOVA (PERMANOVA). To visualise patterns of the influence of pH, we performed principal coordinate analysis (PCO). For all
61
multivariate analyses, we used Primer 6 with the add-on package PERMANOVA+ (PRIMER-E).
Determination of pH, total alkalinity (TA) and calculation of pCO2 We used a ProLab 3000 pH meter with an IoLine pH combination electrode with temperature sensor (type IL-pHT-A170MF-DIN-N). The electrode was calibrated with standard buffer solutions from freshly opened glass ampoules (pH 4.01, 6.87, 9.18; all materials: SI Analytics), i.e. we measured pH on the National Bureau of Standards scale (pHNBS). During the experiments, all pH measurements were carried out at incubation temperature. Samples for TA were 0.45 µm filtered, stored in 100 ml borosilicate bottles with Teflon-inlet at 5°C and analysed within a week. We estimated TA by open-cell duplicate potentiometric titration and calculation with modified Gran plots (Bradshaw et al. 1981), using a TitroLine alpha plus titrator with an IoLine pH combination electrode with temperature sensor (type IL-pHT-A120MFDIN-N). The electrode was calibrated with technical buffer solutions from freshly opened glass ampoules (pH 4.0, 7.0; all materials: SI Analytics). Values were corrected with Certified Reference Material (CRM, Batch No. 104, Scripps Institution of Oceanography). For calculations of pCO2, we converted pH values to the total scale, using Tris-based reference material (Batch No. 5, Scripps Institution of Oceanography). Calculations were done with the program CO2calc (Robbins et al. 2010), using dissociation constants of carbonic acid of Mehrbach et al. (1973), refit by Dickson & Millero (1987), and dissociation constants for H2SO4 from Dickson (1990). Carbonate system parameters prior to and during the experiment are reported in Appendix 1.
Determination of the yearly pH cycle at Helgoland Roads We determined surface pH at Helgoland Roads 5 times a week from September 2010 to September 2011. Samples were taken between 06:00 and 10:00 h. Seawater temperature was measured on board the research vessel and was obtained from the Helgoland Roads time-series (Wiltshire et al. 2008). Samples were immediately brought to our laboratories at Helgoland Marine Biological Station, and pH was measured at seawater temperature using a thermostat bath.
Aquat Microb Ecol 69: 59–67, 2013
62
RESULTS AND DISCUSSION Fungal abundance In the seawater samples, we observed 88 ± 2 cfu l−1 (mean ± SD) in spring 2011 and 34 ± 5 cfu l−1 in spring 2012. Higher fungal abundance in 2011 may be explained by higher overall phytoplankton abundance on the sampling day in that year (8.5 × 10⁶ cells l−1 in 2011 versus 2.4 × 10⁶ cells l−1 in 2012; data obtained from the Helgoland Roads time-series, Wiltshire et al. 2008). Quantitative estimates of marine fungi ranged from 107 cfu l−1, with highest numbers reported from productive coastal areas (Gao et al. 2010, Wang et al. 2012). Compared to these numbers, initial fungal abundance in our experiments was low, but a direct comparison to other sites is difficult as no standard counting methods exist (Gutiérrez et al. 2011). Furthermore, fungal spores of terrestrial origin introduced by water runoffs or winds may form colonies on agar plates,
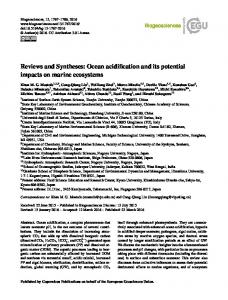
although they are not able to actively grow in seawater (Coelho et al. 2010). During the experiment, fungal numbers greatly increased, indicating active growth, and we observed a strong influence of pH. We counted up to 1.2 × 10³ cfu l−1 at pH in situ, up to 1.6 × 10⁴ cfu l−1 at pH 7.82 and up to 9.0 × 10⁵ cfu l−1 at pH 7.67 (Fig. 1). Factorial ANOVAs (Table 1) revealed that the factor pH significantly influenced cfu l−1 in both 2011 (F2,118 = 3151, p < 0.001) and 2012 (F2,118 = 2480, p < 0.001). Temperature had a significant effect on community structure on bulk cfu filters with mycelium (PERMANOVA, p (perm) < 0.001; this was only done in 2011), hinting at the presence of distinct cold- and warm-adapted groups. The pH effect on the abundance of both groups was comparable, because for both temperatures, cfu l−1 were always significantly higher at pH 7.82 and 7.67 than at pH in situ (Fig. 1, Tukey’s HSD test, 118 df). On average, cfu l−1 were 8 to 9 times higher at pH 7.82 and 34 times higher at pH 7.67, compared to pH in situ. Results indicate that even
Fig. 1. Colony forming units per litre (cfu l−1) in response to pH. Letters indicate significant differences after Tukey’s HSD test, 118 df. For ANOVA test statistics, see Table 1. Data are means ± SD (N = 12 to 15 plates per pH). Note the different axis labelling for 2011, 18°C
Krause et al.: Ocean acidification effects on marine fungi
Table 1. ANOVA main tests of fungal abundance, estimated as colony forming units (cfu l−1). Displayed are tests for the factors Week, pH, Temperature, Jar and their interactions. p-values were obtained using type III sums of squares; significant results (p < 0.05) are highlighted in bold. To improve normality, cfu l−1 data were ln-transformed Factor
SS
df
MS
F
p
2011 Week 0.36 1 0.36 7.1 0.009 pH 319.87 2 159.93 3150.7 < 0.001 Temperature 207.84 1 207.84 4094.4 < 0.001 Week × pH 6.59 2 3.29 64.9 < 0.001 Week × Temp. 11.03 1 11.03 217.2 < 0.001 pH × Temp. 1.90 2 0.95 18.7 < 0.001 Jar (Week × pH)a 9.48 24 0.39 7.8 < 0.001 Week × pH × Temp. 17.58 2 8.79 173.1 < 0.001 Temp. × Jar 4.30 23 0.19 3.7 < 0.001 Error 5.99 118 0.05 2012 Week 26.457 1 26.457 378.2 < 0.001 pH 346.973 2 173.486 2480.3 < 0.001 Temperature 0.775 1 0.775 11.1 0.001 Week × pH 0.400 2 0.200 2.9 0.061 Week × Temp. 0.314 1 0.314 4.5 0.036 pH × Temp. 2.945 2 1.472 21.1 < 0.001 Jar (Week × pH)a 11.802 24 0.492 7.0 < 0.001 Week × pH × Temp. 0.239 2 0.119 1.7 0.186 Temp. × Jar 2.529 24 0.105 1.5 0.078 Error 8.254 118 0.070 a
The factor Jar is a random factor nested within Week × pH because we analysed each jar at only 1 time point but took more than 1 subsample jar−1. This factor had a significant effect in both years, demonstrating that there was variation between replicate jars, but note that the total variation (F ) explained by this factor was small
moderate acidification may lead to an increase in fungal abundance of almost an order of magnitude. A possible explanation is the lower energetic cost for establishing a functional plasma membrane H+-gradient. Additionally, altered extracellular enzyme activity may have played a role. For bacteria, higher activities of both protease and extracellular glucosidases were reported at low pH (Grossart et al. 2006, Piontek et al. 2010). In future studies, sizefractionated hydrolysis experiments (Gutiérrez et al. 2011) could yield insights on whether fungal enzyme activities are also affected.
Fungal community structure The cultivation-independent community analysis of filter-enriched biomass of the microcosms revealed that Year significantly influenced community structure, i.e. that different communities were present in
63
the 2 years of the experiment (PERMANOVA, p (perm) < 0.001). Furthermore, in both 2011 and 2012, community structure was significantly influenced by pH (both years: p (perm) < 0.001, Table 2). Looking at pH effects separately for each week, we predominantly observed significant differences between pH in situ and pH 7.67, but not between pH in situ and pH 7.82 (Fig. 2, Table 3). Thus, compared to changes in fungal abundance, a tipping point for community shifts was reached at a lower pH. A moderate pH reduction (7.82) may be generally beneficial for the fungal community, while at pH 7.67, interspecific differences in pH homeostasis mechanisms may become more pronounced, leading to compositional shifts.
pH variability at Helgoland Roads Microbes already experience large natural differences in pH, e.g. due to seawater depth or phytoplankton blooms (Joint et al. 2011). Thus to draw conclusions from ocean acidification experiments, it is important to take into account the natural variability at the respective study site (Hofmann et al. 2011). We daily determined surface seawater pH at Helgoland Roads over a yearly cycle from September 2010 to September 2011. We found that pHNBS was predomi-
Table 2. PERMANOVA main tests of fungal community composition separately for 2011 and 2012, based on Jaccard dissimilarities of F-ARISA profiles. Displayed are tests for the factors Week, pH and their interactions and the partitioning of multivariate variation. p (perm)-values were obtained using type III sums of squares and 9999 permutations under the full model. All results were significant (p (perm) < 0.05). Square root of the component of variation attributable to that factor in the model is shown, in units of Jaccard dissimilarities Sources of variation
df
SS
Pseudo F
p (perm)
Square root
2011 Week pH Week × pH Residuals Total
3 2 6 39 50
50647 8.824 8686.2 2.270 18888 1.645 74619 1.56 × 10⁵
< 0.001 < 0.001 < 0.001
35.213 12.322 17.31 43.741
2012 Week pH Week × pH Residuals Total
3 2 6 48 59
35056 5.086 13966 3.039 20426 1.482 1.10 × 10⁵ 1.80 × 10⁵
< 0.001 < 0.001 0.001
25.017 15.306 14.878 47.932
Aquat Microb Ecol 69: 59–67, 2013
64
Fig. 2. Fungal communities after incubation at different pH levels. Principal coordinate ordination (PCO) plots of community structure for each Year−Week combination, based on Jaccard dissimilarities of F-ARISA profiles
Table 3. PERMANOVA pairwise comparisons of fungal community composition, based on Jaccard dissimilarities of F-ARISA profiles. Displayed are pairwise a posteriori comparisons of the factor pH within each week. Significant results (p (perm) < 0.05) are highlighted in bold Comparison
Week 1 pH in situ vs. 7.82 pH in situ vs. 7.67 pH 7.82 vs. 7.67 Week 2 pH in situ vs. 7.82 pH in situ vs. 7.67 pH 7.82 vs. 7.67 Week 3 pH in situ vs. 7.82 pH in situ vs. 7.67 pH 7.82 vs. 7.67 Week 4 pH in situ vs. 7.82 pH in situ vs. 7.67 pH 7.82 vs. 7.67
2011 t p (perm) (perm)
2012 t p (perm) (perm)
1.366 0.136a 1.711 0.008 1.269 0.201a
1.096 0.242 1.511 0.016 1.284 0.076
1.827 0.018 2.397 0.018a 0.964 0.453a
0.919 0.636 1.114 0.199 1.557 0.034
1.012 0.461 1.518 0.025 0.956 0.543
1.105 0.229 1.380 0.031 1.561 0.014
1.433 0.029 1.367 0.040 0.984 0.467
1.185 0.100 2.089 0.009 1.341 0.018
a
Less than 100 unique permutations; therefore, Monte Carlo p-values are given. All other combinations had at least 126 unique permutations per comparison
nantly > 8.1 (Fig. 3). Higher values of up to 8.4 were observed from mid-April until the end of May, presumably due to carbon uptake during the spring
Fig. 3. pH over a yearly cycle at Helgoland Roads. pH was measured at in situ temperature on the National Bureau of Standards (NBS) scale
bloom (maximum chlorophyll a on 26 April 2011: 15.4 µg l−1; data obtained from the Helgoland Roads time-series, Wiltshire et al. 2008). Afterwards, pH decreased to approximately 8.1 again, possibly because of decreasing primary production and dominance of respiratory processes in summer, as previously described for the southern North Sea (Thomas et al. 2004). Thus, although there are temporal pH variations at Helgoland Roads, values < 8.0 do not occur at present. We therefore cannot exclude the fact that fungal responses may differ in regions regularly experiencing lower pH values. However, our results
Krause et al.: Ocean acidification effects on marine fungi
indicate that the pH effects observed are of a general nature. Although different fungal communities developed in the 2 years of our study and cultivation at different temperatures hinted at the presence of fungal groups occupying different fundamental niches, the direct pH effect on fungal numbers was consistent. To resolve fungal identities, we are currently planning a 454 pyrosequencing approach.
Indirect effects of ocean acidification will also affect the abundance of fungi. First, increased primary production that may occur in response to higher CO2 availability (Riebesell et al. 2007, Liu et al. 2010, Joint et al. 2011) should be exploited by fungi. Second, fungal interactions with other marine organisms will vary because pH-stressed organisms will be more susceptible to fungal colonization, as previously described for corals (Vega Thurber et al. 2009). The fragile equilibrium between endolithic, i.e. calcareous substrate colonizing, fungi and their coral hosts is rapidly destroyed by environmental stressors (Golubic et al. 2005), which has so far mainly been discussed under the aspect of climate warming. Other marine organisms prone to fungal infection such as shellfish and crustaceans (Hyde et al. 1998, Wang et al. 2012) are also sensitive to ocean acidification. Thus in a more acidic ocean, less-resistant hosts may be faced with a higher number of opportunistic fungal pathogens. These possible indirect effects of ocean acidification on marine fungi and their interactions urgently need to be addressed in future studies.
Ecological implications An important implication of our study is the potential change in the relationship between bacterial and fungal abundance in a scenario of ocean acidification. Previous studies found no change in bacterial abundance with ocean acidification (Allgaier et al. 2008, Krause et al. 2012). Together with our results, this indicates that acidification may lead to an increased importance of fungi in microbial food webs. As fungi and bacteria occupy different niches in organic material degradation (Raghukumar 2004), biogeochemical cycles may be affected. Possibly, this may lead to increased nutrient availability, as fungi decompose complex substrates and mediate the reentry of organic matter such as essential amino acids, vitamins and polyunsaturated fatty acids to the food web (Richards et al. 2012). Recently, high seasonal contributions of fungi to microbial biomass and enzymatic activity have been reported for the Humboldt upwelling system off the coast of Chile (Gutiérrez et al. 2011). In periods of high productivity during upwelling events, fungal biomass equalled that of prokaryotes (Gutiérrez et al. 2011). Furthermore, > 90% of the hydrolysis of proteinaceous substrates was attributed to fungi, presumably accounting for up to 30% of the turnover of photosynthetic carbon (Gutiérrez et al. 2011). This demonstrates that planktonic fungi can play a major role in microbial food webs. A second important implication of our results concerns fungal interactions with organisms located at higher levels in the food web. Many fungi are opportunistic pathogens. In coastal areas with recreational beaches, high concentrations of fungi in seawater may pose a health hazard to humans (Vogel et al. 2007). In addition, marine fungi include parasites of various commercially important fish, crustaceans and shellfish, which affect both natural populations and aquaculture (Schaumann & Priebe 1994, Hyde et al. 1998, Ramaiah 2006). Therefore, our study points to the necessity of evaluating the risk of increasing fungal infections with ocean acidification.
65
Acknowledgements. Financial support was provided by Federal Ministry of Education and Research (BMBF, FKZ 03F0608B) through the project ‘Biological Impacts of Ocean ACIDification’ (BIOACID). We thank M. Boersma for fruitful discussions. We also thank D. Höhlig for her contribution to this study and the crew of the RV ‘Aade’ from the Alfred Wegener Institute of Polar and Marine Research Helgoland for sampling support.
LITERATURE CITED
➤ Allgaier M, Riebesell U, Vogt M, Thyrhaug R, Grossart HP
➤ ➤ ➤
➤ ➤
➤
(2008) Coupling of heterotrophic bacteria to phytoplankton bloom development at different pCO2 levels: a mesocosm study. Biogeosciences 5:1007−1022 Amend AS, Barshis DJ, Oliver TA (2012) Coral-associated marine fungi form novel lineages and heterogeneous assemblages. ISME J 6:1291−1301 Blackford JC, Gilbert FJ (2007) pH variability and CO2 induced acidification in the North Sea. J Mar Syst 64: 229−241 Bradshaw AL, Brewer PG, Shafer DK, Williams RT (1981) Measurements of total carbon dioxide and alkalinity by potentiometric titration in the GEOSECS program. Earth Planet Sci Lett 55:99−115 Caldeira K, Wickett ME (2003) Anthropogenic carbon and ocean pH. Nature 425:365 Coelho MA, Almeida JMF, Martins IM, da Silva AJ, Sampaio JP (2010) The dynamics of the yeast community of the Tagus river estuary: testing the hypothesis of the multiple origins of estuarine yeasts. Ant Leeuwenhoek 98:331−342 Davis DA (2009) How human pathogenic fungi sense and
66
➤
➤ ➤
➤ ➤
➤ ➤ ➤ ➤ ➤ ➤
➤
➤
➤ ➤ ➤
Aquat Microb Ecol 69: 59–67, 2013
adapt to pH: the link to virulence. Curr Opin Microbiol 12:365−370 Dickson AG (1990) Standard potential of the reaction: AgCl(s) + 1/2H2(g) = Ag(s) + HCl(aq), and the standard acidity constant of the ion HSO4− in synthetic sea water from 273.15 to 318.15 K. J Chem Thermodyn 22:113−127 Dickson AG, Millero FJ (1987) A comparison of the equilibrium constants for the dissociation of carbonic acid in seawater media. Deep-Sea Res A 34:1733−1743 Gao Z, Johnson ZI, Wang G (2010) Molecular characterization of the spatial diversity and novel lineages of mycoplankton in Hawaiian coastal waters. ISME J 4: 111−120 Golubic S, Radtke G, Le Campion-Alsumard T (2005) Endolithic fungi in marine ecosystems. Trends Microbiol 13:229−235 Grossart HP, Allgaier M, Passow U, Riebesell U (2006) Testing the effect of CO2 concentration on the dynamics of marine heterotrophic bacterioplankton. Limnol Oceanogr 51:1−11 Gutiérrez MH, Pantoja S, Tejos E, Quiñones RA (2011) The role of fungi in processing marine organic matter in the upwelling ecosystem off Chile. Mar Biol 158:205−219 Hofmann GE, Smith JE, Johnson KS, Send U and others (2011) High-frequency dynamics of ocean pH: a multiecosystem comparison. PLoS ONE 6:e28983 Hyde KD, Jones EBG, Leano E, Pointing SB, Poonyth AD, Vrijmoed LLP (1998) Role of fungi in marine ecosystems. Biodivers Conserv 7:1147−1161 Joint I, Doney SC, Karl DM (2011) Will ocean acidification affect marine microbes? ISME J 5:1−7 Jones EBG (2011) Are there more marine fungi to be described? Bot Mar 54:343−354 Krause E, Wichels A, Giménez L, Lunau M, Schilhabel MB, Gerdts G (2012) Small changes in pH have direct effects on marine bacterial community composition: a microcosm approach. PLoS ONE 7:e47035 Liu J, Weinbauer MG, Maier C, Dai M, Gattuso JP (2010) Effect of ocean acidification on microbial diversity and on microbe-driven biogeochemistry and ecosystem functioning. Aquat Microb Ecol 61:291−305 Mehrbach C, Culberson CH, Hawley JE, Pytkowicz RM (1973) Measurement of the apparent dissociation constants of carbonic acid in seawater at atmospheric pressure. Limnol Oceanogr 18:897−907 Newell SY (1996) Established and potential impacts of eukaryotic mycelial decomposers in marine/terrestrial ecotones. J Exp Mar Biol Ecol 200:187−206 Orij R, Brul S, Smits GJ (2011) Intracellular pH is a tightly controlled signal in yeast. Biochim Biophys Acta 1810: 933−944 Piontek J, Lunau M, Händel N, Borchard C, Wurst M, Engel A (2010) Acidification increases microbial polysaccha-
➤
➤ ➤
➤ ➤ ➤
➤ ➤
➤
➤
ride degradation in the ocean. Biogeosciences 7: 1615−1624 Raghukumar S (2004) The role of fungi in marine detrital processes. In: Ramaiah N (ed) Marine microbiology: facets & opportunities, Chapter 10. National Institute of Oceanography, Goa, p 91−101 Ramaiah N (2006) A review on fungal diseases of algae, marine fishes, shrimps and corals. Indian J Mar Sci 35: 380−387 Ranjard L, Poly F, Lata JC, Mougel C, Thioulouse J, Nazaret S (2001) Characterization of bacterial and fungal soil communities by automated ribosomal intergenic spacer analysis fingerprints: biological and methodological variability. Appl Environ Microbiol 67:4479−4487 Richards TA, Jones MDM, Leonard G, Bass D (2012) Marine fungi: their ecology and molecular diversity. Annu Rev Mar Sci 4:495−522 Riebesell U, Schulz KG, Bellerby RGJ, Botros M and others (2007) Enhanced biological carbon consumption in a high CO2 ocean. Nature 450:545−548 Robbins LL, Hansen ME, Kleypas JA, Meylan SC (2010) CO2calc — a user-friendly seawater carbon calculator for Windows, Mac OS X, and iOS (iPhone). Open-file Report 2010−1280. US Geological Survey, Reston, VA Sapp M, Wichels A, Wiltshire KH, Gerdts G (2007) Bacterial community dynamics during the winter-spring transition in the North Sea. FEMS Microbiol Ecol 59:622−637 Schaumann K, Priebe K (1994) Ochroconis humicola causing muscular black spot disease of Atlantic Salmon (Salmo salar). Can J Bot 72:1629−1634 Teira E, Fernández A, Álvarez-Salgado XA, García-Martín EE, Serret P, Sobrino C (2012) Response of two marine bacterial isolates to high CO2 concentration. Mar Ecol Prog Ser 453:27−36 Thomas H, Bozec Y, Elkalay K, de Baar HJW (2004) Enhanced open ocean storage of CO2 from shelf sea pumping. Science 304:1005−1008 Vega Thurber R, Willner-Hall D, Rodriguez-Mueller B, Desnues C and others (2009) Metagenomic analysis of stressed coral holobionts. Environ Microbiol 11: 2148−2163 Vogel C, Rogerson A, Schatz S, Laubach H, Tallman A, Fell J (2007) Prevalence of yeasts in beach sand at three bathing beaches in South Florida. Water Res 41: 1915−1920 Wang G, Wang X, Liu X, Li Q (2012) Diversity and biogeochemical function of planktonic fungi in the ocean. In: Raghukumar C (ed) Biology of marine fungi, Vol 53. Springer, Berlin, p 71−88 Wiltshire KH, Malzahn AM, Wirtz K, Greve W and others (2008) Resilience of North Sea phytoplankton spring bloom dynamics: an analysis of long-term data at Helgoland Roads. Limnol Oceanogr 53:1294−1302
Krause et al.: Ocean acidification effects on marine fungi
67
Appendix 1. pHNBS, total alkalinity and calculated pCO2 at the start of the experiment and after each week of incubation. pHNBS: pH measured on the National Bureau of Standards scale. Data are means ± SD (N = 5) pH
2011 pH in situ
pH 7.82
pH 7.67
2012 pH in situ
pH 7.82
pH 7.67
Editorial responsibility: Hans-Georg Hoppe, Kiel, Germany
Week
pHNBS
Total alkalinity pCO2 (µmol kg–1) (µatm)
Start 1 2 3 4 Start 1 2 3 4 Start 1 2 3 4
8.10 8.13 ± 0.00 8.12 ± 0.00 8.10 ± 0.02 8.09 ± 0.02 7.81 7.83 ± 0.01 7.81 ± 0.01 7.83 ± 0.01 7.79 ± 0.01 7.67 7.74 ± 0.05 7.70 ± 0.01 7.69 ± 0.02 7.69 ± 0.01
2362 2361 ± 4 2366 ± 5 2344 ± 17 2354 ± 21 2257 2255 ± 2 2235 ± 11 2239 ± 12 2242 ± 12 2206 2202 ± 14 2193 ± 2 2193 ± 4 2203 ± 9
456 446 ± 5 465 ± 5 495 ± 23 498 ± 21 892 905 ± 26 929 ± 36 936 ± 19 981 ± 26 1230 1109 ± 134 1208 ± 18 1268 ± 48 1246 ± 43
Start 1 2 3 4 Start 1 2 3 4 Start 1 2 3 4
8.26 8.21 ± 0.01 8.18 ± 0.01 8.16 ± 0.04 8.14 ± 0.01 7.82 7.79 ± 0.01 7.76 ± 0.01 7.74 ± 0.01 7.70 ± 0.01 7.67 7.65 ± 0.01 7.62 ± 0.01 7.61 ± 0.02 7.58 ± 0.01
2332 2328 ± 10 2328 ± 6 2329 ± 6 2327 ± 9 2154 2158 ± 7 2163 ± 12 2168 ± 13 2158 ± 8 2117 2119 ± 4 2099 ± 12 2138 ± 8 2113 ± 6
355 382 ± 11 397 ± 10 400 ± 42 406 ± 14 1000 999 ± 21 1052 ± 24 1060 ± 16 1139 ± 40 1395 1390 ± 47 1442 ± 37 1453 ± 61 1482 ± 46
Submitted: December 10, 2012; Accepted: February 19, 2013 Proofs received from author(s): April 1, 2013