Agricultural Issues Center University of California June 2005 PRELIMINARY DRAFT Please do not cite or quote
Marketing Institutions, Risk, and Technology Adoption Jenny C. Aker, Amir Heiman, Bruce McWilliams, and David Zilberman Preliminary draft - June 2005
Jenny C. Aker, Department of Agricultural and Resource Economics, Department of Agricultural and Resource Economics, University of California, Berkeley.
[email protected]. Amir Heiman, Department of Agricultural Economics and Management, The Hebrew University of Jerusalem, Rehovot, Israel, E-mail:
[email protected]. Bruce McWilliams, Instituto Tecnologico Autonomo de Mexico (ITAM) Rio Hondo, No. 1, Col. Tizapan San Angel, Mexico, D.F. 01000, Mexico, E-mail:
[email protected]. David Zilberman, Department of Agricultural and Resource Economics, University of California at Berkeley, Berkeley, California 94720-3310, E-mail:
[email protected].
Supported in part by the Agricultural Marketing Resource Center
Marketing Institutions, Risk, and Technology Adoption Jenny C. Aker1, Amir Heiman2, Bruce McWilliams3, David Zilberman4 and June 2005
Preliminary draft. Please do not cite or quote. Abstract: Marketing can be an important mechanism for farmers and traders to reduce risk inherent in the production and sale of agro-food products. Existing economic literature typically does not integrate these tools into adoption frameworks. The primary purpose of this paper is to integrate marketing tools used to reduce pre-purchase risks into the technology adoption framework. To do this, we first present an overeview of existing adoption models, and describe how these models can be modified to include risk. We then alter existing adoption frameworks to include marketing tools, including salespersons, advertising, demonstrations, and money-back guarantees (MBGs). We discuss the implications of this framework for existing policy mechanisms that are used to reduce farmers’ pre-purchase risk, and identify the ways in which this model could be applied to future research. Keywords: adoption, advertisement, demonstrations, diffusion, extension, marketing, risk.
Department of Agricultural and Resource Economics, Department of Agricultural and Resource Economics, University of California, Berkeley.
[email protected]. 2Department of Economics and Management, Faculty of Agriculture, Food and Environmental Science, The Hebrew University of Jerusalem.
[email protected] 3Instituto Tecnologico Autonomo de Mexico (ITAM).
[email protected] 4Department of Agricultural and Resource Economics, University of California, Berkeley.
[email protected]. 1
Draft
1. Introduction A high rate of technological change is a primary feature of modern agriculture (Schultz), and, to a large extent, is manifested by the adoption of new practices. While many of the studies in technology change originated in sociology, the pioneering work of Griliches (1957) spawned a large body of economic literature on technology adoption. The current economic literature on technological innovation describes,
measures and analyzes adoption patterns for both durable and non-durable goods, and identifies the role of factors such as risk, credit constraints and learning in affecting technological adoption for inputs. Of these, risk has been identified as an important factor affecting technological choices. To date, much of the
economic literature on technology adoption has focused on price, output and policy risk, but has failed to address the importance of pre-purchase risk, such as performance and personal fit risk,5 in affecting adoption. As pre-purchase risk is often associated with marketing, the economic literature on technology adoption has overlooked the potential for marketing activities in reducing risk as a barrier to input adoption. Nevertheless, marketing tools such as advertising, demonstrations, salespersons and money back guarantees (MBGs), are often used by private sector actors to address pre-purchase risk and to encourage adoption. Thus, while current economic literature aims to explain the impact of governmental policies (insurance, price support, subsidies) and institutions (tenure, contracting, extension) on adoption decisions, it largely ignores the role of the private sector’s marketing tools (money-back guarantees, demonstrations, warranties) that address many of the same issues. These private sector marketing efforts have played a crucial role in technological adoption.6 The absence of pre-purchase risk and private sector marketing efforts from current models may underestimate the demand for new technologies, and, as a result, bias policy recommendations or the estimated effects of commonly-used policy tools.
Performance risk is associated with a product’s nonperformance according to expectations, whereas personal fit risk is associated with concerns that the product will not meet needs of the individual adopter. 6 For most agro-food products in the United States and Europe, marketing represents a large share of total cost of product delivery from the producer to the final consumer. Marketing activities, specifically defined as those activities which are undertaken to ensure the product delivery from the point of production to the point of consumption”, are often undertaken by other actors in the agrofood chain, can represent approximately 10 to 70 percent of the final consumer prices. 5
2
Draft In this paper, we attempt to identify and address what we view as a critical lapse in current adoption models: specifically, the role of private-sector marketing efforts in inducing adoption. The primary purpose of this paper is therefore to develop a theoretical framework of technological adoption that incorporates marketing mechanisms. To do this, we first use the threshold model to analyze how heterogeneous firm characteristics, dynamic learning and firm-level behavior affect an individual’s decision to purchase a product, and the diffusion model to analyze aggregate adoption. We then introduce risk into these models in order to better understand the ways in which this variable affects technological adoption. We then turn to the marketing literature on technological adoption, and discuss the ways in which private-sector marketing mechanisms are used to minimize producers’ pre-purchase risk. We then incorporate these marketing tools into economic frameworks of technological adoption in order to model the ways in which such tools can induce adoption. Therefore, while this paper is primarily a survey of current technological adoption models under certainty, the incorporation of pre-purchase risk and marketing tools into these frameworks provides an important original contribution to this area of research, particularly the marketing literature. This framework has potentially important implications for policy-making centers in the agricultural sector. We find that, in designing policies and extension activities related to technological adoption, policymakers cannot ignore the marketing efforts of the private sector. Since policies and institutions interact with private sector marketing activities, adoption-enhancing policies must take these interactions into account. This implies that policymakers should either develop complementary approaches to private sector efforts or regulatory frameworks that ensure the safe and efficient delivery of these tools. This paper can therefore offer some insights into the efficiency of traditional adoption-enhancing policy mechanisms, such as extension activities, and provide some recommendations for more creative models of governmental support of technological adoption.
The rest of this paper proceeds as follows. Section 2 reviews the current economic literature on adoption and diffusion, and outlines the main components of current models. It also discusses the various sources of risk facing agricultural producers, including pre-purchase risk, and demonstrates how this type of risk can influence adoption. Section 3 provides an overview of the marketing literature on
3
Draft
adoption, and briefly discusses the types of marketing tools that are used to address risk. It then presents a theoretical framework that incorporates private sector marketing efforts into current adoption models. Section 4 outlines the policy implications of this framework, specifically focusing on potential interaction between public and private-sector actors, and potential complementarities between the two. Section 5 summarizes and concludes.
2. Technology Diffusion and Adoption Models: A Critical Review Technological change is often associated with modifications in the production function that alter the relationship between inputs and outputs, rendering them more technologically efficient. This often results in improved production efficiency and implies increased profit maximization for users of the new technology. Nevertheless, we often observe producers who fail to adopt an efficiency-enhancing technological input. If a technology potentially increases profits, why doesn’t everyone adopt? What are the factors that contribute to or constrain adoption? In this section, we introduce the basic diffusion and threshold adoption models and show how they relate to each other. Then, we demonstrate how these
models can be modified to incorporate risk and to measure its effects on technology adoption.
2.1. Modeling Adoption and Diffusion: The Imitation and Threshold Models Much of the economic literature on technology adoption distinguishes between adoption and diffusion. While adoption models analyze an individual producer’s decision as to whether (and to what extent) to use a new technology, diffusion models analyze aggregate adoption behavior, or aggregate demand for a product or technology (Feder, Just and Zilberman 1985, Thirtle and Ruttan 1987). Beyond the individual and aggregate-level distinction of adoption and diffusion, however, both frameworks incorporate key factors affecting technological adoption in different ways. While the details of these distinctions will not
4
Draft be addressed in this paper,7 this section outlines the key components of the imitation and threshold models of adoption, and specifically addresses the role of risk in the adoption process.
2.1.1. The Imitation Model Much of the economic research on technological adoption relies upon the assumption of an Sshaped diffusion curve. One explanation for this phenomenon views diffusion as a process of imitation, whereby a producer (or “consumer” of the new technology) learns about a product via wordof-mouth or by observation (Mansfield 1961). Mansfield considers the case of an industry consisting of identical producers, whereby adoption occurs after a “successful interaction” between a previous buyer
and potential adopters.8 The likelihood of interaction is therefore assumed to be proportional to the number of adopters, but the potential interaction decreases with the reduction in the number of potential customers. The components of the basic imitation model can be represented as follows. Let N represent the potential number of total adopters, Xt be the cumulative number of buyers who have adopted the new technology by time t, and b be the acceleration factor that represents the probability that an adoption will occur after a non-buyer meets a buyer.9 The probability of interaction between adopters
"
and non-adopters is the product of realized diffusion (Xt) and unutilized diffusion potential $ 1 !
#
7Adoption
Xt % . N '&
and diffusion models have three primary differences: the role of information and learning, the shape of the aggregate adoption curve, and empirical approaches. Some adoption models have treated learning as an element that affects the expected benefits of the product (Stoneman 1975), incorporating Bayesian updating into the basic model. In contrast, the diffusion literature emphasizes the role of information in aggregate adoption, focusing on the distinction between external information (such as advertising or extension), and internal information (such as word-of-mouth). The diffusion framework assumes that the marginal productivity of external information decreases over time, implying that the impact of informing early adopters about a new technology is much larger than the impact from informing late adopters (Kalish 1983, Muller and Dobson 1987, Mahajan, Muller and Bass 1990). In this sense, the dynamics of diffusion and the certain adoption models are consistent. A second distinction between the adoption and diffusion models is the shape of the aggregate adoption curve. In the diffusion model, the mathematical formulation of the problem always leads to an S-shaped diffusion curve. In the adoption model, however, the shape of the aggregate adoption curve depends upon the particular mathematical formulation. Mahajan and Peterson, Stoneman (1981) and Stoneman and Irlend studied a variety of density functions and analyzed the conditions under which an S-shaped diffusion curve would result. For example, the threshold model with a uniformly-distributed source of heterogeneity yields an S-shaped diffusion curve, but this does not always have to be the case. Finally, the diffusion model requires more limited data, as aggregate adoption statistics can be used. Most adoption models require individual observations and must be estimated using logit and probit estimations. 8 Mansfield defined a “successful interaction” as a meeting between a buyer and a non buyer, whereby information is transmitted in a positive manner.
5
Draft
New adoption in period t, which is the change in aggregate adoption in that period, is represented by the following equation:
1tttXXXbXtN!"#==$%&!'(& (1) •
where X is the change in X with respect to time. Solving this dynamic equation for Xt results in an S-shaped diffusion curve: ()11abttXNe!!+"#=+
%$(2)
,
where a is a constant that determines the level of initial adoption at t=0. Griliches (1957) demonstrated empirically that profitability can accelerate and expand the diffusion process, since higher relative profits from using a new technology will result in a higher b and N.10 The main shortcoming of the imitation model is that it does not explicitly model the buyer’s microeconomic decision-making process for adopting a new technology, which can offer key insights into different rates of adoption. In addition, in this model, potential adopters are assumed to be homogeneous, whereas heterogeneity can play a significant role in an individual’s decision to adopt. In the absence of a microeconomic decision-making process, it is impossible to derive a precise optimization path for the economic variables endogenous to technology adoption using the imitation model.
2.1.2. The Threshold Model The threshold model introduced by David (1975) attempted to address the shortcomings of the imitation model. The basic threshold model incorporates three elements into the adoption process (cite): micro-level optimization behavior, such as profit maximization, (expected) utility maximization or In this section and throughout the paper, we will use buyer/adopter and non-buyer/non-adopter in interchangeably. For the purposes of this paper, buyers or adopters will be agricultural producers who are adopting a technology (or non-durable good). 9
6
Draft
dynamic optimization; a source of heterogeneity that distinguishes among individual units’ behavior, such as farm size, land or water quality, human capital and levels of risk aversion; and a dynamic process, such as learning-by-doing or learning-by-using. A primary contribution of the threshold model is its consideration of heterogeneous adoption behavior at the micro level. Each unit may decide to adopt a technology at time t, based upon a “threshold” level of heterogeneity that separates adopters from non-adopters. Diffusion in each period is therefore determined by aggregating over all agents who decide to adopt, conditional on the micro-level threshold criteria. This criteria may vary over time, as a result of changes in the cost of the technology, the output price of the final product, and other dynamic factors. A simplified example of the threshold model can be presented as follows. Assume that producers follow a static optimization rule in choosing between two technologies: the traditional (existing) technology, whose profits are known; and the new technology, which on average yields higher profits but also results in higher risk (i.e., higher variance). In this example, we assume that the source of heterogeneity is producers’ land
()01hLdL!=" size.11 Let L be the farm size whose density distribution is denoted by h(L), so that
. Suppose
that the traditional technology results in a net present value of profits per acre of ! 0 . Adoption of the new technology increases the net present value of profits per acre to ! 1 (t) , but also increases the per period fixed costs by P(t), where P(t) represents the cost of the technology. Let
()()10tt!!!"=#
represent the per
acre gain from technology adoption. Without loss of generality, we assume that producers are price-takers
Bass (1969) used the hazard concept to modify the approach outlined in equation (1), allowing for external adoption (i.e., self motivated adopters) as well as internal adoption. This is evident in the following ()tttXXXtabNXtN!"#==+$%&!'(& 10
()
equation: Although this example only considers farmer heterogeneity in land size, the literature recognizes many other dimensions in which producers can be heterogeneous, such as in human capital, environmental conditions, credit availability, and risk aversion (Feder, Just and Zilberman, 1985). 11
7
Draft and do not consider changes in output prices when maximizing profits.12 In period t, the threshold farm level
(L ) above which all farms will adopt is: * t
L*t =
(3)
P (t ) . "! (t )
If total diffusion at time t is measured as the proportion of all farmers who have adopted the new technology, then: !
(4) X t =
" h (L )dL .
L*t
( )
Adoption dynamics in this model are determined by a change in the threshold level of land L*t , which may be the result of two dynamic processes: learning-by-doing (LBD), which results in a reduction of the cost of the new technology ( P& (t ) < 0 ); and learning-by-using (LBU), which increases the adopters’ benefit from using the technology over time ( !&1 (t ) > 0 ). The shape of the density function (h(L)) and the rate of change of the critical level L*t will determine the shape of the diffusion curve.13 For simplicity, we assume that learning-by-doing and hence a declining price P(t) are the only source of dynamics in this model. New adoption at each period t is therefore: (5)
P& h L dL = $ ( ) & %! L*
* "
"
t
L*t
#L X& t = $ t #t
& h (L )dL
where equation (5) uses Leibnitz’s rule to determine the rate of change in the number of adopters in each period. Or, more simply, the probability that number of potential adopters exceeds the threshold level: N Pr[L> L*t ]. Variations of this model have been proposed since David’s initial model, modifying the sources of heterogeneity, optimization problems and dynamic processes. For example, Feder 12
Making profit-maximizing decisions dynamically consistent will not affect our basic results.
8
Draft
and Slade (1984) applied the model to the case of farmers considering how much land to allocate to a new technology. In this case, the authors used farmers’ prior assessment of the gains from the new technology and learning from previous adopters as the primary sources of farm-level heterogeneity, using a Bayesian approach to model farmers’ prior assessments. Shah, Zilberman and Chakravorty (1995) applied the threshold model to the case of the adoption of irrigation technologies, using land quality as the primary source of individual-level heterogeneity. The authors found that farmers with lower land quality were more inclined to adopt as the price of water increased. Finally, Stoneman and Irlend (1983) applied the threshold model to a generic case of technological adoption, using firm size as the source of heterogeneity. The authors found that larger firms were the first to adopt the cost-saving technology, and that a declining price of the technology and increasing cost of competing alternative inputs were the driving forces for continuous diffusion. While distinct in their approaches, the main insights of the threshold and imitation models are reconcilable. The imitation model attempts to provide a complete depiction of the diffusion process, and specifically focuses on the role of social networks, knowledge transfer and “imitation” in this process. This is particularly relevant in the real world, where individual producers are unable to continuously assess new technologies, and may be uninformed of the types of technologies that exist. Thus, the model implies that the process of imitation contributes to the transfer of knowledge that facilitates diffusion.14 In the threshold model, however, each individual is required to assess the new technology at the moment when the economic conditions are ripe for adoption, based upon the source of heterogeneity, the individual-level maximization problem and specific dynamic processes. The threshold model therefore requires a mechanism that induces farmers to adopt the technology at the appropriate time. This does not imply, however, that there is no
If the threshold level declines by a constant amount over time and the density function h(L) is unimodal, then the diffusion curve will be S-shaped. This implies that marginal diffusion will be increasing in the initial periods and decreasing in the later stages. 14 It is for this reason that agricultural extension activities concentrates their efforts on educating “early adopters” about a new technology in order to encourage adoption. Once early adopters employ the new technology, it is assumed that other farmers with similar characteristics are more likely to invest in evaluating the new technology. In this sense, there is an imitation process that triggers the dynamics of diffusion and is consistent with the threshold framework. 13
9
Draft imitation in the threshold model; in fact, the process of imitation is implicitly included in this model. Both models result in adoption relationships that are dynamic in nature and can be estimated.
2.2. Agricultural Risk and Adoption The current economic literature on technological adoption focuses on the factors that affect producers’ individual and aggregate adoption choices. In the imitation and threshold models, these factors include farm-level heterogeneity, which can include farm size, firm size, levels of risk aversion, prior beliefs and access to credit; optimization behavior, such as profit maximization or (expected) utility maximization; dynamics, such as learning-by-using and learning-by-doing; and knowledge transfer and imitation. An important implicit and explicit factor affecting technological adoption is risk. More recently, economic literature on technological change has focused on the various manifestations of risk associated with new technologies. In what follows, we provide an overview of the types of risk confronting producers, and briefly discuss how these risks can affect micro-level adoption decisions and aggregate diffusion. We then present a modified threshold model that incorporates risk.15
2.2.1. Risk 16 When we introduced the economic models of technology adoption, we discussed various factors that influence or constrain the adoption process. Here we classify those factors into three categories: constraints to adoption, knowledge and awareness, and risk. Producer constraints to adoption arise from a variety of economic and non-economic sources. For example, financial capital availability can be a constraint to adoption if farmers do not have the funds to purchase a new technology or are unable to secure a loan for it. Human capital may be a constraint to the adoption of specific technologies for which proper knowledge is important. Finally, farmers’ needs may
It is also possible to modify the threshold model by explicitly including learning and applying the model to durable (as opposed to non-durable) goods. However, these elements will not be pursued in this paper. 16 Although risk and uncertainty are distinct concepts in economic literature, at times we use the two terms interchangeably in this paper. 15
10
Draft constrain adoption if a new technology is not sufficiently flexible to meet the variety of agro-environmental conditions of potential adopters.17 In addition to constraints, producers’ awareness of a technology is clearly a precondition for its adoption. If the potential adopters are unaware of the existence or specific attributes of a technology, then there is little probability of adoption. A related concept is that of the manufacturers’ reputation or “goodwill” for a particular technological brand. If a manufacturer has established a reputation of high-quality products or services, then this will influence the producers’ adoption decision.18 As outlined above, recent economic literature on technology adoption has emphasized the
importance of risk in influencing a producer’s decision to adopt a new technology (Carlson and Morrison, ). Several authors have shown that risk-averse producers may decide to delay or avoid adoption of a technological input due to concerns over fluctuating input and output prices, yields, or governmental policies that could affect both (Sandmo 1971).19 The risks associated with technological adoption may arise from various sources. “Traditional” sources of risk have typically been defined as those factors affecting farmers’ (expected) profits, such as yield (output) risk, price risk and policy risk. The marketing literature identifies an additional source of risk that
can influence a producer’s adoption decision: pre-purchase risk. For example, producers may be uncertain about a product’s potential performance as a result of their lack of knowledge about the quality of the product and its attributes, particularly its reliability and durability. Similarly, a farmer may be aware that a product has performed well for others, but still be uncertain as to whether the product will fit his or her personal needs. And finally, uncertainty regarding future output and input prices can affect farmers’ profits and hence their decision to adopt. These types of risk and uncertainty fall into the broad category of “prepurchase risk”, as they are associated with risk prior to the producer’s decision to adopt. Two types of prePotential sellers of a new technology can address these constraints by using a variety of mechanisms, which will be discussed in later sections. For example, sellers may address capital availability constraints by providing loans to customers. In terms of human capital limitations, sellers can train potential customers in the use of the new technology, thereby speeding up the learning process. Finally, sellers may bundle different components of the technology to offer products that are particularly suited to different firms, thus attracting heterogeneous customers. 18 Sellers use advertisements to generate product awareness and affect consumer perception of their brands. 17
11
Draft purchase risk specifically defined in the marketing literature are performance risk and personal fit risk
(citation). While performance risk is associated with a product’s nonperformance according to the buyer’s expectations, personal fit risk is associated with the fact that the product might not meet the needs of the individual adopter.20 Let us consider two examples of personal fit risk in order to better clarify the ways in which such risk can affect adoption decisions. Consider a new software designed to optimize irrigation efficiency for a particular crop. If the technology is successfully adopted by the producer, it is expected to reduce water costs by 20 percent and improve yields by 3 percent. Nevertheless, even if forecasts about potential increases in the price of water are valid and the new system’s performance meets the producer’s expectations, a producer may still decide not to adopt the new technology. Why? If the farmer perceives the technology as being “too advanced”, this can increase his or her concerns that the technology may be used improperly and fail, thereby reducing expected benefits or increasing costs. The purchase of an automobile is an additional example of personal fit risk. If a consumer considers purchasing an unknown model of automobile, this can involve some uncertainty with respect to the car’s durability, performance and future market value. But the consumer might also ask questions such as: “How do I feel in the car? Is the car enjoyable? What does my spouse think about the car?” These concerns are related to personal fit risk, and can have an important impact upon the consumer’s decision to adopt. Consequently, a comprehensive model of technological adoption must incorporate both “traditional” and “market-oriented” sources of risk in order to fully understand individual-level adoption and diffusion of a new technology.
2.2.2. Incorporating Risk into the Adoption Framework In light of the importance of risk in adoption decisions, a comprehensive model of technological adoption requires the incorporation of different types of risk. To date, however, many of the economic
Traditional policy mechanisms to reduce these types of risk are price supports and other types of coupled and decoupled payments, insurance schemes, and the dissemination of information, particularly through agricultural extension services 20 Unlike traditional sources of risk, personal fit and performance risk cannot generally be resolved via price supports, insurance schemes, and information dissemination, and therefore other mechanisms are required to address them. 19
12
Draft models of adoption under uncertainty focus primarily on economic risk, as opposed to marketing risk.
Although the marketing literature discusses the importance of fit risk in adoption, the formal incorporation of this type of risk into the imitation and threshold models has been limited, primarily due to the difficulty of the approach. In this section, we first present a simplified model for incorporating pre-purchase risk (personal fit and adoption) into the adoption framework.21 We then discuss private-sector marketing efforts that are often used to address types of risk, and develop a model that explains the ways in which these marketing tools can affect individual-level adoption and diffusion. Incorporating risk into the imitation model of adoption has been pursued by a number of authors. Kalish (1983, 1985) and Kalish and Sen (1986) incorporate risk into Bass’ imitation framework by modeling the maximum number of adopters as a decreasing function of the level of risk and the technology’s price. In this model, risk is reduced through information exchange. A similar approach has been used by Wilson and Norton (1989), who modified the imitation model to study the timing of the adoption of second-generation technologies, using adopters of the first-generation technology as the information stock. Incorporating risk into the threshold model has been is somewhat easier. Not only can risk be included as part of the optimization behavior (by using expected utility as opposed to utility maximization), but it can also be incorporated as an element of producer heterogeneity and a source of dynamics. While the incorporation of risk into the threshold model has primarily focused on “traditional” sources of risk – such as price risk, yield risk and policy risk – the threshold model can be easily adapted to include personal fit and performance risk as well. A variety of approaches have been used to incorporate risk into the adoption framework, including the expected utility approach (Yassour, Rausser and Zilberman, Sandmo 1971, Feder 1980,
While there are a variety of approaches that could be used for this purpose, including expected utility (Feder, Just and Zilberman), the safety rule (Roumasset), dynamics (Pindick-Dixit) and prospect theory, we present a simple approach that is based primarily upon the expected utility approach. 21
13
Draft
Just and Zilberman 1983), the safety rule approach (Roumasset), prospect theory (Kahneman and Tversky 1979) and dynamics (Pindick and Dixit). We present a simplified framework incorporating risk into the adoption framework, based upon the expected utility approach. Nevertheless, we realize that there is a large body of work in this area, and that a variety of alternative approaches could also be used. We present two examples to illustrate the point and the tools that can be used, based upon the generalized expected utility approach and the mean-variance approach. Let us first use a simplified example using the expected utility approach to incorporate personal fit risk into the threshold model. Assume that a new technology is introduced. All potential adopters have the belief q that the new technology will fit and (1-q) that it will not.22 The additional benefits from adopting the new technology, conditional on the fact that it “fits” the individual producer, are the same as those outlined in the previous threshold model: in other words, BH = ! H " ! 0 , where BH is the net benefit from adopting the new technology conditional on the appropriate “fit”, written as the difference between total profits under the new technology (
) and profits under the old technology (
H
0
). In
general, we assume that BH is positive. If the technology does not “fit”, the benefits to the farmer are
BL = ! L " ! 0 , where BL is the net benefit from adopting the new technology, a function of total profits under the new technology conditional on a poor fit (
) and profits under the old technology (
L
0
). The
sign of BL is indeterminate, but it can be negative if the profits from the new technology are not as high as those from the previous technology. The expected net benefit of using the new technology is therefore: (6)
qLBH + (1 ! q ) LBL > P
As land is a simple source of heterogeneity, it can consequently be used to demonstrate this argument. Nevertheless, other sources of heterogeneity (such as farm size) could also be used. Note that we are implicitly assuming homogenous risk averseness across all farmers. 22
14
Draft
where L is individual-level farm size and P is the price of the new technology. Equation 6 is simply the expectation of the benefits of the technology, which must be greater than its cost (price) for the farmer to adopt. Without loss of generality, we assume that BH = 1 and BL = 0 . Substituting these values into equation (6) and totally differentiating with respect to L yields the following first-order condition: (7)
L* =
P q
which says that the optimal (threshold) farm level above which all farms will adopt is a function of the technology’s cost and the likelihood of personal fit. Note that the threshold farm level is not dependent upon the change in profits due to the new technology. Setting "! (t ) = BH = 1 , equation (3) becomes L* = P . In other words, the critical threshold farm size in equation (7) is greater than or equal to the critical threshold level calculated from equation (3), assuming that q ! (0, 1). This therefore implies that risk increases the threshold level of adoption due to concerns that the new technology will not fit the producers’ personal needs. Incorporating risk into the threshold model can be similarly modeled using a specific functional form, which allows us to use the mean-variance approach.23 In this case, assume that a farmer has L acres of land, and an indivisible technology exists that must be applied on the entire land. Let
be the annual gain per
acre from adopting the new technology and m be the annual cost of the technology. that is normally distributed with mean
and variance
2.
is a random variable
Assuming constant risk aversion, denoted by
and using the mean-variance approach, the farmer will adopt the new technology iff: (8)
1 µL " # L2$ 2 > m . 2
This quadratic equation yields two solutions:
The mean variance approach provides conditions under which the optimization of the expected profit (utility) function can be equivalent to the optimization of a linear function of the mean and variance of the equation. 23
15
,
Draft
L*1 =
(9a)
µ " µ 2 " 2#$ 2 m #$ 2
and
µ + µ 2 " 2#$ 2 m L = #$ 2 * 2
(9b)
*
*
From equations 9a and 9b, farmers with land size L, where L1 < L < L2 , will adopt the new technology. When farmers are risk averse, their expected net benefits of adoption are adjusted for risk and lie strictly below the expected benefits of the risk neutral farmer.24 These static models of adoption can also be used to analyze the dynamic considerations that lead to 2
changes in adoption over time. Suppose that µt and " t are the true mean and variance of gains per acre from purchasing a new technology. The farmer may not know these parameters, but has a perceived 2 expected gain of µˆ t and variance "ˆ t . If the farmer has a pessimistic initial perception, µˆ 0 will be lower than
the real expected gain of µ0 . As this farmer obtains more information about the technology’s performance, however, the perceived mean is likely to increase towards the true mean. In addition, we expect the farmer’s
( )
perceived variance "ˆ 0 initially to be much greater than the true variance, ! 02 , since he does not have t
much information about the product. As information about the product is collected over time, the perceived variance is similarly likely to decline. This learning process will reduce the critical size of the adopting farm. Feder and O’Mara (1982) and Stoneman (1981), modeled this updating of the mean and variance of profits as a Bayesian process, and showed that this updating can be a catalyst for the diffusion process. An example of risk and dynamics in the threshold framework is provided in Appendix 1.25
The results of this equation imply that mechanisms that reduce risk, such as price supports and extension, and mechanisms that reduce the price of the technology (m), such as credit subsidies, will increase the number of farmers willing to adopt. 25 By aggregating the adoption characterized in these models and introducing equations of motions for key parameters, these microlevel threshold models can lay the foundation for more sophisticated diffusion models. For example, Chakravorty et al. (cite) derived an S-shaped diffusion curve for modern irrigation technologies when land quality was the source of heterogeneity and there were increased water prices. If the dynamic processes that propel diffusion are deterministic, then the diffusion curve can be derived explicitly as a deterministic function. However, when the dynamics are affected by random processes, as in the Dixit-Pindyck (cite) framework, the diffusion curve is stochastic. For example, if adoption is affected by random shocks in output prices, then diffusion will be faster if periods of high prices occur earlier. Integration of the threshold and imitation models therefore reflect the current perspective in economic modeling. 24
!
16
Draft The literature discussed above recognizes the importance of various factors in fostering technological change and diffusion, including firm heterogeneity, rational choice, dynamics, learning, credit constraints, interaction among farmers and risk. However, these models have typically ignored pre-purchase risk, and the role of the private sector in affecting adoption. In the sections that follow, we will provide an overview of the marketing approach to adoption, and specifically highlight the role of the private seller in the adoption/diffusion process. Finally, we will discuss how marketing tools can be integrated into the models presented above.
3. Risk-Reducing Mechanisms and Adoption The current economic literature on adoption provides a partial explanation for the role of risk in the adoption process. These models are often used to develop policies that are used to minimize risk and encourage adoption. A common assumption of such policies is that extension is sufficient to trigger interaction between community members in order to transfer knowledge and maintain diffusion.26 Nevertheless, if risk is a crucial constraint to adoption, are such policies sufficient? Does the private sector play a role in minimizing risk and facilitating adoption? Rather than being the driving force behind the diffusion of new technologies in the agricultural sector, it may be better to characterize governmental activities as complementing those of the private sector.
The economic literature on technological adoption has focused primarily on traditional sources of risk, including yield, price and policy risk, in adoption choices. To date, much of this literature has recommended both institutional and policy solutions to address those risks, including subsidies (credit, export, transportation and exchange rate), price supports, crop insurance, inventory control and extension activities. Nevertheless, these mechanisms are often ill-suited to address risks related to performance and personal fit.
26Wolf
et al. found that farmers rely on multiple sources of information for their decision-making, and that private sources are at least as important to farmers as extension and other government sources. Private information sources process publicly provided information, so the public sector has a significant indirect effect on information available to farmers.
17
Draft Private marketing organizations often play a central role in facilitating the introduction and adoption of new technologies. These organizations can identify and target the market segments that are the most likely to adopt a new technology, increase awareness, facilitate and encourage the exchange of information, and assist individual decision-makers with their adoption choices. The private sector uses a variety of marketing mechanisms, such as advertising, demonstrations, salespersons and money back guarantees (MBGs), to
address both performance risk and personal fit risk.27 While these tools are the “bread and butter” of the marketing discipline, to date, much of the economic literature has ignored the role of private-sector marketing efforts in reducing barriers to adoption (Mahajan, Muller and Bass 1990). Consequently, these tools have not been incorporated into existing micro-level adoption models. This paper attempts to address this oversight by proposing a framework that incorporates these marketing tools into adoption framework. Using the models presented in equations 6-9, we first present the types of marketing tools that exist and the ways in which they address performance and personal fit risk. Then, in order to develop a more comprehensive model of technological adoption under risk, we develop a model that incorporates the effect of marketing tools on into the adoption model.28 To do this, we concentrate on durable products, 29 and focus primarily on the threshold model, as opposed to the imitation model. Since the imitation framework does not model individual decision-making, it lacks the structure needed to describe economic behavior, and in particular an individual actor’s reaction to the use of marketing tools.
We begin our analysis by first reviewing the marketing perspective on adoption, as described in the marketing literature. We then introduce the types of marketing mechanisms that can be used to
Marketing tools differ in both the stage of producer awareness of the technology and what they are trying to influence in the decision-making process. These aspects will be discussed in greater detail in Section 2.4.1. 28 While the model presented in this paper primarily focuses on the way in which marketing tools address the threshold level for adoption, it would also be possible to model the ways in which marketing tools affect producers’ demand for the technology, which therefore affect producers’ profits. This is outside of the scope of this paper, but is an area for future research. 29 We limit our discussion to the use of these tools for durables, and leave the analysis of non-durables for future research. Since the 27
model focuses on durable goods, adoption in period t, S(t), is simply modeled as the number of new adopters, X& (t ) . Throughout this paper, we assume that producers adopt when it is profitable to buy the technology, and that they do not act strategically. We also assume that adopters do not speculate future prices and do not wait for future price declines.
18
Draft
address different types of risk. And finally, we develop an adoption model incorporating these marketing tools, and compare the results to the adoption model without these tools.
3.1. A More Detailed Approach to Adoption: The Marketing Perspective The marketing perspective on adoption differs from the economic approach in that it places a greater emphasis on the gradual stages (or processes) of adoption for a new technology, as opposed to an individual decision-maker’s final decision to adopt. In general, the marketing literature models the buying (i.e.,
adoption) decision as a hierarchical process, whereby the consumer (producer) first learns about the product and then evaluates the alternatives before making an optimal choice (Robers and Lilien 1993, Wells and Prenskev 1996). Marketing behaviorists therefore divide the adoption decision into five hierarchal steps: product awareness, information-seeking and processing, evaluation, purchasing, and post-sale evaluations (Roberts and Lilien 1993, Wells and Prensky 1996, and Kotler 1993 and1997). At the first stage of this process, product awareness, producers become aware of a new technology through a variety of formal and informal information channels. During the second stage of the process, producers actively seek out information about the technology, either by visiting retail outlets, accessing public information, or asking knowledgeable cohorts.30 In the technology evaluation stage (Stage 3), producers evaluate the benefits and costs of the technology and its alternatives in order to develop preferences over the range of options. During the purchasing (adoption) stage, the producer decides to adopt a particular technology. Finally, during the fifth and final stage, the producer evaluates his or her satisfaction with the technology.31 Each one of these stages involves a level of risk for the producer, which can often be classified as either performance or fit uncertainty. Consequently, at each stage, the private sector can use a variety of This stage is also referred to as the “knowledge build up”, implying that the prospective adopter collects more precise information about the performance of the technology in order to determine whether it fits his/her needs. Economic and marketing literature recognize that consumers search and process information suboptimally, implying that they stop searching earlier than is optimal, thinking that they have accumulated sufficient knowledge. This is often the result of overconfidence or assigning subjective weights to prior beliefs or new information (Tverskey and Kahanman 1979, 1991, Thaller 1985, Viscusi 1989). Consequently, prospective adopters may feel that information obtained at this stage is sufficient to make their choice, even though it might reduce only part of their uncertainty. 30
19
Draft marketing mechanisms (or tools) to mitigate risk for the potential adopter and hence encourage adoption.32 These marketing tools are discussed in more detail in Section 3.2..
3.1. Marketing Tools and Their Role in Facilitating the Adoption of New Technologies In previous sections, we summarized the factors that affect the adoption of a new technology, and provided an overview of the marketing and economic perspectives on adoption. In these models, marketing mechanisms that influence risk – and hence adoption -- are considered to be exogenous factors in the adoption and diffusion process. Nevertheless, private sector marketing efforts are key factors that influence the adoption and diffusion of new technologies, and hence can be endogenous factors.
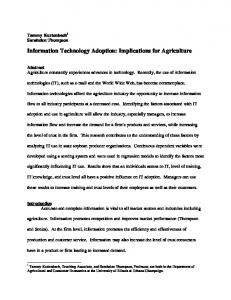
In order to navigate the producer through the adoption process, the seller can use an array of marketing tools to reduce the producer’s personal fit and performance risk. Since producers rely upon different cognitive processes at each stage of the adoption process, sellers therefore attempt to match the appropriate marketing instrument with the cognitive process. For example, during the “awareness” stage, the seller might supply information about the technology and its attributes, while at the same time attempting to generate sufficient interest in the technology. Conversely, during this stage a potential adopter might lack sufficient motivation to allocate cognitive resources to this information. A variety of marketing tools exist to reduce risk at each of the adoption stages outlined above. Marketing tools can be characterized according to their purpose and the stage of the adoption process at which they are used, as shown in Table 1. The primary types of marketing tools include advertising, demonstrations, money-back guarantees, warranties and salespersons. In this section, we discuss a subset of these marketing tools, and show how these tools can be used to influence technology adoption.
Consumer satisfaction is important in terms of the future purchasing patterns of the individual and the information he passes on to other potential adopters. 32 The technology manufacturer and marketer should be aware of the location of the consumer in terms of the buying hierarchy and identify the appropriate marketing tools with which to address his needs. For example, it is useless to promote marketing tools that provide detailed brand characteristics when the consumer lacks the required basic awareness of the product to be interested. 31
20
Draft For each marketing tool, we attempt to develop a model that incorporates the marketing tool into the technological adoption framework.
21
Draft
Table 1: Marketing Tools and their Use Mark eting Too l Advertisements Demonstrations and Trade shows
• • • • •
Money-back guarantees Warranties Renting and Leasing Credit
• • • •
Product training Salespeople
• • • • •
Main A pp licatio n Provide new information regarding prices, availability, location, etc. Form sensual attitude, goodwill. Enable consumers to try the product before purchasing, and thus reduce pre-purchasing risks. Provide opportunity for side-by-side demonstrations and comparisons. Facilitate interaction between sellers and buyers, and between users and potential adopters. Provide consumers with a return option and, therefore, reduce performance and fit uncertainty. Provide consumers with guarantees in the event of mechanical failure, thereby reducing performance risk. Provide alternative to purchasing. Allows smaller farmers to use, and uncertain farmers to test, the technology. Reduces transactions costs and financial constraints to purchasing. Increase the efficiency of use and consumer satisfaction; reduce probability of misuse. Increase consumer commitment to a particular brand. Fit product offer and selling strategy to consumer needs. Build long-term relationship. Negotiate, bargain and pressure to buy.
Adoptio n Stag e
•
Awareness (stage 1)
• •
Information search and evaluating alternatives (stages 2 and 3) Feedback (stage 5)
•
Purchasing decision (stage 4)
•
Purchasing decision (stage 4)
•
Alternative to purchasing decision (stage 4)
•
Purchasing decision (stage 4)
•
Evaluating alternatives (stage 3)
•
Product awareness to the purchasing decision and follow-up (stages 1 through 5)
Ad ve rtis in g
Advertising is a mechanism used to build potential producers’ awareness of the product by providing information about the price and promotions of the product, the expected benefits of the product, or other consumers who use it.33 In the agro-food marketing context, advertising can provide potential adopters with information on the technology and its traits, in addition to information about the types of guarantees offered. Advertising is often thought of as a latent stock variable, whose aggregate effect is one of “goodwill” – in other words, increasing the probability of adoption, primarily of the first adopters, who then interact with potential adopters. While advertising can be an effective marketing tool in terms of disseminating information, the ability of advertisements to target specific segments of the population is fairly limited. A seller will often try to identify and use the appropriate advertising channel, but in light of producer heterogeneity, this
22
Draft
might not always be possible or feasible. In addition, for “high-involvement” technology -- defined as technology that is expensive, of uncertain quality, and infrequently purchased -- there is an associated cost related to adoption. In this case, the information accumulated via advertising is often insufficient, and sellers need to use more intensive and precise marketing tools to overcome risk.34 And finally, the effectiveness of advertising as a marketing tool is often low when it is related to technology in which the adoption pattern takes the form of a “waterfall” (i.e., from the higher to the lower segment). The integration of advertising into the adoption framework originated with the seminal work of Stigler and Ozga (1960), who argued that there is an S-shaped relationship between advertising and adoption.35 In general, most studies have used the imitation model to examine the effect of advertising on technology adoption and diffusion (Mahajan, Muller and Bass 1990, Feichtinger, Hartl and Sethi 1994). For example, Horskey and Simon (1983) divided the potential adopting population into two segments – early adopters and imitators – where early adopters were influenced by advertisement, whereas imitators were influenced by hearing about the technology via word of mouth. Following their approach, the aggregate adoption (diffusion) curve is modeled as:
(10)
X$ ' X& = %a ( A) + b "[N ! X ] N# &
where A is the seller’s investment in advertising, X& (t ) is the number of new adopters, and N is the potential number of new adopters, as discussed previously. Multiplying equation (10) by e ! KP , where K is
a constant and P is the technology’s price, enables us to solve for the optimal price and level of advertising using the imitation model.36 Kalish (1985) models advertising as an external source of information, which provides general, non-segmented information that can reduce overall risk.37
The latter is related to opinion leaders, or those who are knowledgeable about a specific product category. In this case, MBGs and personal demonstrations may be used. While demonstrations are less expensive for the potential adopter and the seller, they also provide less information. 35 To date, much of the literature incorporating marketing tools into the adoption framework has focused on advertisements. The primary reason for this focus is that advertising can be modeled as an aggregate effect, which facilitates the analysis. 33 34
36
There are many variations on this model. In one case, advertising is modeled as an initial shock, i.e.,
a ( A0 ) where A0
is the
initial investment in advertising, initiating the diffusion process prior to and during time t=0. In this case, the aggregate adoption
23
Draft
These models, however, have four main shortcomings. First, adoption is carried out by an “average consumer”, who cannot be identified or targeted. Second, information is “flat” – in other words, the probability that a consumer will dislike the product and will spread negative information, or dislikes the advertising, cannot be easily incorporated into this sort of framework. Furthermore, these models do not adequately explain how advertising affects producers’ perceptions of benefits or risks of the new technology, and hence the decision to adopt. To overcome these shortcomings, the threshold framework can be used to capture the effects of advertising on risk perceptions and adoption behavior, thereby capturing the effects of targeted and nontargeted advertising on various market segments. As advertising can increase the potential adopter’s awareness about the technology and may provide critical information about its key characteristics, its benefits and costs, it can be an important source of information to complement information via word of mouth (as is the case in the imitation model). Although advertising has not been included in many of the threshold models, the threshold model can be modified by including an advertising “shifter” (f(⋅)) into equation (4) to represent the total proportion of population that has already adopted. The cumulative number of adopters
at time t therefore becomes: !
Xt =
(11)
f ( A(t ))h (L )dL
"
P (t ) L*t = q
In this case, f(A), a function of advertising, is simply an awareness coefficient multiplied by the population’s
distribution. The function f(⋅) represents the proportion of individuals who have adopted out of the total
curve is:
[
( ( A0 ) +$t )
Xt = k 1 + e" #
]
"1
. Nevertheless, it is often unreasonable to assume that advertising is limited to the initial
shock that triggers the diffusion process. Therefore, one can expand this approach to incorporate advertising as directly affecting adoption at all stages of the diffusion process. A more generalized equation of the imitation model may be given by: ( ( ) ( ) ) #1 X t = k A" 1+ e # $ A 0 + % a t t , where A! is the accumulated advertising throughout the diffusion process, and at is
( )[
]
advertising in period t. With this formulation, one can affect overall diffusion, k, as well as the dynamic accelerator ( "( at ) ). the customers are segmented into two groups: innovators and imitators. Another variation models advertising as affecting the potential number of adopters , i.e., N = N ( A) 37 Roberts and Urban (1987) use a mean variance utility function with Bayesian updating to include information in diffusion models, where the variance of the new information decreases proportionally to the number of adopters.
24
Draft population who should have adopted by time t (i.e., those producers with farms larger than the threshold size (Lt*)). f(⋅) depends on total advertisements up to and including time t, is increasing in A, and is bounded by 0 and 1 (i.e., 0 < f(A) < 1).38 Using this modified number of adopters, adoption at period t can therefore
be modeled as the change in diffusion as economic conditions push down the threshold level required for adoption: t !f ( At ) P& X& t = " h( L) + h( L)dL 39 q !t #0
(12)
Using the threshold model to include advertising therefore allows us to assume that, at any given moment, not all of the potential adopters above the threshold level (Lt*) will adopt the new technology due to lack of awareness. Demon strat ions an d Trade Show s Experiencing a technology first-hand can be convincing to the potential adopter. Demonstrations
are defined as a family of tools that enable a producer to experience the technology before purchase.40 Demonstrations can vary according to several characteristics, including length of time, the site, usage restrictions, accompanying trainings, and flexibility in usage. The more intensive the demonstration effort, the greater the information it provides, but the higher the cost. For example, demonstrations that are longer in duration or are held at the producer’s location are more expensive, but are also more accurate in terms of informational content. Demonstrations can therefore address a prospective
The function g(⋅) can be also include other elements besides advertisements, such as the other marketing tools discussed in this section. Consequently, g(⋅) provides a mechanism for integrating some of the desirable properties of imitation into the threshold model. 39 This equation could also be represented as the probability of the population greater than the threshold level, or Pr N(L> Lt*), where L is a function of information and hence advertising. 40 Demonstrations have a long history of use in agriculture. McCormick recognized the effectiveness of this marketing tool when he demonstrated the reaper to prospective customers in 1839, first using public demonstrations, and then providing one-on-one demonstrations (Gross, 1996). Trade shows may be considered an extension of demonstrations. They provide a forum for manufacturers to display their products to interested customers. Trade shows also provide an opportunity for participants to interact, facilitating communication between potential customers and those who have already adopted, thereby reducing the time of adoption for technologies that are considered successful. Finally, trade shows can enable sellers to interact with customers to better understand their needs, get feedback from previous adopters, and observe what competitors are doing. 38
25
Draft
adopter’s personal fit risk by ensuring that the producer has the opportunity to ensure that it meets his or her needs.41 Demonstrations can be incorporated into existing adoption models by using the threshold framework. Let us assume that the prospective adopter (producer) has some prior expectations regarding the probability of fit of the new product. To examine the effect of demonstrations, we consider the example
of adoption under risk with farm size heterogeneity, as modeled in equation (6). In the case of demonstrations, a producer can test the technology through a demonstration before adopting it. The probability that a producer discovers that the technology fits his or her needs is a function of the demonstration’s effectiveness, while the probability that the seller uses a demonstration as a marketing tool depends on its informational content and cost. Without loss of generality, we assume that all demonstrations are of equal effectiveness, and that with probability qD , a demonstration results in the producer discovering that the technology fits his/her needs, thereby reducing personal fit risk. Therefore, the probability that a producer will not buy (adopt) the technology after the demonstration is
(1 ! q )q D ; that is, the probability that the technology is a non-fit, and that this non-fit is discovered through the demonstration. The probability that a producer will not discover that the technology is a nonfit, yet still adopts it, is 1 ! (1 ! q )q D . For simplicity, we assume that producers do not have demonstration costs, i.e., it is costless for producers to spend time participating in a demonstration and testing the technology.42 Consequently, the expected value of the technology, using our previous assumptions that the per acre net benefits of a product fit and non-fit are “1” and “0”, respectively, is the following: (13)
q (L ! P ) ! (1 ! q ) (1 ! qD ) P
If a producer weighs prior perceptions or new information more highly, evaluate the technology’s attributes, or attributes affect overall performance in different ways, then the producer’s change in beliefs may be non-linear with respect to the quantity of information provided through the demonstration (Heiman and Muller 1996). 42 This is a simplifying assumption that might not be accurate for poorer farm households in developing countries, who often face severe time constraints. 41
26
Draft
Equation (13) is simply a modified expression of the expected profits from the new technology, including the role of demonstrations in reducing fit uncertainty. Taking the first-order conditions and setting equation (13) equal to zero enables us to derive a modified expression for the threshold size of the farm using demonstrations:
L*D =
(14)
P [1 ! (1 ! q )qD ] q
As is evident from equation (14), the producer’s uncertainty after participating in a demonstration is lower than without it, assuming that qD ! [0, 1]. Consequently, for a given technology price (P), L*D < L* ; in other words, the critical farm size at which adoption is profitable will be lower. Nevertheless, this does not imply that the number of adopters will be higher in the presence of demonstrations, as actual adoption is a function of the probability that the product will be a fit for the “average” producer. Thus, the cumulative number of adopters at each point of time, Xt, is the number of potential adopters with a higher land value than the threshold level, multiplied by the probability that the demonstration does not reveal that the product is a poor fit for the producer. Formally, this can be modeled as the following: !
(15)
XD =
'
L*D ( t )
#%1 " (1 " q )qD $& h( L)dL
where, as before, h(L) is the density function of farm size. The additional number of adopters at time t,
X& (t ) , is therefore captured in the following equation:
&
P (16) X& D = ! "$1 ! (1 ! q ) q
2
qD #% h( L(t ))
meaning that the additional number of adopters can be calculated by multiplying the change in the threshold farm level by the density of the potential producers and one minus the probability of learning that the technology is a non-fit.
27
Draft This model can be further modified to capture the dynamic aspects of adoption using demonstrations. After participating in the demonstration, the producer updates his/her initial expected extra
( ) 2
per acre gains ( "# 0 ) and variance " 0 from using the technology. Assuming a Bayesian updating process, the following equations represent the updated process of the gains from the technology: (17)
"#1 = (1$ % (t )) "# 0 + % ( t)" # * ,
(18)
"12 = (1# $ (t ))" 02 + $ ( t)" 2 *
where a( t) and b(t) are updating functions that depend on the duration (t) of the demonstration, "# * is the true average per acre profit gain, and
2*
is the true variance of profits. As was the case in the previous
model, it is reasonable to assume that initial variance (
20)
is higher than the true variance (
2*),
since the
producer initially has little information about the technology. Essentially, these equations show that, as experience with the technology increases, the variance of the expected outcome converges to a weighted value of the initial and true variance, resulting in updated mean and variance values that are used by producers in their adoption decisions. Replacing the
and
2
from equation (8) with the updated variables in
equations (17) and (18) yields the adoption-demonstration relationship and the impact of demonstrations on the threshold level in a dynamic setting. Although this equation is not shown, it implies that longer demonstrations increase the likelihood of adoption if small, and
t2
20
2*,
if
20-
2*
is
is reduced, then demonstrations might increase the proportion of adoptions. This implies that
sellers will want to offer technology demonstrations when producer uncertainty about the product is high (high perceived variance) or when the brand has an unjustified negative image (low perceived profit), as they can speed up the technology diffusion. Money -b ac k gu arant ees
!A money-back guarantee (MBG) is an option that allows the producer to receive some or all of his/her money if he/she decides to return the product to the seller within a given period of time after purchase. MBGs therefore reduce the irreversibility of the investment decision and reduce both personal fit and performance risk, as the producer knows that the technology can be returned if it is a non-fit or does
28
Draft not perform as expected. As is the case with most marketing tools, if a MBG is offered with the technology, the cost of the marketing tool is implicitly included in the product’s price. Since the technology must be purchased for the MBG to be valid, MBGs are often a less efficient mechanism for reducing risk than other marketing tools, such as advertising and demonstrations. Nevertheless, if producer uncertainty about a particular product remains unresolved before adoption, then MBGs can play a crucial role in reducing a producer’s final uncertainty and encouraging adoption. Finally, it should be noted that sellers incur fixed and variable costs in offering MBGs. If product depreciation or the likelihood of damage is high, the seller will be less likely to provide a MBG. Nevertheless, if MBGs sufficiently increase adoption, the seller can charge higher prices for providing MBGs; or, if the seller anticipates a low likelihood of return, then the benefits from providing MBGs can offset the potential costs. Consequently, the seller not only decides whether to offer a MBG, but also the return policy and its duration.
As was the case with other marketing tools, the threshold framework can be modified to model adoption under MBGs. Without MBGs, the probability of fit is identical in form to the model presented for demonstrations, and the threshold level is the same to the one that was presented in equations (13)(14). If the technology is offered with MBGs, however, then this modifies the adoption equation and hence the threshold level. Consider an example of a producer with farm size L who receives a cumulative discounted future per acre increase in benefits of "BH from adopting a technology if its fits, and "BL if it is a non-fit. The technology requires an investment of I, and the probability that the technology will fit the producer is q. If a MBG is not offered, then the expected value of the technology for the producer is: (19)
q(L " #BH $ I ) + (1$ q)( L " #BL $ I )
The producer will adopt the technology if this expected value is positive. Solving the first-order condition for equation (19) yields the threshold size for adoption: (20)
L*0 =
I q" #BH + (1$ q) " #BL 29
Draft This result is similar to the result obtained in equation (3), except that the per acre benefits from adoption in the denominator are weighted by the two possible outcomes. Now we introduce the provision of a MBG with the purchase of the technology. For simplicity, we assume that the duration of the MBG is sufficient for the producer to identify whether the product is a “fit”. If the producer realizes that the product does not fit his or her personal needs, then he/she will receive the investment paid for the technology, but will incur return costs (RC) which are composed of a return penalty and the cost of his time spent returning the product. The expected benefit of purchasing the product with a MBG is therefore:
q(L " #BH $ I ) $ RC(1$ q)
(21)
Equation (21) assumes that the per acre value of the technology that is not a fit ( "BL ) is small enough such that the producer will want to return it. This return condition is therefore: (22)
I " RC > L # $BL ,
In other words, equation (22) says that the producer will return the product if the value of returning it is greater than the expected value of keeping it. If this condition is not met, then the MBG has no value to the producer, and the expected value of adopting the new technology is identical to equation (13), where the producer keeps the technology even when the lower outcome is realized. The new threshold level for adoption arising from equation (21) is therefore:
L*MBG =
(23)
q" I + (1# q) RC q " $BH
When the return condition (equation 21) is satisfied, this new threshold level is lower than the level *
*
that exists without MBGs, i.e., LMBG < L 0 .43 Thus, providing a MBG increases the incentive to adopt and facilitates the diffusion of new technology. From equations (22) and (23), we see that the importance of the MBG in affecting the adoption decision is determined by the producer’s return costs (RC), the value of a bad fit ( "BL ), and the likelihood of a bad fit (1-q).
! Heiman et. al (2002) proved that the price of a product that comes with MBG is always higher than without it, but the threshold level is lower with MBG. 43
30
Draft Longer MBG contracts increase the time the producer has to test and evaluate the technology, thereby further reducing the probability of a non-fit. In many cases, sellers are better informed than producers about the quality of the product being sold. If the seller is confident about a product, a generous MBG may be offered to entice the producer to adopt, knowing the likelihood of a return is small. Providing long-term MBGs can therefore be a signal of seller’s confidence in the technology.44 At the same time, sellers must be wary of providing MBGs that are overly generous. If the duration of a MBG is long, some producers may use the technology for the duration of the MBG and then return it, thereby resulting in a moral hazard problem.45 In addition to the moral hazard problem, a MBG that is excessively long in duration can increase the likelihood of the technology being broken or mishandled, thus reducing its value to the seller.
Warranties A warranty is a contract is offered with a product that protects the producer in the case of a performance failure caused by design or manufacturing errors. It is provided with the technology at the time of purchase (adoption), and therefore reduces performance risk related to long-term product reliability and durability. Private sellers can provide a variety of warranty contracts that differ in the length and in what is covered. As with other marketing tools, a warranty may serve as a signal of product quality, i.e., the longer the warranty, the higher the product quality. From the perspective of agricultural technology, a key element of a warranty is its timeliness in terms of repairing or replacing a failed machine. If a technology fails to perform, the producer incurs opportunity costs, such as unplanned idle time or delays in production. This is crucial in a time-sensitive sector such as agricultural production. Consequently, some sellers will provide warranties that offer low replacement times or back-up warranties that provide substitute machinery during the period of repair. From the seller’s perspective, a lower threshold level associated with the introduction of MBGs does not necessarily imply that adoption is increasing, as producers may still return the product. In addition, the price with MBG may or may not be higher than the price with demonstration, as it depends in the cost of demonstration versus the cost of handling returns. This is therefore a different problem than the demonstration problem. With the MBG, the return costs apply only to producers who choose to return the product; with demonstrations, the costs apply to all producers who participate in the demonstration. This implies that the profit with demonstration is probably higher , since the profit margins are larger and the returns are lower. In addition, often MBG policies are fixed, whereas demonstration policies are more flexible. Therefore, it is reasonable to assume that MBGs will be stable over time, but that sellers will need to take into account the MBG when designing demonstrations. 44
31
Draft As was the case with advertising, demonstrations and MBGs, warranties can similarly be integrated into the adoption framework. Assume that a producer anticipates future potential losses from mechanical failure (performance risk) as the following: T
" 1 $ ( ) (24) BC = ' #1 + r % F + D & X where BC is the current discounted cost of future expected breakdowns, T is the year(s) in which the breakdown occurs, F are the fixed costs of repairing the machine, D is the number of days it takes to fix the machine, and X is the per-day production losses to the producer. These are expected costs, as the actual occurrence of a performance failure is uncertain. Total costs will therefore depend on when the breakdowns occur (T), with costs decreasing as the number of years between breakdowns increases. The likelihood of a performance failure depends on the technology’s quality, and fixed costs will be lower if there is a warranty. If the warranty covers these costs and if discounted expected fixed costs are greater than the warranty cost, then the producer will purchase the warranty. The primary variable costs of a performance failure are lost production time, which in turn depend upon the reputation of the service provider and whether the seller provides a back-up guarantee for the product. If service provider’s reputation is such that producer expects that repairs will be performed quickly, then the warranty has additional value to the producer, and the seller may charge a premium for the services represented in the warranty. If the seller provides a back-up warranty, this can replace the need for a fast turnaround. Moreover, by requiring that the warranty provider replace broken machinery, the incentives for effective maintenance and quick turnaround are high. Sales pe rson s Salespersons provide an important function in the adoption of new technologies. In many cases, their role may comprise many, if not all, of the functions of the other marketing tools, as a salesperson can adapt his or her efforts to the needs of the particular producer. Unlike some of the other marketing tools, the
A classical example of this situation is with formal clothing, which may be purchased before a special event and returned for a refund immediately afterwards. This may also arise with furniture, computers, and agricultural machinery, which may be used temporarily and then returned. 45
32
Draft salesperson may play a part in all stages of the adoption process, from introducing potential adopters to new products (awareness stage), to providing feedback to the seller about producers’ needs and product shortcomings. In addition, sales personnel can provide producers with detailed information about the fixed and variable costs of the technology and its benefits, thereby providing a framework for the final adoption decision. A perfectly good technology may fail if early adopters have a bad experience with the product and conclude that the product is a failure. Consequently, the success of a technology among early adopters depends on the capacity of these adopters to deal with unforeseen problems, the assistance and support they receive from the seller, and the way in which the components of the product are bundled. In addition, if the seller is familiar with the farming population, they may select producers with high capacity for successful adoption, and provide the necessary technical assistance to producers (via salespersons) to make the necessary adaptations that the new technology might require.46 While sales personnel can greatly reduce personal fit and performance uncertainty for potential adopters, they provide a large volume of information to a small number of potential buyers. In many cases, advertising is the “extensive” marketing tool that creates product awareness, whereas sales personnel are the “intensive” marketing tool designed to encourage the potential buyer to actually adopt. As is the case with advertising, the incorporation of sales personnel into adoption models has primarily relied upon the imitation framework. Imitation models emphasize the importance of a technology’s success with early adopters, which is tailored to the specific approach of sales personnel. Nevertheless, the threshold model can be easily adapted to include sales personnel and to assess their impact on reducing uncertainty and encouraging adoption. The simplest approach to incorporating sales personnel into the adoption model is to generalize the advertising shifter in equation (11) ((f(⋅)) to a salesperson shifter, whereby the salesperson provides the necessary combination of marketing tools and packages the technology so that it
For example, for irrigation technologies, sales personnel consist not only of salespeople, but also of sales engineers who design and adjust the irrigation technology to the specific needs of the farmer so that it can be used optimally (Riddering). Similarly, in the area of pest control, sellers engaged consultants who would assess the pest situation of farmers and recommended technological solutions. 46
33
Draft meets the specific needs of a particular producer. The more effective the salesperson’s efforts in this regard, the larger the shifter, and hence the greater the diffusion of the technology. Alternatively, the salesperson can also be incorporated into the adoption model by influencing the adoption equation for risk-averse farmers, as modeled in equations 6-9. By identifying potential adopters and informing them about the technology, its costs and benefits, the salesperson can influence the farmers’ expected outcome from technology (output or input risk) and increase their confidence about the performance of the technology (performance risk). The salesperson can further increase the expected benefits from adoption by providing training or bundling the technology with another product in order to meet the specific needs of the producer. Finally, the salesperson can reduce the fixed investment costs of the technology by reducing search, transactions, and set-up costs and providing credit. All of these affect the key parameters in equation 6, thereby reducing the threshold size for adoption under uncertainty.
4. Policies and Technology Adoption As discussed throughout this paper, the economic literature on adoption aims to explain the impact of policies (insurance, price support, subsidies) and institutions (tenure, contracting, extension) on adoption decisions, but largely ignores the role of marketing tools (money-back guarantees, demonstrations, leasing, warranties) that address many of the same issues. The focus of many economists and policymakers on the role of the public sector in the research and dissemination of information about new technologies has led to a lack of appreciation of the role and contribution of private marketing efforts in promoting technological change in agriculture. These analyses may therefore underestimate the demand for new technologies, and, as a result, bias the estimated effectiveness of extension and policy tools in reducing risk and in encouraging adoption. A specific issue of concern is the relevance and effectiveness of extension activities in adoption, as extension is often recommended as the primary means of disseminating information, reducing risk and encouraging adoption. Changes in modern agriculture and recent technological advancements increase the demand for information and investment in all areas of production. In this rapidly changing environment, extension must
34
Draft be re-examined in order to recognize its relationship with the private sector and to design an effective program for disseminating information and promoting new technologies. If the role of the private sector is ignored, policymakers only have a partial list of tools for enhancing adoption. In some cases, marketing tools may be more effective in reducing certain types of uncertainty and removing constraints to adoption. Consequently, understanding how governmental policies relate to the marketing efforts in the private sector will help policy makers identify how to divide responsibilities between public and private sector activities. These interactions imply that public sector efforts in encouraging agricultural adoption may need to act as complements or substitutes for private sector activities, depending on the type of technology, the constraints to adoption, the types of risk, and the competitiveness of the private sector. For example, agricultural extension may complement private-sector activities by promoting a generic beneficial technology, such as drip irrigation, while manufacturers and dealers promote specific brands of the technology. Extension may also provide unbiased research comparing technologies, thereby providing a service to customers who may not believe sellers. In other cases, government efforts may be considered as substitutes for private marketing activities. For example, when extension promotes a particular technology, this promotion can be a substitute for private marketing activities if it reduces the private institution’s efforts to promote their own product. In general, activities that substitute those of the private sector should be minimized, although an exception may be made when they are products that have positive social externalities that are not accounted for by the sellers of the technology. Emphasizing the complementarities between extension and private-sector marketing tools does not imply that there is not a role for a stand-alone governmental policy in the adoption of new technologies. For example, when a technology cannot be sold, government promotion may be necessary, especially if the private sector does not have an incentive to encourage adoption. This was the case with integrated pest management practices, which may reduce the demand for chemical pesticides. Nevertheless, the role of private sector marketing tools in technological adoption cannot be ignored, and it is crucial that governmental policies in this sector recognize the contribution of these actors in order to efficiently and effectively promote technological adoption.
35
Draft
5. Concluding Remarks In this paper we argued that the decision to adopt new technology is often carried out in the face of uncertainty. Uncertainty comes from a variety of sources, including concerns over price and yield fluctuations, governmental policies that can affect both, and fears that the new technology will not perform according to expectations or fit the producer’s specific needs. For the risk-averse producer, this uncertainty can affect their decision to adopt via the expected profits of the new technology. While economic literature has modeled adoption under “traditional” sources of uncertainty, it has been less successful in incorporating marketing risk into traditional adoption models. This paper has argued that the threshold model can be easily modified to include other types of risk, specifically performance and personal fit risk. At the same time, given the focus of current economic literature on traditional sources of risks, recommendations for mitigating this risk has primarily focused on governmental policies, such as insurance, price supports, subsidies, contracting and extension. Consequently, the economic literature on adoption has aimed to explain the impact of these policies on adoption decisions, but has largely ignored the role of marketing tools on reducing risk and encouraging adoption. We therefore introduced two modeling
frameworks which could be used to include marketing activities into current adoption models. The first is the imitation framework, which is widely used in marketing in the area of advertising, and the second is the threshold framework. We showed that incorporating marketing within the imitation framework is easier when it comes to non-targeted advertising, but that, when it comes to tools with effect on the individual producer, the threshold model is more appropriate. As was seen throughout these models, the critical parameters in the adoption decision are the cost of technology, the expected extra profit gain from using the technology, and the available information at the time of the adoption decision. In general, advertising, demonstrations and MBGs provide potential buyers with information that addresses pre-purchase uncertainties. This reduction of uncertainty reduces the threshold level and can accelerate the rate of adoption, but can also reduce the net demand for the technology, as a proportion of producers will learn that the product does not fit their needs. Therefore, the 36
Draft total adoption of the technology may actually decline may decline as a result of these marketing tools. Furthermore, since MBGs and demonstrations add producers with low threshold levels but “remove” a fixed fraction of producers with a high threshold level, the effect on expected profits is much less obvious. If the population is distributed over its valuation of the technology, then the seller may want not to offer MBGs or demonstrations. Alternatively, the seller may charge producers for the MBG regardless of whether they keep the product. In this case the society may want to impose a guarantees as part of any sale. Finally, this paper attempted to briefly address the implications of marketing tools for governmental extension in mitigating risk and encouraging adoption. While governmental extension activities can spread information about new technology, in designing an adoption strategy, the efforts of the private sector must be taken into account. Ignoring private sector activities can lead to an underestimation of the technological adoption (which is higher with marketing than without it), and thus to an overestimation of policy impacts. Extension and private sector marketing activities may be complementary, substitutes, or competing, but extension activities should focus primarily on those areas where private sector activity is insufficient. This can include promoting technologies that are not embodied in products and therefore cannot be sold, promoting technologies that have positive externalities, providing an unbiased evaluation of new products, and training farmers or specialists so that they have a more sophisticated framework for analyzing technological and production decisions. It should be noted that the modeling framework presented in this paper has several shortcomings, which could provide the basis for future research. For example, since providing marketing tools has associated costs, sellers may offer less intensive tools then those desired by producers. This might necessitate governmental involvement in the market, but this conclusion is premature, as our model does not take into account punishment mechanism of marketing. In addition, our models do not include the effect of previous adopters on the threshold level and on the probability of adoption. Future research should include the proportion of satisfied “customers” in the threshold framework. In this case, we would expect that a seller that chooses to sell its product without providing sufficient information will reduce its future profits.
37
Draft
Finally, we fully recognize that the sanctions of unhappy customers are even more effective when it comes to consumables, where producers makes profits from repeat purchases. We did not model repeat purchases in this paper; integrating the effect of consumer satisfaction on future purchases and adoption will be a conceptual and empirical challenge.
38
Draft References:
Bass (1969). Blair, M Elizabeth, and Daniel E. Innis. “The Effects of Product Knowledge on the Evaluation of Warranteed Brands.” Psychology & Marketing, 13(5): 445 –457 (Aug 1996). Bulow, J. “Durable-goods Monopolist.” Journal of Political Economy, 90(2): 314-332 (1982). Coase, R. “Durability and Monopoly.” Journal of Law and Economics. 15: 143-149 (1972). Courville, Leon, and Warren H. Hausman. “Warranty Scope and Reliability Under Imperfect Information and Alternative Market Structures.” Journal of Business, pp. 361-370 (July 1979). David, P. A. Technical Choice, Innovation and Economic Growth, Cambridge University Press, Cambridge (1975). Desai, Preyas, and Devavrat Purohit. “Leasing and selling: Optimal Marketing Strategies for a Durable Goods Firm.” Management Science 44: (11) S19-S34 Part 2 (Nov 1998). Desai, Preyas, and Devavrat Purohit. “Competition in Durable Goods Markets: The strategic consequences of leasing and selling.” Marketing Science, 18: (1) 42-58 (1999). Dixit, Avinash K., and Robert S. Pindyck. Investment Under Uncertainty. Princeton University Press, (1994). Feder, Gershon, and Gerald T. O’Mara. “On Information and Innovation Diffusion: A Bayesian Approach,” American Journal of Agricultural Economics, 64: 145-157 (1982). Feder, Gershon; Richard E. Just, and David Zilberman. “Adoption of Agricultural Innovations in Developing Countries: A Survey.” Economic Development & Cultural Change, 33(2): 255-298 (Jan. 1985). Feder and Slade (1985). Feichtinger, Gustav, Richard F. Hartl, and Suresh P. Sethi. “Dynamic optimal control models in advertising: Recent developments.” Management Science, 40(2): 195-226 (Feb. 1994). Flath, David. “The Economics of Short-Term Leasing.” Economic Inquiry, 18(2): 247-259 (Apr 1980). Griliches Z. “Hybrid Corn: An Exploration in the Economics of Technological Change.” Econometrica 25, 501-522 (1957). Heal, G. “Guarantees and Risk Sharing.” Review of Economic Studies, 549-560 (1977). Heiman, Amir, and Eitan Muller. “Using Demonsration in New Product Diffusion – the Theory of Demonstration Duration,” Journal of Marketing Research, 33: 422-430 (1996). Heiman, Amir, Bruce McWilliams, and David Zilberman. “Demonstrations and Money-Back Guarantees: Market Mechanisms to Reduce Uncertainty,” Journal of Business Research, Forthcoming (2000).
39
Draft
Horsky, Dan, and Leonard S. Simon. “Advertising and the Diffusion of a New Product.” Marketing Science, 2: 1-10 (1983). Kelley, Craig A. “An Investigation of Consumer Product Warranties as Market Signals of Product Reliability.” Academy of Marketing Science Journal, V16, 2, 72-79 Summer 1988). Kotler, Philip. “The Major Tasks of Marketing Management.” Marketing Management. 2(3): 52-56. (1993) Kotler, Philip. Marketing Management, 9th edition. Englewoods Cliff, New Jersey: PrenticeHall, Inc. (1997). Mahajan, Vijay, Eitan Muller and Frank Bass. “New Product Diffusion Models in Marketing: A Review and Directions for Research,” Journal of Marketing, 54: 1-26 (1990). Mansfield, E. “Technical Changes and the Rate of Imitation,” Econometrica, 29: 741-766 (1961). McWilliams, Bruce, and David Zilberman. “Time of Technology Adoption and Learning by Using,” Economic Innovations and New Technologies, 4: 139-154 (1996). Olmstead, Janis May. Emerging Markets in Water: Investments in Institutional and Technological Change. Dissertation, University of California, Berkeley, (1998). Roberts, John H., and Gary L. Lilien. “Explanatory and Predictive Models of Consumer Behavior,” In J. Eliashbers and G. L. Lilien Eds., Handbook in OR&MS, Vol. 5, Elsevier Science Publisher B.V (1993). Sandmo, Angmar (March 1971). “On the Theory of the Competitive Firm under Price Uncertainty.” American Economic Review, Vol. 61, No. 2, pp. 65-73. Shah, F., D. Zilberman and U. Chakravorty. “Technology Adoption in the Presence of an Exhaustible Resource: The Case of Groundwater Extraction.” American Journal of Agricultural Economics, 77: 291-299 (1995). Spence, Michael. “Consumer Misperceptions, Product Failure and Producer Liability.” Review of Economic Studies, 561-572 (1977). Stoneman, Paul L. “Intra-firm Diffusion, Bayesian Learning and Profitability”. The Economic Journal, 91: 375-388 (1981). Stoneman, Paul L. and Irlend (1985). Stokey, N. “Rational Expectations and Durable Goods Pricing.” Bell Journal of Economics, 12: 112-128 (1981). Thirtle, Colin G., and Vernon W. Ruttan. The Role of Demand and Supply in the Generation and Diffusion of Technical Change, Chur, Switzerland ; New York : Harwood Academic Publications, c1987. viii, 173 p. : ill. ; 22 cm. Wells, William D., and David Prensky. Consumer Behavior, John Wily and Sons, Inc., (1996).
40
Draft
Appendix 1: An Additional Example of Dynamics in the Threshold Framework Several recent studies of adoption behavior introduce explicitly a dynamic decision-making framework, where adoption of non-divisible technologies is modeled as a long-term investment decision. Even risk-neutral farmers might not necessarily adopt a new technology when the current annual benefits equal costs if the expected discounted net benefits of adoption are maximized. McWilliams and Zilberman (1996) analyze the issue of dynamics in adoption when learning processes are taken into account. The process of “learning by doing” enables manufacturers of capital goods to reduce their per output costs of production; thus, the price of new technologies embodied in these capital goods tends to decline. If the price of the technology at the moment of adoption is I(t ) , then the “learning by doing” assumption implies that ƒI(t ) / ƒt < 0 . The process of “learning by using”, on the other hand, leads to increased efficiency in the use of a new technology as farmer experience with it accumulates. Under the “learning by using” assumption, if a farmer adopts a technology at time T, the gain per acre from adopting the technology in each period thereafter is "# (t $ T ) , while the marginal gain from “learning by using” in periods t > T is "# "( t $ T ) > 0 . Under these assumptions, the optimal time of adoption of a new non-divisible technology for farmers with L acres of land can be calculated by maximizing the objective function: "
max e! rt L#$ (t ! T )dt ! e! rT I (t )
(1)
T
T
McWilliams and Zilberman argue that four considerations are balanced in the equation determining the optimal time of adoption, which is derived by solving equation (1): &
(2)
rI (T) " #I (T ) #T = L$% (0) + interest cost of purchase
learning by doing gains
increased current period earnings
'e
"r ( t "T )
L
#$% ( t " T ) dt #T
T loss from delaying learning by using benefits
At the optimal period of adoption, the marginal benefits of delaying adoption (the left-hand side of equation (2)) is equal to the marginal cost of delaying adoption (the right-hand side of equation (2)). The marginal benefits consist of savings in interest payments and a lower investment cost due to “learning by
41
Draft doing” on the part of the firm producing the new technology. The marginal cost consists of foregone increase in earning from using the technology, as well as future losses from delaying the farmer’s learning process. Under this specification, larger farmers are likely to adopt earlier due to normal economies of scale. For example, if education increases the capacity of farmers to learn quickly, McWilliams and Zilberman show that higher-educated farmers will be the earlier adopters, as they are able to realize their “learning by using” benefits at an earlier point in time. It should be recognized that these specifications have a strict definition of learning by using and exclude learning from the experience of others. The optimal timing of adoption may be different if the benefits from adoption depend on learning from industry-wide experiences, or if they are influenced by educational efforts.
42
Draft
Appendix 2: Additional Marketing Tools and the Adoption Framework Rent in g a nd Leas in g Diffusion of new and existing durables occurs not only through the sale of the technologies. Sellers may also offer the product to potential adopters through rental or leasing arrangements. In some cases, the duration of MBGs for new technologies—typically up to a month or 45 days—may not be sufficient to overcome uncertainty about fit or performance. Farmers may need the whole season to assess whether a system fits their needs and to determine how it affects operations. Renting or leasing a new durable product provides one solution to this problem. When sprinkler irrigation was introduced in California, a chain of stores called Rain-for-Rent was an important marketer of the technology. The chain and name have survived, but the sprinkler has become an established technology, making rental a much less significant part of marketing efforts. Let us suppose that a farmer wants to rent or lease a new technology for one period at a price of R to see if it fits their needs or not. At the end of the period, the farmer knows if the product is a fit or not, and will buy it for price I the next period if it is a fit. On the other hand, if the farmer does not have the option of renting, he will buy the product for price I, incurring annualized costs of rI over the first period. If the product is a fit, he will keep it, and if it is not a fit, he will incur losses of c, which may represent losses from resale of the product or one-time accounting of the discounted future losses of a no-fit relative to a fit. Suppose the likelihood of a fit is q. At the end of the first period, the expected costs of purchasing outright are: rI + qc , while the expect costs of renting are R. Therefore, a farmer will choose rental if:
R < rI + (1" q)c . As the likelihood of a fit (q) decreases, or the cost of a wrong mistake (c) increases, rental becomes a more attractive option. Renting or leasing a new technology can also help overcome future price risks and economic uncertainty that may delay adoption. Offering a new technology through a rental or lease agreement reduces the customer’s adoption decision to evaluating only current period profits, which may be preferred when investment in a durable good technology is irreversible.
43
Draft Renting or leasing may also be an option for firms that do not have access to the necessary capital to purchase the product outright. It may also be considered a partial purchase of the product for firms that do not want to commit to an outright purchase, or when a firm requires the technology for only part of a season. Typically, if the purchasing firm is a sufficient size, purchasing the product will be the cheapest long-term alternative in terms of per-unit production costs. Rental and lease arrangements may be more relevant for smaller firms and firms that require the technology for only short periods. Providing these arrangements, therefore, accelerates technology adoption by removing the constraints to adoption and reducing the risk of making a bad purchasing decision. Cre dit The adoption literature recognizes the role of credit constraints in slowing the diffusion process. Marketing organizations have developed policies to address this, with dealers becoming major providers of credit to purchasers. Providing credit reduces the transaction costs of obtaining a loan and, in some cases, provides loans to individuals who may otherwise be unable to obtain the product because of credit constraints. Dealers may provide loans because they: (1) have better information than commercial buyers about the performance of a technology and therefore perceive the product as being less risky than do bankers; (2) have a relative advantage in disposing of mortgaged equipment in case of insolvency; and (3) are more willing to subsidize a loan in order to accelerate the adoption process because of the various gains that they make from their sales (e.g., immediate profit from sale, diffusion of product information). In the context of equation (3), m = rI and the threshold level for adopting the new technology is
L* =
rI . If the seller of the technology is willing to provide a loan to the marginal buyer (for the reasons "#
given above) at a lower rate than what the buyer can receive at the banks, this would reduce the fixed costs of the product and lower the threshold farm size for adoption. Providing credit to marginal farmers can therefore be an effective way to facilitate the diffusion of the new technology. In some cases, the farmer or the investment may be considered a sufficient credit risk that the farmer is unable to get a loan at any interest rate from traditional sources. In this case, the implicit market interest
44
Draft rate is infinite. Again, the seller may be willing to provide credit to these farmers to facilitate product diffusion. Train in g Product training can be an effective way to encourage adoption in technologies for which learning is important. When learning is brand specific, training will induce brand commitment as learning costs decrease relative to other brands. For example, some companies provide farm machinery to agricultural colleges at discounted prices or as donations. Students at the college then learn to use specific brands, thereby making them familiar with and more likely to adopt those brands when they leave the college. In the dynamic learning model of McWilliams and Zilberman (year), the availability of human capital was an important factor in determining when a new technology would be adopted. From equation (8), the first order condition for adoption was to buy the product when: &
rI (T) " #I (T ) #T = L$% (0) + interest cost of purchase
learning by doing gains
increased current period earnings
'e
"r ( t "T )
L
#$% ( t " T ) dt , where T was the time of adoption, r is #T
T loss from delaying learning by using benefits
the interest rate, I is the investment cost, L is farm size, and
(t-T) is the increase in per-acre profits from
adoption, which are a function of the length of time that the farmer has the technology (learning from using). Providing training to the farmer can speed up the learning process, thereby increasing the “current period earnings” (
(0)) and reducing the “loss from delaying learning by using benefits”.
Moreover, providing training may reduce investment costs (I) if learning to use the technology is a part of the fixed costs of adoption. Therefore, by providing training, the seller is increasing the human capital of the adopter and facilitating the learning process. We can rewrite equation (8) as a function of farm size:
rI(T ) " #I (T ) #T L *learning =
interest cost of purchase &
$ % (0) + increased current period earnings
'e
learning by doing gains "r ( t "T )
#$ % (t " T ) dt #T
T loss from delaying learning by using benefits
45
.
Draft From our discussion, it is clear that providing training (increasing human capital) can reduce the numerator (by reducing investment costs I) and increase the denominator. Therefore, a lower threshold level for farm size is achieved, and the rate of product diffusion is increased. Even when a technology has been around for some time, training may be essential when a technology is relatively new to farmers in a particular region. If training is not given, farmers may use the technology ineffectively and be disappointed with it, reducing the likelihood of its diffusion to their neighbors.
46