Mem. Descr. Carta Geol. d’It. LXXVI (2007), pp. 267-276 figg. 4 - tabb. 3
Mass Balance from the Vertical Water Distribution in the Unsaturated Soil by TDR Measurements and Analytical Solutions of the Linearized Richards Equation Bilancio di massa in una colonna verticale di suolo insaturo mediante misure TDR e soluzioni analitiche dell’equazione di Richards linearizzata MENZIANI M. (*), PUGNAGHI S. (*), ROMANO E. (**), VINCENZI S. (***), SANTANGELO R. (*)
ABSTRACT - Long series of soil moisture data have been collected during field experiments using the Time Domain Reflectometry (TDR) technique. The time evolution of the soil moisture profile highlights features of the different soil physical characteristics. Among the soils considered, a sandy soil shows the presence of an inflection point in the soil moisture profile whereas this has not been observed in a silty loam of a sub-alpine valley. The water budget in the superficial soil layer is computed by means of a mass balance based procedure, using the soil water content measures. The procedure allows estimating the evaporation during drying periods and the infiltration after precipitation events. The method was applied to soil moisture data collected during field experiments realized both in a physical model at the Lido beach of Venice and in natural sites in mountain and suburban environment. Analytical solutions of the linearized Richards equation are derived to model different situations of interest. Solutions representing the experimental data both during infiltration and evaporation periods were obtained for arbitrary initial water content conditions and boundary conditions on flux rate. This permits to obtain the boundary conditions from standard meteorological data: precipitation data (incoming flux) and Bowen ratio data (outgoing flux, obtained by the energy balance using air temperature and relative humidity at two heights). The advantage is that meteorological data are very common, while soil volumetric water content measurements are usually not available exactly at the soil-atmosphere interface. KEY WORDS: Soil Moisture, Time Domain Reflectometry, TDR, Water Budget, Evaporation, Infiltration, Linearized Richards Equation. RIASSUNTO - In questo lavoro vengono presentati i dati di contenuto volumetrico di acqua del suolo acquisiti in siti
distinti, durante tre campagne di misura, protrattesi per vari mesi. Per queste misure è stata utilizzata la tecnica della Riflettometria nel Dominio del Tempo (Time Domain Reflectometry, TDR). L’evoluzione temporale dei profili d’umidità mette in evidenza, in modo significativo, comportamenti diversi in base alle differenti caratteristiche fisiche e idrauliche dei suoli studiati. Tra questi, solo la sabbia del modello fisico realizzato al Lido di Venezia mostra, con evidenza, la presenza di un punto di flesso nel profilo d’umidità, mentre i profili misurati in campo in un terreno franco limoso a Pallanzeno (Val d’Ossola) ed in un terreno di medio impasto in una zona suburbana di Milano restano sempre convessi. Viene inoltre proposto un agile algoritmo (MENZIANI et alii, 1999) che, dall’equazione di conservazione della massa, permette di stimare le perdite/guadagni della colonna di suolo di sezione unitaria. Le misure di contenuto volumetrico d’acqua e di precipitazione piovosa consentono quindi la stima dell’evaporazione o dell’infiltrazione all’interfaccia aria - suolo, in assenza di flusso orizzontale e sul fondo della colonna considerata. Vengono infine presentate soluzioni analitiche per l’equazione di Richards linearizzata, soggetta a condizioni complementari arbitrarie, assunte per il flusso come condizione al bordo superiore e per il contenuto volumetrico d’acqua come condizione iniziale. Di norma, le misure meteorologiche standard consentono la stima del flusso superficiale sia in ingresso sia in uscita (precipitazioni ed evaporazione ottenuta con il metodo del rapporto di Bowen), mentre i dati di contenuto volumetrico d’acqua sono rari ed è estremamente difficile assegnarli come condizione al contorno. PAROLE CHIAVE: Umidità del suolo, Riflettometria nel Dominio del Tempo, TDR, Bilancio idrico, Evaporazione, Infiltrazione, Equazione di Richards linearizzata.
(*) Dipartimento di Ingegneria dei Materiali e dell’Ambiente, Università di Modena e Reggio Emilia, Via Vignolese 905, 41100 Modena. Corresponding Author:
[email protected] (**) CNR - Istituto di Ricerca sulle Acque, Via Reno 1, 00198 Roma (***) CNR - Istituto di Scienze Marine, Dinamica Grandi Masse, S. Polo 1364, 30125 Venezia
268
MENZIANI M. - PUGNAGHI S. - ROMANO E. - VINCENZI S. - SANTANGELO R.
1. - INTRODUCTION The soil water content is a property of great importance in a range of hydrological processes including land-atmosphere interactions (evaporation, precipitation), flooding, erosion, solute transport etc. (GEORGAKAKOS, 1996), which, in turn, are relevant in many different fields as hydrology, meteorology, agriculture, civil engineering and so on. Evaporation and precipitation are the main components of the hydrological balance. The knowledge of evaporation is crucial in case of drought since it is the main mechanism, which depletes the available water (BRUTSAERT, 1988). Furthermore it plays a role also in determining the runoff, as it defines, together with drainage, the soil moisture profile before the rainfall event (LIU & BRUTSAERT 1978; LOAGUE & FREEZE, 1985). Finally evaporation is also important as airsoil coupling linkage to enhance or reduce precipitation (BRUBAKER & ENTEKHABI, 1996). The quantity of soil moisture available to plants is strongly determined by the soil water flow processes such as infiltration, redistribution, drainage, evaporation. The quantitative knowledge of the dynamic balance of water in the soil is therefore a crucial point in the physical description of the soil-plant-atmosphere system, which must be based on the understanding of the field water and energy balance at the soil surface (BRUTSAERT, 1988; HORNBERGER et alii, 1998). The two balances are intimately connected, since the water balance involves processes that require energy and the content of water in the soil affects the way the energy flux reaching the soil surface is partitioned and utilized, thus affecting the energy balance (HILLEL, 1980a , 1980b). In particular the evaporation process, which is often the principal consumer of both water and energy in the field, depends in a combined way on the simultaneous supply of water and energy. Moreover, all these processes, characterizing the soil water content profile, allow estimating the local recharge of the aquifers due to precipitation. Nowadays soil moisture measurements may be routinely performed using the Time Domain Reflectometry (TDR) technique (TOPP et alii, 1980). This allows monitoring the soil water content. In this paper the data collected in different field experiments are reported. One experiment was carried out in a physical model at the Lido beach of Venice (MENZIANI et alii, 1999). Another one was performed in Val d’Ossola (alpine valley) between Switzerland and the Lago Maggiore (Italy) (MENZIANI et alii, 2000; MENZIANI et alii, 2001).
The last one is a survey realized at the Parco Lambro, a suburban area of Milan, the largest town of northern Italy (MENZIANI et alii, 2002). The TDR technique has been used to measure the soil volumetric water content during these experiments, at different depths and at regular time intervals. The soil water content readings are used to estimate the water loss of a soil column of unitary cross section, using the water balance principle. Finally, analytical solutions of the linearized Richards equation were obtained by MENZIANI et alii (2005), assuming arbitrary initial and boundary conditions for the water content. In this paper, a solution, obtained for any surface flux boundary condition and any soil water content initial condition, is presented. It is the result of the sum of simple solutions obtained for constant boundary condition and null initial condition and for constant initial condition and null boundary condition. The vertical profiles of the soil water content computed by this simple sum of solutions will be compared with the analytical solutions obtained using continuous functions as supplementary conditions (MENZIANI et alii, 2004). Part of the theoretical study described in this paper was presented at the AGU Hydrology Days (Colorado State University). 2. - STUDY AREAS AND EXPERIMENTAL SET UP The experimental set up of the three considered case studies is briefly described. At the sites of Pallanzeno and Milan the buriable TDR probes (three rods, 20 cm long) were horizontally installed directly in the natural soil. At the Venice site (Lido beach) a wide fibreglass tank was filled with sand and buried in the same sand. In this way a physical model with known initial and boundary conditions was available. 2.1. - THE VENICE SITE The Venice site was located at the beach of the Lido of Venice, in the strip of sand (200-800 m width) between the lagoon and the Adriatic Sea. The physical model was set up in the wide natural sandy beach at the station of Bio-Climatologic Institute (Comune di Venezia). The experiment at this site was performed from the end of June to the end of November 1997. A large tank (diameter 2 m, height 1 m), completely embedded in the sand, was filled with the same surrounding sand. The Lido beach sand is a 99.5% fine sand with
269
TDR MEASUREMENTS VERTICAL WATER DISTRIBUTION
the characteristics reported in table 1. The TDR probes were installed at 5, 10, 15, 20, 25, 35, 45 cm depths and were automatically scanned with a sampling period of two hours. Initially water was poured in the tank until a thin layer of 1-2 cm formed on the sandy surface; the surface ponding permits to reach a complete saturation. Standard meteorological data (precipitation etc.) were also collected at the station. Tab. 1 - Venice-Lido beach: sand characteristics. - Lido di Venezia: caratteristiche della sabbia. Particle sizes
d10=0.09 mm
Dry bulk density Particle density Porosity
d60=0.2 mm
3
1.54 10 kg/m3 2.77 103 kg/m3 0.45
2.2. - THE PALLANZENO SITE The Pallanzeno station was set up in a large meadow (about 140 m 80 m) located between the alpine mountain slope and the Toce River. The meadow was grass covered and the grass was regularly cut. The buriable probes were installed at 5, 10, 15, 20, 25, 30, 35, 40, 50 and 60 cm depths at the centre of the meadow in front of the ENEL hydropower plant of Pallanzeno. The measurements were carried out from the end of March to November 15, 1999, with a sampling period of four hours. The precipitation was measured at the same station. From laboratory analysis the soil was classified as a silty loam according to the Soil Taxonomy (USDA, 1975); the soil physical characteristics are reported in table 2. 2.3. - THE MILAN SITE The Milan site was located in a park of a suburban area of the city of Milan (Parco Lambro).
Tab. 2 - Pallanzeno site: soil characteristics. - Pallanzeno: caratteristiche del suolo. Parameter
Value
ks (laboratory)
2.26 10-7 m/s
ks (in situ)
1.89 10-4 m/s
φ (porosity)
0.61
θs=0.925 φ
0.562
θmax (measured)
56 %
The measuring station was set up inside the area of a pumping plant of the water works of Milan, about 200 m far from the motorway city ring. This experiment started at the end of June 2001 and ended on November 2002. Five buriable probes were horizontally installed at 5.5, 17, 33, 52, 76 cm depths. The data were automatically collected at 30 minutes time intervals. Standard meteorological properties were monitored at the site. Samples of the soil were taken at different depths; from the laboratory analysis the soil was classified loam according to the Soil Taxonomy (USDA - S.C.S., 1975). The mean values of porosity of the samples and the other soil physical characteristics are reported in table 3. On the basis of an infiltration test carried out in situ by means of a double ring infiltrometer, following the D3385-94 standard of the American Society for Testing and Materials (ASTM, 2003), the saturated hydraulic conductivity of the soil was also estimated. The maximum measured water content value is reported in table 3 as well. Tab. 3 - Milan-Parco Lambro site: soil characteristics. - Milano-Parco Lambro: caratteristiche del suolo. Parameter
Value
ks (laboratory) ks (in situ) φ (mean porosity) θs=0.925 φ θmax (measured)
>5.6 10-4 m/s ≈2.0 10-3 m/s 0.51 0.472 40 %
3. - EXPERIMENTAL RESULTS AND DISCUSSION 3.1. - SOIL MOISTURE DAILY VERTICAL PROFILES From the experimental soil moisture measures, taken at different time intervals, the daily mean vertical profiles have been obtained. Two drying periods have been monitored for each test site, one in July and one in September. The precipitation is almost absent during the selected periods. The time evolution of the soil moisture profile shows different trends depending on the soil characteristics and on the external driving forces (solar radiation etc.), which changed in the considered period. Figure 1 shows the time evolution of the profiles for Venice ((a) July; (b) September), Pallanzeno ((c) July; (d) September) and Milan ((e) July; (f) September).
270
MENZIANI M. - PUGNAGHI S. - ROMANO E. - VINCENZI S. - SANTANGELO R.
Fig. 1 - Soil moisture vertical profile trends during drying periods. (a) Venice 21-29 July 1997; (b) Venice 15-28 September 1997; (c) Pallanzeno 19-27 July 1999; (d) Pallanzeno 5-14 September 1999; (e) Milan 24-30 July 2001; (f) Milan 1-13 September 2001. - Andamenti dei profili verticali d’umidità durante l’essiccamento. (a) Venezia 21-29 Luglio 1997; (b) Venezia 15-28 Settembre 1997; (c) Pallanzeno 19-27 Luglio 1999; (d) Pallanzeno 5-14 Settembre 1999; (e) Milano 24-30 Luglio 2001; (f) Milano 1-13 Settembre 2001.
271
TDR MEASUREMENTS VERTICAL WATER DISTRIBUTION
The soil moisture vertical profiles, measured in the sand of the Lido beach, are concave in their upper part showing an inflection point moving downward as the time increases. This inflection point is observable both in July and September. During the drying period in July, mainly the shallow 25-cm-thick soil layer loses water (fig. 1a). In September the upper soil layer (0-15 cm) is very dry and the change in soil moisture is negligible; the water loss of the soil column is supported by the underlying layer (fig. 1b). The soil moisture vertical profiles measured at Pallanzeno appear to be convex in July and almost uniform in September (fig. 1c and 1d). In July, the drying process involves the entire investigated soil column but the topmost layer (10 cm thick) is mostly affected. In September, the time evolution of the profile is almost a translation along the θ axis, that is, the whole layer from 0 to 30 cm is depleted at an approximately constant rate and an important contribution to the water loss comes also from the underlying soil. Also the profiles collected at Milan in July and September are convex along their whole thickness (fig. 1e and 1f). The water in July is lost only by the layer from 0 to 50 cm. In September the drying process starts after a rainfall of 16.4 mm, fallen in six hours. The soil water profiles show that evaporation and redistribution take place contemporaneously. At the two shallowest sampling depths (5.5 and 17 cm) the soil moisture data show a decreasing trend during the whole period. The soil moisture at 33 cm depth initially increases then decreases. The soil moisture at 52 cm shows an increasing trend during the whole period. Only the deepest level (76 cm) is practically not involved in these processes. It is interesting to note that the experimental soil moisture profiles in figures 1a and 1b show an upward concavity as the drying process progresses. This implies the presence, in the profile, of an inflection point where the second derivative ∂ 2θ ∂z 2 is null. Disregarding thermal and gravity effects (e. g. second stage of evaporation), the diffusion equation is normally used to derive the temporal evolution of the volumetric water content θ (BRUTSAERT & CHEN, 1995). In this case, the θ profiles may have an inflection point only if the hydraulic diffusivity D(θ) has a minimum; otherwise, a negative source term has to be introduced in the flow equation (MENZIANI et alii, 2002). 3.2. - CUMULATIVE EVAPORATION The water balance for the soil column of unit cross-section and height H can be described by
the following conservation relationship r ∂( ρ ⋅ θ ) + div Φ = 0 ∂t
(1)
where θ is the soil rvolumetric water content; ρ is the water density, Φ is the mass flux vector. The vertical direction z is assumed positive downward. If the horizontal flux at the border of the soil column and the vertical flux at z=H may be neglected, the integration of equation (1), with respect to z and t, gives H
L( H , t ) = ∫ ρ ⋅ [θ (z ,0)− θ (z , t )]⋅ dz = E (t ) − P(t ) 0
(2)
where L(H,t) is the water loss of the soil column during the interval (0, t); E(t) is the cumulative evaporation and P(t) is the cumulative precipitation at the time t. Applying equation (2) to the experimental soil moisture and precipitation data, the cumulative evaporation is obtained. Figures 2a, 2b and 2c show the measured daily precipitation and the cumulative evaporation, computed for the previously described periods, using the data collected at the test sites of Venice, Pallanzeno and Milan respectively (symbols). The solid lines are the interpolation of the experimental data with a function proportional to the square root of time, according to the flow equation solution for the desorption approximation (MENZIANI et alii, 2002). As previously stressed, at the Milan site, evaporation and redistribution took place contemporaneously immediately after the precipitation of September 1, 2001; therefore the quite high values obtained by means of equation (2) for September 2 and 3 (t=1 and t=2 in figure 2c) can be interpreted as the water loss of the soil column rather than evaporation only. 4. - THE MATHEMATICAL MODEL: THE LINEARIZED RICHARDS EQUATION Analytical solutions of the differential equation governing the water flow in unsaturated soils, the Richards equation (RICHARDS, 1931), are available, most of which are based on the assumption of highly simplified expressions for the relationships between the hydraulic conductivity and diffusivity and the soil water content (e.g. WARRICK, 1975; SANDERS et alii, 1988; BROADBRIDGE & WHITE, 1988; HOGARTH et alii, 1989, 1992; WARRICK et alii, 1990; BARRY et alii, 1993; ROSS &
272
MENZIANI M. - PUGNAGHI S. - ROMANO E. - VINCENZI S. - SANTANGELO R.
Precipitation (mm)
July 22-28 1997 Sept. 16-28 1997 July_fit (r = 0.991) Sept._fit (r = 0.984) July_precipitation Sept._precipitation
July 23-30 2001 Sept. 2-13 2001 July_fit (r = 0.996) Sept._fit (r = 0.998) July_precipitation Sept._precipitation
Precipitation (mm)
Precipitation (mm)
July 20-27 1999 Sept. 6-14 1999 July_fit (r = 0.982) Sept._fit (r = 0.992) July_precipitation Sept._precipitation
Cumulative Evaporation (mm)
Cumulative Evaporation (mm)
Cumulative Evaporation (mm)
time (d)
time (d) Fig. 2 - Cumulative evaporation trends during drying periods. The time t=0 corresponds to the first day of the considered period. (a) Venice 21-28 July and 15-28 September 1997; (b) Pallanzeno 19-27 July and 5-14 September 1999; (c) Milan 24-30 July and 1-13 September 2001. - Andamenti dell’evaporazione cumulativa durante il processo d’essiccamento. Il tempo t=0 corrisponde al primo giorno del periodo considerato. (a) Venezia 21-28 Luglio e 15-28 Settembre 1997; (b) Pallanzeno 19-27 Luglio e 5-14 Settembre 1999; (c) Milano 24-30 Luglio e 1-13 Settembre 2001.
273
TDR MEASUREMENTS VERTICAL WATER DISTRIBUTION
PARLANGE, 1994; PARLANGE et alii, 1997; BASHA, 1999; HOGARTH & PARLANGE, 2000; CHEN et alii, 2001). The aim of this section is to derive a solution for the linearized, one dimensional Richards equation (3) subject to any flux boundary condition and θ initial condition. The complementary conditions will be approximated by a sum of step functions. The choice about the hybrid complementary conditions follows from the remark that the soil water content profile (initial condition) and the trend of the flux at the surface (boundary condition) may be measured using TDR probes and standard meteorological sensors. For the sake of simplicity, in the text the symbol used for the experimental soil water content is the same used for the normalized soil water content or soil saturation θθ θθ . The normalized soil water content ranges between 0 and 1 corresponding to the minimum and the maximum measured values. ⎛ ⎜⎜ ⎝
− min ⎞ ⎟ − min ⎟⎠
max
∂θ ∂ 2θ ∂θ =D 2 −K ∂t ∂z ∂z
(3)
In equation (3), D is the hydraulic diffusivity and K = ∂k ∂θ ; they are assumed constant. k is the soil hydraulic conductivity; the normalized soil water content θ ranges from 0 to 1. The solution of equation (3) is simple for the following complementary conditions: θ i ( z) = 0 Φ 0 (t ) = q 0
( z 〉 0; t = 0) ( z = 0; t 〉 0)
(4)
(where q0 is a constant); that is a uniform (zero) initial condition for the soil volumetric water content and a constant flux at the surface. As described in MENZIANI et alii (2004), the solution of equation (3) is: θ (z , t ) =
+ q0 ⋅
e
q0 ⎡ 1 ⎛ K ⋅ t − z ⎞⎤ ⋅ ⎢1 − ⋅ erfc⎜⎜ ⎟⎟ ⎥ + K ⎣ 2 ⎝ 4 ⋅ D ⋅ t ⎠⎦ K ⋅z D
2
⎡ 4⋅ D ⋅t ⎛ K ⋅t + z ⎞ 1 ⎛ K ⋅ t + z ⎞⎤ ⋅⎢ ⋅ Ierfc ⎜⎜ ⎟⎟ − K ⋅ erfc⎜⎜ ⎟⎟⎥ (5) D ⎝ 4⋅ D ⋅t ⎠ ⎝ 4 ⋅ D ⋅ t ⎠⎦ ⎣
Ierfc is the iterated complementary error function (ABRAMOWITZ, 1965). 4.1. - SOLUTION
WITH STEP FUNCTIONS APPROXIMATING THE FLUX AT THE SURFACE
The experimental surface flux cannot be always represented by a simple function. In such a case, it may be very difficult or even impossible to solve equation (3). Vice versa, approximating any arbitrary boundary condition with a sum of step functions the solution of the problem is given by
the sum of expressions similar to equation (5). In fact, assuming a uniform initial condition θ i ( z ) = 0 (i.e. Φ i ( z ) = 0) and a boundary condition as sketched in fig. 3, the solution, in the time interval (tM-1, tM), is: K ⋅z q j − q j −1 ⎧⎪ K ⋅ (t − t j −1 ) − z ⋅ ⎨1 + erf +e D ⋅ 2⋅K 4 ⋅ D ⋅ (t − t j −1 ) j =1 ⎪⎩ M
θ (z , t ) = ∑
⎡ K ⋅ (t − t j −1 ) + z K ⋅ (t − t j −1 ) + z ⎤ ⎫⎪ K 2 ⋅ (t − t j −1 ) ⎢2 ⋅ ⎥⎬ ⋅ Ierfc − erfc D ⎢ 4 ⋅ D ⋅ (t − t j −1 ) 4 ⋅ D ⋅ (t − t j −1 ) ⎥ ⎪ ⎣ ⎦⎭
(6)
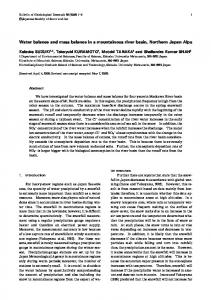
M is the number of discontinuities (at t1, t2, ..., tM, ...) where the boundary condition assumes the values: q1, q2, ..., qM, ... (besides q0). In figure 3 a constant flux q1 lasts from t0 to t1, a constant flux q2 lasts from t1 to t2 and so on. In equation (6) the difference (qj - qj-1) represents the height of the step function starting at tj-1 (clearly q0=0). In figure 4 the solid lines represent, for four successive time steps, the solutions of the linearized Richards equation assuming a null initial condition for the soil water content and a decreasing exponential flux as boundary condition (MENZIANI et alii, 2004); they are compared with the approximated solution (6) (circles). The soil moisture results agree satisfactory even though a rough time resolution was used to approximate the incoming flux. In real experimental cases this technique can be used to choose a proper rain gauge acquisition time. 4.2. - SOLUTION
WITH STEP FUNCTIONS APPROXIMATING THE INITIAL CONDITION
In the previous paragraph the boundary condition (i.e. the flux at the air-soil interface) was approximated by a sum of step functions. In a similar way, here, an arbitrary initial condition is approximated by: N
θ i ( z ) = θ 0 + ∑ (θ n − θ n−1 )⋅ H ( z − z n ) n =1
(7)
N is the total number of discontinuities (at z1, z2, ..., zN) where the initial condition assumes the values: θ1, θ2, ..., θN (besides θ0). H(x) is the Heaviside function with argument x (JONES, 1966). Now, assuming a null flux as boundary condition, the solution of the linearized Richards equation with the flux as the unknown function, formally equal to (3), says that the soil volumetric
274
MENZIANI M. - PUGNAGHI S. - ROMANO E. - VINCENZI S. - SANTANGELO R.
water content is given by the sum of (N+1) solutions: N
θ ( z , t ) = θ ( 0) ( z , t ) + ∑θ ( n ) ( z , t )
(8)
n =1
where (MENZIANI et alii, 2004): θ (0) ( z, t ) =
K ⋅z θ0 ⎧ ⎛ K ⋅t − z ⎞ ⋅ ⎨erfc⎜ ⎟+e D ⋅ 2 ⎩ ⋅ ⋅ 4 D t ⎝ ⎠
⎡ ⎛ K ⋅t + z ⎞ K ⋅ 4⋅ D ⋅t ⎛ K ⋅t + z ⋅ Ierfc⎜ ⎟− ⎢erfc⎜ D ⋅ ⋅ 4 D t ⎝ ⎠ ⎝ 4 ⋅ D ⋅t ⎣
⎞⎤ ⎫⎪ ⎟⎥ ⎬ ⎠⎦ ⎪⎭
(9)
and: θ ( n) ( z, t ) =
K ⋅z θ n − θ n −1 ⎧ ⎛ K ⋅ t + zn − z ⎞ ⋅ ⎨erfc⎜ ⎟+e D ⋅ 2 4⋅ D ⋅t ⎠ ⎝ ⎩
⎡ ⎛ K ⋅ t + zn + z ⎞ K ⋅ 4 ⋅ D ⋅ t ⎛ K ⋅ t + z n + z ⎞ ⎤ ⎫⎪ ⋅ Ierfc⎜ ⎟− ⎟⎥⎬ ⎢erfc⎜ D 4⋅ D⋅t ⎠ 4 ⋅ D ⋅ t ⎠ ⎦ ⎪⎭ ⎝ ⎝ ⎣
(10)
Generally, approximating any arbitrary boundary and initial condition with a series of step functions the solution of the linearized Richards equation is given by the sum of equations (6) and (8).
square root of the time. The experimental cumulative evaporation has been fitted with this function. The linearized Richards equation with a boundary condition on the flux and a soil water content initial condition has been considered. A general solution has been obtained approximating the flux boundary condition by a sum of step functions and with a null uniform soil water content initial condition. Moreover, a solution is obtained for a null flux at the surface and an initial condition approximated by a sum of step functions. The expression obtained adding these two solutions permits to solve the linearized Richard equation for any arbitrary boundary and initial condition. The expression obtained from the described procedure is a sum of analytical solutions, which can be very useful to solve hydrological problems. In particular the procedure allows using experimental rain gauge data, which are very common. In fact, these data may be assumed as the incoming water flux at the atmosphere-soil interface if the precipitation rate doesn’t exceed the soil infiltrability.
5. - CONCLUSION In this paper the experimental soil water content profiles measured at different test sites have been reported. These profiles clearly show different behaviour: the concavity of the profiles measured at Venice is upward while the other profiles are mainly convex. From the shape of these profiles information on the hydraulic diffusivity function and/or on the partial differential equation to be solved has been obtained. From the same profiles and from the precipitation, the cumulative evaporation has been derived by means of a mass balance equation. Treating, as usual, the drying process as desorption and assuming a constant diffusivity, the diffusion equation is analytically solved and the cumulative evaporation results a function of the
Fig. 4 - Comparison between an analytical solution of the Richards equation and the solution (6), obtained approximating the boundary condition with a sum of step functions (axes are drawn with arbitrary units). - Confronto tra una soluzione analitica dell’equazione di Richards linearizzata e la soluzione (6), ottenuta approssimando la condizione al bordo con una somma di funzioni gradino (gli assi sono disegnati con unità arbitrarie).
Acknowledgments
Fig. 3 - Step functions used to approximate the surface water flux. - Funzioni gradino usate per approssimare il flusso d’acqua alla superficie.
The Italian Ministry of Scientific and Technological Research in part funded this work. Project (MM04155323_003): The contribution of geophysics to the assessments of hydro-geological risks: exploration, monitoring and modeling.
TDR MEASUREMENTS VERTICAL WATER DISTRIBUTION
REFERENCES ABRAMOWITZ M. & SEGUN I.A. (1965) - Handbook of mathematical functions. Dover Publication, New York, USA. ASTM (2003) - D3385-94, Standard Test Method for Infiltration Rate of Soils in Field Using Double-Ring Infiltrometer. ASTM, Phyladelphia, USA. BARRY D.A., PARLANGE J.Y., SIVAPALAN M. & SANDER G. (1993) - A Class of Exact Solutions for Richards’ Equation. J. HYDROL. 142: 29-46, San Diego, CA92130, USA. BASHA H.A. (1999) - Multidimensional linearized nonsteady infiltration with prescribed boundary conditions at the soil surface. Water Resour. Res., 35: 75-83, Washington, DC 200091277, USA. BROADBRIDGE P. & WHITE I. (1988) - Constant rate rainfall infiltration: A versatile nonlinear model-I. Analytical solution. Water Resour. Res., 24: 145-154, Washington, DC 20009-1277, USA. BRUBAKER K.L. & ENTEKHABI D. (1996) - Analysis of feedback mechanisms in land-atmosphere interaction. Water Resour. Res., 32: 1343-1357, Washington, DC 20009-1277, USA. BRUTSAERT W. (1988) - The formulation of evaporation from land surfaces. In: D.S. BOWLES & P.E. O’CONNELL (Eds.): Recent advances in the modelling of hydrologic systems. NATO, Series C: Mathematical and Physical Sciences, 345: 6784, Dordrecht (The Netherlands). BRUTSAERT W. & CHEN D. (1995) - Desorption and the two stages of drying of natural tallgrass prairie. Water Resour. Res., 31: 1305-1313, Washington, DC 20009-1277, USA. CHEN JIANN-MOU, TAN YIH_CHI, CHEN CHU_HUI & PARLANGE J.Y. (2001) - Analytical solutions for linearized Richards equation with arbitrary time-dependent surface fluxes. Water Resour. Res., 37: 1091-1093, Washington, DC 20009-1277, USA. GEORGAKAKOS K.P. (1996) - Soil moisture theories and observations. J. HYDROL., 184 (1-2): 1, San Diego, CA92130, USA. HILLEL D. (1980a) - Fundamentals of soil physics, pp. 413, Academic Press, New York, USA. HILLEL D. (1980b) - Applications of soil physics, pp. 385, Academic Press, New York, USA. HOGARTH W.L., PARLANGE J.Y. & BRADDOCK R.D. (1989) First integrals of the infiltration equation, 2, Nonlinear conductivity. Soil Sci., 148 (3): 165-171. HOGARTH W.L., PARLANGE J.Y. & NORBURY J. (1992) Addendum to “First integrals of the infiltration equation”. Soil Sci., 154: 341-343. HOGARTH W.L. & PARLANGE J.Y. (2000) - Application and improvement of a recent approximate analytical solution of Richards’ equation. Water Resour. Res., 36: 1965-1968, Washington, DC 20009-1277, USA. HORNBERGER G.M., RAFFENSPERGER J.P., WIBERG P.L. & ESHLEMAN K.N. (1998) - Elements of Physical Hydrology. pp.312, Johns Hopkins University Press, Baltimore, Maryland 21218, USA. JONES D.S. (1966) - Generalized functions. McGraw-Hill, New York, USA. LIU C.C.K. & BRUTSAERT W. (1978) - A non linear analysis of the relationship between rainfall and runoff for extreme floods. Water Resour. Res., 14: 75-83, Washington, DC 200091277, USA. LOAGUE K.M. & FREEZE R.A. (1985) - A comparison of rain-
275
fall-runoff modeling techniques on small upland watersheds. Water Resour. Res., 21: 229-248, Washington, DC 200091277, USA. MENZIANI M., PUGNAGHI S., PILAN L., SANTANGELO R. & VINCENZI S. (1999) - Field experiments to study evaporation from a saturated bare soil. Phis. Chem. Earth (B), 24, (7): 813-818. MENZIANI M., PUGNAGHI S., VINCENZI S. & PILAN L. (2000) - Mesoscale Alpine Programme (MAP) Soil Moisture TDR Measurements at Pallanzeno - Lago Maggiore Target Area. Università di Brescia, Dip. d’Ingegneria Civile, Technical Report N. 10 IV, Brescia. E-publication: http://civserv.ing.unibs.it / utenti /ranzi/MAP/SOP/ tr05unimo.PDF. MENZIANI M., PUGNAGHI S., PILAN L., SANTANGELO R. & VINCENZI S. (2001) - TDR Soil Moisture Measurements at the Lago Maggiore MAP Target Area: Preliminary Results. Phis. Chem. Earth (B), 26, (5-6): 431-436. MENZIANI M., PUGNAGHI S., SANTANGELO R. & VINCENZI S. (2002)- TDR Soil Moisture Data Measured in Different Soils. Proceedings of the Twenty-Second Annual AGU Hydrology Days: 157-167, Fort Collins, CO 80523-1372, USA. MENZIANI M., PUGNAGHI S., ROMANO E. & VINCENZI S. (2004) - Solutions of the linearized Richards equation with arbitrary boundary and initial conditions: flux and soil moisture respectively. Proceedings of the AGU Hydrology Days 2004: 148-156, Fort Collins, CO 80523-1372, USA. MENZIANI M., PUGNAGHI S., VINCENZI S.& SANTANGELO R. (2005) - Water Balance in Surface Soil: Analytical Solutions of Flow Equations and Measurements in the Alpine Toce Valley. In: C. DE JONG, D. COLLINS & R. RANZI (Eds.): Climate and Hydrology in Mountain Areas. John Wiley & Sons: 85-100, U.K. PARLANGE J.Y., BARRY D.A., PARLANGE M.B., HOGARTH W.L., HAVERKAMP R., ROSS P.J., LING L. & STEENHUIS T.S. (1997) - New approximate analytical technique to solve Richards equation for arbitrary surface boundary conditions. Water Resour. Res., 33: 903-906, Washington, DC 20009-1277, USA. RICHARDS L.A. (1931) - Capillary conduction of liquids through porous mediums. Physics, 1: 318-333. ROSS P.J. & PARLANGE J.Y. (1994) - Comparing exact and numerical solutions of Richards’ equation for one-dimensional infiltration and drainage. Soil Sci., 157: 341-344. SANDER G.C., PARLANGE J.Y., KUHNEL V., HOGARTH W.L., LOCKINGTON D. & O’KANE J.P.J. (1988) - Exact nonlinear solution for constant flux infiltration. J. Hydrol., 97: 341346, San Diego, CA92130, USA. TOPP G.C., DAVIS. J.L. & ANNAN A.P. (1980) - Electromagnetic determination of soil water content: measurements in coaxial transmission lines. Water Resour. Res., 16 (3): 574 - 582, Washington, DC 20009-1277, USA. U.S.D.A. - S.C.S. (1975) - Soil Taxonomy. Handbook, 436, Washington, USA. WARRICK A.W. (1975) - Analytical solutions to the one-dimensional linearized moisture flow equation for arbitrary input. Soil Sci., 120: 79-84. WARRICK A.W., LOMEN D.O.& ISLAS A. (1990) - An analytical solution to Richards’ equation for a draining soil profiles. Water Resour. Res. 26: 253-258, Washington, DC 20009-1277, USA.