Tim Newson1 Associate Professor Geotechnical Research Centre, Department of Civil and Environmental Engineering, University of Western Ontario, London, Ontario, N6A 5B9, Canada e-mail:
[email protected]
Ahmed El-Sheikh Senior Lecturer Division of Civil Engineering, University of Dundee, Dundee DD1 4HN Scotland, United Kingdom e-mail:
[email protected]
Mathematical Modeling of the Biomechanics of the Lamina Cribrosa Under Elevated Intraocular Pressures Comprehensive understanding of the biomechanical performance of the lamina cribrosa (LC) and the optic nerve head is central to understanding the role of elevated intraocular pressures (IOP) in chronic open angle glaucoma. In this paper, six closed-from mathematical models based on different idealizations of the LC are developed and compared. This approach is used to create further understanding of the biomechanical behavior by identifying the LC features and properties that have a significant effect on its performance under elevated IOP. The models developed are based on thin circular plate and membrane theories, and consider influences such as in-plane pretension caused by scleral expansion and large deflections. Comparing the results of the six models against a full ocular globe finite element model suggests the significance of the in-plane pretension and the importance of assuming that the sclera provides the LC with a clamped edge. The model that provided the most accurate representation of the finite element model was also used to predict the behavior of a number of LC experimental tests presented in the literature. In addition to the deflections under elevated IOP, the model predictions include the distributions of stress and strain, which are shown to be compatible with the progression of visual field loss experienced in glaucoma. 关DOI: 10.1115/1.2205372兴 Keywords: lamina cribrosa, mathematical modeling, glaucoma, plate analysis, membrane analysis
1
Introduction
Glaucoma is a major cause of irreversible blindness in Europe and North America and the third most common cause of blindness worldwide. Chronic open angle glaucoma affects 1% of the population over 40 and more than 10% over 80. The hypothesis of pressure-dependent glaucomatous optic neuropathy, in which the elevation of intraocular pressure 共IOP兲 causes optic nerve damage and hence visual impairment, is generally accepted. Reference can be made for example to Anderson 关1兴, Emery et al. 关2兴, Quigley 关3兴, and Harju 关4兴. In this hypothesis, the primary site of damage is the lamina cribrosa 共see Fig. 1兲, which is the main supporting component of the optic nerve head. The lamina cribrosa 共LC兲 is a very thin structure located in the center of the optic nerve head, through which the optic nerve fibers 共axons兲 pass. Retrodisplacement of the LC under elevated IOP is thought to cause structural damage to the axons and reduce blood flow, leading to loss of vision as reported by Levy and Crapps 关5兴 and Quigley et al. 关6兴. This relationship between the LC deformation and the axonal damage is not yet fully understood, although the association between the two phenomena is thought to be significant. Several efforts have been made to date to link LC deformation and the resulting stresses and strains to axonal damage. Mathematical techniques idealizing the LC as a homogenous structure and employing either plate or membrane analogy have been used because of the apparently simple geometry of the LC. These efforts include an attempt by Chi et al. 关7兴 to idealize the LC as a membrane 共i.e., assuming no flexural resistance兲 with a resulting overestimation of deformation under IOP. Dongqi and Zeqin 关8兴 1 Corresponding author. Contributed by the Bioengineering Division of ASME for publication in the JOURNAL OF BIOMECHANICAL ENGINEERING. Manuscript received December 13, 2004; final manuscript received February 3, 2006. Review conducted by Michael Sacks.
496 / Vol. 128, AUGUST 2006
later developed a mathematical model for a thin elastic circular plate representing an idealized LC. The model considered the effect of both the IOP and the in-plane pretension due to scleral expansion, although the in-plane pretension was not directly related to the value of the IOP. This was followed by another effort by Edwards and Good 关9兴. Their model was different in two ways: it ignored the in-plane pretension caused by scleral expansion and was based on a large deflection idealization of the LC. The model was extended to predict the stresses and strains experienced by the optic nerve axons due to IOP, hence, providing a further step by attempting to relate IOP elevation to axonal injury. These models and other contributions 共such as Bellezza 关10兴兲 have led to notable advances in our understanding of the LC biomechanics and the complexity of its structure. The degree of fixity offered by the connection with the sclera, the influence of the pretension caused by scleral expansion and the ratio between flexural and in-plane stiffness are among the factors that could have a strong effect on the structure and accuracy of the mathematical model representing the LC behavior. Instead of adopting one set of assumptions 共regarding the importance of these factors兲 in developing a mathematical model, this research follows a different strategy. It considers six modeling techniques built on different combinations of modeling idealizations, which consider how the aforementioned factors should be incorporated into the models. By assessing and comparing these techniques the importance of each factor is determined. This approach should be seen as a first step towards the development of more complex and potentially more accurate models, and also provides relatively simple and usable mathematical models for preliminary assessment of problems. Similar research to assess the effect of other issues such as anisotropy and viscoelas-
Copyright © 2006 by ASME
Transactions of the ASME
Downloaded 18 Jun 2007 to 129.100.229.26. Redistribution subject to ASME license or copyright, see http://www.asme.org/terms/Terms_Use.cfm
Fig. 1 Cross section through the human optic nerve head
ticity is currently underway. The results of this work could also help improve understanding of the LC biomechanics and guide its future mathematical and numerical modeling.
2
Mathematical Modeling
Mathematical modeling is an attractive tool in understanding the behavior of structures. With the closed form solutions obtained, the influence of various parameters and modeling idealizations can be directly recognized and parametric studies easily performed. However, as mathematical modeling is only practically feasible for simple structures, idealizations are often necessary and analysts need to select the parameters expected to have the greatest influence for inclusion in the model. Undoubtedly, more complex analysis can be conducted using other approaches such as the finite element or finite difference method. However, closed form mathematical modeling should be seen as an important first step to provide an insight into the importance of parameters, to create useful benchmarks for future calibration exercises and to develop simple, approximate “engineering” methods for initial analysis and interpretation. In modeling the LC, there is uncertainty regarding a number of aspects, mainly: • • • • •
the boundary condition, i.e., whether the LC is only simply supported along the interface with the sclera or is there additional restraint against rotation along this line the effect of in-plane pretension due to scleral expansion the relative importance of the in-plane and flexural stiffness of the LC the spatial heterogeneity in the biomechanical properties of the LC the constitutive relationship of the lamina cribrosa material
This study is intended to help clarify the current uncertainty and guide decisions on how to include these factors in future modeling
work. Only the first three factors are included at this stage. The fourth and fifth factors, which require both experimental and mathematical studies, are the focus of the next stage of research. However, in the absence of specific experimental data the constitutive relationship reported by Woo et al. 关11兴 will be used to represent the material behavior. The work presented benefits from the efforts made earlier to produce general solutions for circular plates with various loading and boundary conditions. The most notable contributions were made by Timoshenko and Woinowsky-Krieger 关12兴. The following six mathematical models are built on different modeling idealizations, which are devised to enable assessing the importance of the first three factors. A brief description of these idealizations is provided in Table 1 and free body diagrams for each of the models are shown in Fig. 2.
2.1 Model 1 With a Clamped Edge and No In-Plane Pretension. The first model ignores in-plane pretension due to scleral expansion and assumes the sclera provides the LC with a clamped edge, where rotation but not in-plane deformation is prevented. This recognizes that the 0.12 mm thick LC is much thinner than the surrounding 1.0 mm thick sclera. This model assumes the LC to be homogeneous, isotropic and with a uniform thickness. It also assumes that out-of-plane deformation is small compared with the LC dimensions, and as a result, the changes in the thickness of the plate with deformation are ignored. From analysis of a plate segment bounded by two diametral and two cylindrical sections 共Fig. 3兲 and considering the following boundary conditions: • •
the deflection along the plate edge is prevented and the slope of the deflection surface along the edge and at the center is zero
The retrodisplacement of the uniformly loaded LC, w, at any
Table 1 Modeling idealization considered in models 1–6 Model 1 2 3 4 5 6
Edge with sclera
In-plane pre-tension due to scleral expansion
Other features
Clamped Simple Clamped Simple Clamped Simple
Ignored Ignored Considered Considered Ignored Ignored
Small deflection model Small deflection model Small deflection model Small deflection model Large deflection model Membrane model
Journal of Biomechanical Engineering
AUGUST 2006, Vol. 128 / 497
Downloaded 18 Jun 2007 to 129.100.229.26. Redistribution subject to ASME license or copyright, see http://www.asme.org/terms/Terms_Use.cfm
Fig. 2 Free body diagrams of the modeling idealizations in models 1–6
point at distance r from the center is given by Timoshenko and Woinowsky-Krieger 关12兴 using the circular plate theory as w=
q共R2 − r2兲2 64D
共1兲
where R is the radius of the LC, D is the flexural rigidity of the LC, D = Eh3 / 12共1 − 2兲, E is the elastic 共Young’s兲 modulus, h is the LC thickness, is Poisson’s ratio, q = IOP− S, the difference between the IOP and the retrolaminar pressure 共S—also called the optic nerve tissue pressure兲. S is given as a function of IOP 关8,3兴 in the form
for IOP ⬍ 20 mm Hg and
S = 0.5IOP
S = 10 mm Hg for IOP ⬎ 20mm Hg From the following equations relating the radial and tangential bending stresses, r and t, to the displacement, w:
r =
冉
6D d2w dw + h2 dr2 r dr
冊
and
t =
冉
6D 1 dw d 2w + 2 2 dr h r dr
冊
共2兲
the stresses can be obtained as
r = −
3q 2 关R 共1 + 兲 − r2共3 + 兲兴 8h2
t = −
and
3q 2 关R 共1 + 兲 − r2共1 + 3兲兴 8h2
共3兲
At the center 共r = 0兲, the retrodisplacement and the stresses become wr=0 =
qR4 , 64D
共r兲r=0 = 共t兲r=0 = −
3qR2共1 + 兲 8h2
共4兲
and at the edge of the plate 共where r = R兲 wr=0 = 0,
共r兲r=R =
3qR2 4h2
and
共t兲r=R =
3qR2 4h2
共5兲
Note that • • Fig. 3 Analysis of a laterally loaded circular plate „see Ref. †12‡…
498 / Vol. 128, AUGUST 2006
While w is highest at the center, r is highest along the plate edge. At the plate center, the stresses calculated using Eq. 共4兲 cause tension on the posterior side and compression on the anterior side. The opposite is true along the edge where Eq. 共5兲 is used. Transactions of the ASME
Downloaded 18 Jun 2007 to 129.100.229.26. Redistribution subject to ASME license or copyright, see http://www.asme.org/terms/Terms_Use.cfm
where Rs is the radius of the sclera. The effect of in-plane pretension on the retrodisplacement of a circular plate has been obtained earlier by Dongqi and Zeqin 关8兴 in the form wq 1+␣
w=
共12兲
where wq is the retrodisplacement for an equivalent plate without in-plane forces 共as given in Eq. 共1兲兲, and ␣ = NR2 / 14.68D. Substituting the values of N and ␣ in Eq. 共12兲, w is obtained as w=
r = r1 + r2, 2.2 Model 2 With a Simply Supported Edge and No InPlane Pretension. Another idealization of the LC is based on reducing the importance of the rotational restraint provided by the sclera. The model in this case is obtained from model 1 by releasing the restraint against edge rotation and therefore applying an edge bending moment equal and opposite to that developed by the edge clamp of model 1. In model 1, the bending moment along the edge clamp is
r共r=R兲h2 6
=−
qR2 8
qR2 共R2 − r2兲 16D共1 + 兲
r2 = t = t1 + t2,
where
冉
q共R2 − r2兲 5 + 2 2 R −r 64D 1+
t = −
冊
共8兲
and
qR4共5 + 兲 64共1 + 兲D
3q 2 关R 共3 + 兲 − r2共1 + 3兲兴 8h2
and
共r兲max = 共t兲max = −
3qR2共3 + 兲 8h2
Note that the stresses calculated using Eq. 共10兲 are tensile on the posterior side of the LC and compressive on the anterior side. 2.3 Model 3 With a Clamped Edge and In-Plane Pretension. The in-plane pretension in this model arises from the scleral expansion due to the application of the IOP. The value of the pretension, N, can be derived by analyzing the sclera as an idealized perfect sphere. Equilibrium of the scleral hemisphere under IOP and N leads to 共Fig. 4兲 or
N=
3Aq 2 关R 共1 + 兲 − r2共1 + 3兲兴, 8h2 N h
共15兲
In Eqs. 共14兲 and 共15兲 rl and tl are caused by the lateral load q, while r2 and t2 are due to the in-plane pretension. Note that while rl and tl are tensile on the posterior side of the plate and compressive on the anterior side, r2 and t2 are always tensile. 2.4 Model 4 With a Simply Supported Edge and In-Plane Pretension. The development of this model is similar to model 3. The retrodisplacement of the LC again takes the form in Eq. 共12兲, but wq in this case is obtained from Eq. 共8兲 from model 2 with a simply supported edge. In this case, ␣ is also different according to Timoshenko and Woinowsky-Krieger 关12兴
IOPRs 2
Journal of Biomechanical Engineering
␣=
w=
共9兲
共10兲
N共2Rs兲 = IOPRs2
t1 = −
共14兲
and
N R2 4.20D
共16兲
As a result, the deflection w is obtained as
w and r given in Eqs. 共8兲 and 共9兲 have zero values along the edge and a parabolic distribution inside the plate. The maximum values for the retrodisplacement, w, and the stresses, r and t, exist at the center, where r = 0: wmax =
N , h
t2 =
The stresses r and t, are also obtained in the same manner as 3q r = − 2 共3 + 兲共R2 − r2兲 8h
3Aq 2 关R 共1 + 兲 − r2共3 + 兲兴, 8h2
共7兲
Adding this to the deflection of the clamped plate in Eq. 共1兲, results in the deflection of a simply supported plate w=
r1 = −
where
共6兲
Applying an equal and opposite moment of magnitude qR2 / 8 along the plate edge while allowing it to rotate there results in the following distribution of deflection: w=
共13兲
where A = 29.36D / 29.36D + IOPRsR2. The stresses, r and t, can then be obtained using the equations
Fig. 4 Equilibrium of the sclera
Mr = −
29.36Dwq = Awq , 29.36D + IOPRsR2
共11兲
8.4Dwq = Bwq 8.4D + IOPRsR2
共17兲
8.4D 8.4D + IOPRsR2
共18兲
where B=
The stresses are obtained in a similar fashion to model 3 in the form
r = r1 + r2
and
t = t1 + t2
共19兲
where
r1 = − t1 = −
3Bq 共3 + 兲共R2 − r2兲 8h2
3Bq 2 关R 共3 + 兲 − r2共1 + 3兲兴 8h2
r2 = t2 =
N IOPRs = h 2h
共20兲
and
共21兲 共22兲
2.5 Model 5 With a Clamped Edge and Large Deflection. In the above four models, the deflections are assumed to be AUGUST 2006, Vol. 128 / 499
Downloaded 18 Jun 2007 to 129.100.229.26. Redistribution subject to ASME license or copyright, see http://www.asme.org/terms/Terms_Use.cfm
smaller than the plate thickness. As a result, the strain at the middle plane of the plate is assumed to be small and negligible. However, if the deflection is no longer assumed to be smaller than the thickness, yet still small in comparison with other dimensions, the strain of the middle plane must be considered. An approximate solution for this problem is provided by Timoshenko and Woinowsky-Krieger 关12兴 in the form
q共R2 − r2兲2
w=
r = −
64D
共23兲
,
3q 2 关R 共1 + 兲 − r2共3 + 兲兴 8h2
共24兲
where = 1 / 1 + 0.488共w2o / h2兲, defines the effect of the stretching of the middle plane on the plate deflection, and w0 is the retrodisplacement at the center. Note that while large deflections are considered in the development of Eqs. 共23兲 and 共24兲, the corresponding thickness change under load is ignored for simplicity. In solving Eqs. 共23兲 and 共24兲, Eq. 共23兲 is rewritten for the center point 共r = 0兲 as qR4 64D
Range of stress 共kPa兲 G 共MPa兲
E共MPa兲
From
To
0.12 0.22 0.61
0.358 0.656 1.818
0.0 8.0 15.0
8.0 15.0 –
Lamina cribrosa
and
3q t = − 2 关R2共1 + 兲 − r2共1 + 3兲兴 8h
w0 =
Table 2 Material properties for the lamina cribrosa as given by Woo et al. „see Ref. †11‡…. Note: MPa= N / mm2 and kPa = 0.001 N / mm2.
1 w2o 1 + 0.488 2 h
共25兲
This third order equation is first solved for w0. Then the distribution of w can be obtained from w = w0共1 − r2 / R2兲2 and r and t from Eq. 共24兲. Notice that the parameter increases in significance with large deformation. For instance, for w0 = 0.5 h, equals 0.89. With w0 increasing to h , 2h, and 4h , becomes 0.67, 0.34, and 0.11 respectively. This means that the plate stiffness grows gradually with larger deformation.
V =0 c1
Another requirement is introduced that the change in the work done by the differential pressure acting through a virtual displacement equals the change in strain energy associated with the virtual displacement. If the virtual displacement is chosen as ␦w 共which is directly proportional to w0兲, this requirement can be expressed by the equation
V ␦w0 = 2q␦w0 w0
冕 冋 冉 冊册 R
1−
0
冉 冊
w = w0 1 −
r2 R2
2
冑 3
w0 = R where
冑 3
=
冉 冊
du 1 dw r = + dr 2 dr t =
2
u r
u = r共R − r兲共c1 + c2r兲
共27兲 共28兲 共29兲
where c1 and c2 are constants. The strain energy in the LC associated with the stretching of the membrane is given by V=
Eh 1 − 2
冕
R
共r2 + t2 + 2rt兲rdr
共30兲
0
To calculate the deflection of the membrane, the above equations are solved to find c1, c2, and w0. First, the right sides of Eqs. 共26兲–共29兲 are substituted for the corresponding terms in Eq. 共30兲. Using the resulting form of Eq. 共30兲, c1 and c2 are found by imposing the requirements that 500 / Vol. 128, AUGUST 2006
冑 3
w=
2 2
共31兲
rdr
qR Eh
共32兲
6615共2 − 1兲 2共27912 − 4250 − 7505兲
冑 冉 冊
3 6615共2 − 1兲 r qR 1− R 2 2共2791 − 4250 − 7505兲 Eh R
2
共33兲
By using = 0.49 共according to Woo et al. 关11兴兲, we obtain w0 = 0.65R冑3 qR / Eh. The membrane stress, r, 共i.e., the in-plane radial stress due to the membrane action兲 is also obtained as
冑
共26兲
The derivation of w0 for a circular membrane follows a strainenergy/virtual deflection approach, which is common in stressstrain problems of this kind. The radial and transverse strains, r and r, and the radial displacement, u, at radius r are given by
r R
After manipulation and following the procedure presented in Ref. 关13兴, the solution for the maximum displacement can finally be presented as
and therefore w is determined as 2.6 Model 6 With the LC Modeled as a Membrane Supported Along Its Periphery. As a step further from the above model, model 6 assumes the plate has no flexural stiffness and its behavior under lateral pressure is dominated by the membrane action. The model again assumes that w has the same dependence on r as in other models
V =0 c2
and
3
共r兲r=0 = 0.414
Eq2R h2
冑 3
and
共r兲r=R = 0.321
Eq2R . h2 共34兲
3
Comparative Study of Mathematical Models
A brief comparative study of the six mathematical models developed above is conducted to identify the effect of various idealizations. All six models are used to predict the central displacement of the LC under a range of IOP between 10 and 60 mm Hg 共0.00133, and 0.0079 N / mm2兲, or q共= IOP—the retrolaminar pressure兲 between 5 and 50 mm Hg 共0.00067, and 0.006, 67 N / mm2兲. The LC and scleral dimensions used are as reported by Yan et al. 关14兴, Woo et al. 关11兴, and Dongqi and Zeqin 关8兴: R= LC radius =0.6 mm, h = LC thickness =0.12 mm, Rs= scleral radius =12 mm, and hs= scleral thickness =1 mm. The shear modulus, G, of the LC is assumed to be that given by Woo et al. 关11兴 in the form of the trilinear relationships shown in Table 2. The modulus of elasticity, E, is derived from the shear modulus using the relation G = E / 2共l + 兲, where is Poisson’s ratio, taken as 0.49. For each IOP increment, calculations are made for q 共⫽IOP-S兲, stresses 共r and t兲, E 共Table 2兲, D 共Eh3 / 12关1 − 2兴兲 and w. Due to the trilinear expression used for E, the relationship between pressure and deformation is nonlinear. Transactions of the ASME
Downloaded 18 Jun 2007 to 129.100.229.26. Redistribution subject to ASME license or copyright, see http://www.asme.org/terms/Terms_Use.cfm
Fig. 5 Central displacement comparisons between the mathematical models
The central displacements obtained from the six models are compared in Fig. 5 The following observations can be made: •
The edge fixity has a large effect on the model predictions. Models 2 and 4 with simply supported edges deform considerably more than models 1 and 3 with clamped edges 共by 268% and 110%, respectively兲. • Introducing the in-plane pretension caused by scleral expansion also has a notable effect. It reduces the displacement of the model with a simply supported edge 共model 2兲 by 61% and the model with a clamped edge 共model 1兲 by 32%. • Modifying the mathematical model to recognize large deformations 共model 5兲 leads to relatively small effects on the results 共below 5%兲. This is due to the fact that the deformations obtained under the largest IOP considered did not exceed 35% of the thickness of the lamina cribrosa. • Modeling the LC as a membrane results in large displacement predictions, but the stiffness of the membrane increases rapidly with more curvature as would be expected.
Reference can also be made to Fig. 6 showing the distribution of model displacement across the LC diameter under IOP =25 mm Hg 共i.e., q = 15 mm Hg or 0.002 N / mm2, allowing for a retrolamina pressure S = 10 mm Hg兲. The observations noted above regarding the central displacement predictions are also valid when comparing the displacement distributions in this figure. Notice also the reduced displacement near the model edge in cases with clamped boundary conditions.
Fig. 6 Distribution of displacement across LC diameter under IOP= 25 mm Hg „q = 15 mm Hg or 0.002 N / mm2… as predicted by mathematical models
Journal of Biomechanical Engineering
4
Further Assessment of Models
In this section, the predictions of the six models are also compared against the results of a nonlinear finite element 共FE兲 model of the whole eye. This numerical model, which incorporates the lamina cribrosa, the sclera, and the cornea, is not based on any a priori assumptions of the LC’s boundary conditions, e.g., in-plane pretension, etc. The FE model has been constructed in this form to provide comparative predictions and to guide the selection of the most suitable closed-form mathematical model for predicting the behavior of the LC. This model has been used successfully to predict the biomechanical performance of the cornea under elevated IOP in an earlier study 关15兴. In this work it is intended to make up for the current paucity of available experimental data in validating the mathematical models presented herein. However, it should be the aim of future work to address this shortfall and make available reliable laboratory data on the LC behavior. The nonlinear FE model uses 4000 linear strain, triangular elements arranged in 40 layers, with 100 elements per layer 共see Figs. 7共a兲 and 7共b兲兲. General purpose thin shell elements are used throughout for their ability to cope with small as well as large deformations. Each element has three corner nodes with six degrees of freedom per node 共u , v , w , x , y , z兲. The model is built using Abaqus FE software package 关16兴. The analyses consider both geometric nonlinearities due to change of joint coordinates and material nonlinearities according to the relationships given in Tables 2 and 3. In tracing the nonlinear behavior, Riks arc method is adopted 关17兴. In this method, load increments vary according to the current stage of overall behavior, and are controlled automatically such that a solution is obtained even close to the points of instability. The model is supported at three points along the main circle of the sclera, which is parallel to the corneo-scleral intersection. This choice of boundary conditions was adopted so that it has the minimum effect on the behavior of the LC part of the model. The construction of the FE model is based on an earlier study to optimize the finite element analysis of the eye globe 关15兴. The study considered several aspects including the density of the finite element mesh, the thickness variation within the cornea, and the significance of the out-of-plane flexural and torsional resistance of the globe components. The study confirmed the importance of using a dense mesh and incorporating the out-of-plane resistance components. Modeling the thickness variation of the cornea did not lead to notable variation in overall behavior predictions. While detailed validation and calibration of the whole eye globe finite element model 共including the geometric and constitutive assumptions兲 is still in progress, this approach has provided a benchmark for assessing the mathematical models presented in this paper. The dimensions used in the model are: lamina cribrosa: AUGUST 2006, Vol. 128 / 501
Downloaded 18 Jun 2007 to 129.100.229.26. Redistribution subject to ASME license or copyright, see http://www.asme.org/terms/Terms_Use.cfm
Table 3 Material properties for the cornea and the sclera as given by Woo et al. „see Ref. †11‡…. Note: MPa= N / mm2 and kPa= 0.001 N / mm2. G 共MPa兲
Fig. 7 Details of the finite element meshes used in analysis
R = RLC = 0.6 mm, h = LC thickness= 0.12 mm; cornea: Rc = Rcornea = 6 mm, hc = hcornea = 0.6 mm; and sclera: Rs = Rsclera = 12 mm and hs = hsclera = 1.0 mm. The moduli of elasticity of the cornea and the sclera are derived from the trilinear relationships given by Woo et al. 关11兴 for the shear modulus, G, and assuming = 0.49. The results are listed in Table 3.
E 共MPa兲
Range of stress 共kPa兲 From
To
Cornea
0.18 0.37 0.81 0.90
0.536 1.103 2.414 2.682
0.0 4.0 12.5 0.0
4.0 12.5 – 10.0
Sclera
1.40 2.70
4.172 8.046
10.0 22.0
22.0 –
The model was subjected to an IOP range between 10 and 60 mm Hg 共0.0013 and 0.0079 N / mm2兲. IOP was applied as a uniform pressure acting on the internal faces of all elements forming the model. The LC was additionally subjected to the corresponding retrolaminar pressure in accordance with the relations given in model 1. The central displacement of the LC part of the model, relative to the surrounding sclera, was compared to the predictions of the six mathematical models and the results are given in Fig. 8. The comparisons show clearly that model 3 with a clamped edge and in-plane pretension achieved the closest agreement with the FE model. Adopting simple edge supports or modeling the lamina cribrosa as a membrane clearly resulted in an overestimated displacement compared with the FE model. The error margin associated with model 3 was below 10% at all IOP levels. Ignoring the in-plane pretension caused by scleral expansion 共as in model 1兲 caused a growth in the error margin to between 35% and 45%. Enabling the model to consider large outof-plane deflections reduced the errors slightly and made it evident that the in-plane pretension was a more influential factor than the accurate modeling of the large deflections. The distribution of displacement across the LC diameter under IOP =25 mm Hg is also plotted in Fig. 9 as obtained by the FE and the six mathematical models. The close correlation with model 3 is maintained across the whole diameter. There is also strong evidence of very limited rotation along the LC edge in the FE model, indicating a behavior pattern close to that associated with a clamped edge. These findings show the importance of in-plane pretension and the edge fixity provided by the sclera in modeling the behavior of the LC. Future work, whether closed-form mathematical or numerical, could build on these findings in the efforts to study the
Fig. 8 Central displacement comparisons between the FE and mathematical models
502 / Vol. 128, AUGUST 2006
Transactions of the ASME
Downloaded 18 Jun 2007 to 129.100.229.26. Redistribution subject to ASME license or copyright, see http://www.asme.org/terms/Terms_Use.cfm
Fig. 9 Distribution of displacement across the LC diameter under IOP =25 mm Hg according to the finite element and the mathematical models
mechanics of the LC and also the importance of other factors, such as viscoelasticity and the structural support of the axons.
5
Assessment Against Experimental Data
A further assessment of the most successful model 共compared to the finite element analysis兲, number 3, is done by comparing its predictions to results of experimental testing reported by Levy and Crapps 关5兴 and by Yan et al. 关18兴 on LC specimens. The dimensions used in the mathematical modeling are: R = 0.6 mm, h = 0.120 mm, Rs = 12.0 mm, and hs = 1.0 mm.
Fig. 11 Stress distribution on the anterior face of the lamina cribrosa at four different levels of IOP as obtained using model 3
The resulting model predictions match closely the test data as shown in Fig. 10. The comparisons start at IOP= 10 mm Hg as this pressure was needed in the experiments to ensure the specimens had been inflated and become free of wrinkles. Hence, the disaplacements are relative to this geometric datum and have been corrected for the appropriate retrolamina pressure. Note also that the comparisons with the Levy and Crapps 关5兴 results refer to the global average displacements of the LC. In these tests, the profile of the LC was monitored under elevated IOP and the average displacement 共rather than the central displacement兲 was reported in their paper.
6
Stress And Strain Distribution
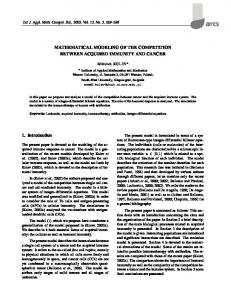
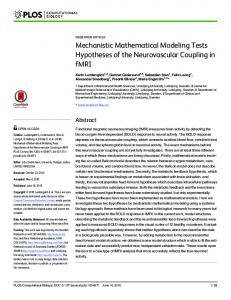
The distributions of stress and strain across the diameter of the lamina cribrosa, as obtained using model 3, are illustrated in Figs. 11 and 12, respectively. The dimensions and material properties used are: h = 0.12 mm, R = 0.6 mm, Rs = 12 mm, and = 0.49. The modulus of elasticity, ELC, is taken as 0.358 MPa as given in Table 2. The stresses and strains are significantly higher along the edges of the lamina cribrosa and gradually reduce towards the center. This observation ties closely with the earlier finding by GarwayHeath et al. 关19兴 that the loss of vision in glaucomatous eyes starts along the boundaries and grows towards the center. The retinal axons responsible for transmitting the vision signals along the boundaries are known to cross the lamina cribrosa near its edge. It appears therefore that the high stresses and strains in the LC edge could be responsible for damage to the axons transmitting the boundary vision signals. Then with higher IOP, the stresses and strains closer to the center of the LC grow, spreading the damage to the axons transmitting vision signals from more central areas.
7
Fig. 10 Comparison between model 3 predictions and earlier experimental data
Journal of Biomechanical Engineering
Conclusions
Six mathematical approaches to the biomechanical modeling of the LC are introduced in this paper. In particular, the LC boundary condition, the effect of the surrounding sclera, and the relative significance of in-plane and flexural stiffness are varied between the models. Comparisons with a full ocular finite element model, AUGUST 2006, Vol. 128 / 503
Downloaded 18 Jun 2007 to 129.100.229.26. Redistribution subject to ASME license or copyright, see http://www.asme.org/terms/Terms_Use.cfm
easily using calculations that could be developed rapidly by hand or using a spreadsheet. 4. Further model development should be conducted to ascertain whether a more accurate representation of the structural complexity of the laminar cribrosa would produce improved predictions of the biomechanical behavior under elevated intraocular pressure.
Acknowledgment This work was partially supported by an award from the Royal Society of London, UK. The authors are grateful for the valuable contributions made by David Garway-Heath, the lead clinical researcher of the Glaucoma Research Unit, Moorfields Hospital, London.
References
Fig. 12 Strain distribution on the anterior face of the lamina cribrosa at four different levels of IOP as obtained using model 3
which does not adopt any related idealizations, indicate that considering a clamped edge and incorporating in-plane pretension are important modeling considerations. With these factors included in the closed-form mathematical model based on the circular plate theory, predictions of the behavior of the LC under elevated IOP have been achieved with good agreement with FE model and with limited available experimental data. Further, the following conclusions are drawn from the research presented in this paper: 1. The effects of boundary conditions 共i.e., end fixity兲 and in-plane pretension on the outcome of mathematical modeling are significant. Therefore, care should be taken in considering these factors when attempting to approximate in vivo conditions. 2. Modeling the lamina cribrosa as a membrane leads to large overestimations of the displacement compared with the results of FE modeling and the limited available experimental data. 3. With a relatively simple closed-form mathematical model that incorporates the most pertinent aspects, the behavior of the lamina cribrosa could be reasonably accurately predicted, enabling parametric studies to be conducted
504 / Vol. 128, AUGUST 2006
关1兴 Anderson, D. R., 1995, “Glaucoma, Its Terminology and Fundamental Nature,” Optic Nerve in Glaucoma, S. M. Dance, ed., Kugler, New York, pp. 1–14. 关2兴 Emery, J. M., Landis, D., Paton, D., Boniuk, M., and Craig, J. M., 1974, “The Lamina Cribrosa in Normal and Glaucomatous Human Eyes,” Trans. Am. Acad. Ophthalmol. Otolaryngol., 78, pp. OP290–OP297. 关3兴 Quigley, H. A., 1986, “Pathophysiology of Optic Nerve in Glaucoma,” Glaucoma, J. A. McAllister and R. P. Wilson, eds. Butterworths, London, pp. 30– 53. 关4兴 Harju, M., 2001, “Exfoliation Glaucoma: Studies on Intraocular Pressure, Optic Nerve Head Morphometry, and Ocular Blood Flow,” Academic Dissertation, Department of Ophthalmology, Haartmaninkatu, Helsinki, Section: Theories of Glaucoma. 关5兴 Levy, N. S., and Crapps, E. E., 1984, “Displacement of Optic Nerve Head in Response to Short-Term Intraocular Pressure Elevation in Human Eyes,” Arch. Ophthalmol. 共Chicago兲, 102共5兲, pp. 782–786. 关6兴 Quigley, H. A., Hohman, R. M., Addicks, E. M., Massof, R. W., and Green, W. R., 1983, “Morphologic Changes in the Lamina Cribrosa Correlated With Neural Loss in Open-Angle Glaucoma,” Am. J. Ophthalmol., 95共5兲, pp. 673–91. 关7兴 Chi, T., Ritch, R., and Stickler, D., 1989, “Racial Differences in Optic Nerve Head Parameters,” Arch. Ophthalmol. 共Chicago兲, 107, pp. 836–839. 关8兴 Dongqi, H., and Zeqin, R., 1999, “A Biomathematical Model for PressureDependent Lamina Cribrosa Behavior,” J. Biomech., 32共6兲, pp. 579–84. 关9兴 Edwards, M. E., and Good, T. A., 2001, “Use of a Mathematical Model to Estimate Stress and Strain During Elevated Pressure Induced LC Deformation,” Curr. Eye Res., 23共3兲, pp. 215–25. 关10兴 Bellezza, A. J., Hart, R. T., and Burgoyne, C. F., 2002, “The Optic Nerve Head as a Biomechanical Structure,” Invest. Ophthalmol. Visual Sci., 41共10兲, pp. 2991–3000. 关11兴 Woo, S. L., Kobayashi, A. S., Schlegel, W. A., and Lawrence, C., 1972, “Nonlinear Material Properties of Intact Cornea and Sclera,” Exp. Eye Res., 14共1兲, pp. 29–39. 关12兴 Timoshenko, S. P., and Woinowsky-Krieger, S., 1970, Theory of Plates and Shells, McGraw-Hill, New York. 关13兴 NASA, 1998, “Deflection of Circular Membrane Under Differential Pressure,” Report No. GSC-13783, NASA Tech Briefs, 22共5兲, p. 78; available online: http://www.nasatech.com/Briefs//May98/GSC13783.html. 关14兴 Yan, D. B., Coloma, F. M., Metheetrairut, A., Trope, G. E., Heathcote, J. G., and Ethier, C. R., 1994, “Deformation of the Lamina Cribrosa by Elevated Intraocular Pressure,” Br. J. Ophthamol., 78共8兲, pp. 643–648. 关15兴 Anderson, K., El-Sheikh, A., and Newson, T., 2004, “Application of Structural Analysis to the Mechanical Behaviour of the Cornea,” Interface 共USA兲, 1, pp. 1–13. 关16兴 Hibbitt, Karlsson, and Sorensen, Inc., 2004. Abaqus—Standard Users Manual, Detroit. 关17兴 Riks, E., 1972, “The Application of Newton’s Method to the Problem of Elastic Stability,” ASME J. Appl. Mech., 39, pp. 1060–1066. 关18兴 Yan, D. B., Flanagan, J. G., Farra, T., Trope, G. E., and Ethier, C. R., 1998, “Study of Regional Deformation of the Optic Nerve Head Using Scanning Laser Tomography,” Curr. Eye Res., 17共9兲, pp. 903–916. 关19兴 Garway-Heath, D. F., Poinoosawmy, D., Fitzke, F. W., and Hitchings, R. A., 2000, “Mapping the Visual Field to the Optic Disc in Normal Tension Glaucoma Eyes,” Ophthalmology, 107, pp. 1809–1815.
Transactions of the ASME
Downloaded 18 Jun 2007 to 129.100.229.26. Redistribution subject to ASME license or copyright, see http://www.asme.org/terms/Terms_Use.cfm