.
Abstract. Sampling of 1367 trees was conducted in the Side wildfire (4 May ...
CSIRO PUBLISHING
www.publish.csiro.au/journals/ijwf
International Journal of Wildland Fire, 2003, 12, 245
Corrigendum Ponderosa pine mortality following fire in northern Arizona Charles W. McHugh and Thomas E. Kolb Volume 12, Number 1 (2003), pages 7–22 There has been an error in citation of certain references in the Methods section, relating to the methods used to determine volume of crown scorch, bole char severity and ground char severity. The date error will cause the reader to refer to the incorrect publication in the References. The necessary corrections are: Page 11, column 1, line 3 up, the citation ‘Ryan 1982;’ should be ‘Ryan 1982, 1983;’. Page 11, column 2, line 10 up, the citation ‘Ryan (1982)’ should be ‘Ryan (1983)’. Page 12, column 1, line 6 down, the citation ‘Ryan (1982)’ should be ‘Ryan (1983)’. Ryan (1982) and Ryan (1983) are both given in the References to this paper.
© IAWF 2003
10.1071/WF02054
1049-8001/03/020245
CSIRO PUBLISHING
www.publish.csiro.au/journals/ijwf
International Journal of Wildland Fire, 2003, 12, 7–22
Ponderosa pine mortality following fire in northern Arizona∗ Charles W. McHughA and Thomas E. KolbB A
USDA Forest Service, Rocky Mountain Research Station, Fire Sciences Laboratory, PO Box 8089, Missoula, MT 59807, USA. Telephone: +1 406 829 6953; fax: +1 406 329 4825; email:
[email protected] B School of Forestry, Northern Arizona University, PO Box 15018, Flagstaff, Arizona 86011, USA. Telephone: +1 928 523 7491; fax: +1 928 523 1080; email:
[email protected]
Abstract. Sampling of 1367 trees was conducted in the Side wildfire (4 May 1996), Bridger-Knoll wildfire (20 June 1996) and Dauber prescribed fire (9 September 1995) in northern Arizona ponderosa pine forests (Pinus ponderosa). Tree mortality was assessed for 3 years after each fire. Three-year post-fire mortality was 32.4% in the Side wildfire, 18.0% in the Dauber prescribed fire, and 13.9% in the Bridger-Knoll wildfire. In the Dauber and Side fires, 95% and 94% of 3-year post-fire mortality occurred by year 2, versus 76% in the Bridger-Knoll wildfire. Compared with trees that lived for 3 years after fire, dead trees in all fires had more crown scorch, crown consumption, bole scorch, ground char, and bark beetle attacks. Logistic regression models were used to provide insight on factors associated with tree mortality after fire. A model using total crown damage by fire (scorch + consumption) and bole char severity as independent variables was the best two-variable model for predicting individual tree mortality for all fires. The amount of total crown damage associated with the onset of tree mortality decreased as bole char severity increased. Models using diameter at breast height (dbh) and crown volume damage suggested that tree mortality decreased as dbh increased in the Dauber prescribed fire where trees were smallest, and tree mortality increased as dbh increased in the Side and Bridger-Knoll wildfires where trees were largest. Moreover, a U-shaped dbh–mortality distribution for all fires suggested higher mortality for the smallest and largest trees compared with intermediatesize trees. We concluded that tree mortality is strongly influenced by interaction between crown damage and bole char severity, and differences in resistance to fire among different-sized trees can vary among sites. Additional keywords: Pinus ponderosa; ponderosa pine; logistic regression; fire; tree mortality; mortality prediction model.
Introduction Fire can kill a tree directly by a combination of effects on the three main tissue systems: crown, stem, and roots (Ryan 1990, 1998, 2000). Damage to these systems, either singularly or in combination, may cause mortality by adversely affecting tree physiological processes (Ryan 2000). In addition, fire may weaken a tree making it more susceptible to the attack of secondary mortality agents, such as bark beetles and pathogens (Mitchell and Martin 1980; Peterson and Arbaugh 1986; Amman and Ryan 1991; Ryan and Amman 1996; Kolb et al. 1998; Ryan 1998). Models that relate the probability of tree mortality to fire and tree characteristics have provided considerable insight into mechanisms of tree death after fire (e.g. Peterson and Arbaugh 1986; Ryan et al. 1988; Ryan and Reinhardt 1988; Saveland et al. 1990; Harrington 1993; Ryan 1998).
Mortality studies in ponderosa pine (Pinus ponderosa) and other conifer species have shown a strong positive relationship between crown damage by fire and subsequent tree mortality (Wyant et al. 1986; Harrington 1987, 1993; Reinhardt and Ryan 1988; Ryan and Reinhardt 1988; Ryan et al. 1988; Stephens 1995; Finney 1999). Crown damage has been used because it is easy to measure and crown damage directly affects whole-tree photosynthesis (Ryan 1990, 1998, 2000). Crown damage has been measured as the percentage of pre-fire live crown length or volume scorched (Herman 1954; Lynch 1959; Wagener 1961; Dieterich 1979; Wyant and Zimmerman 1983; Wyant et al. 1986; Harrington 1987, 1993; Potter and Foxx 1984; Reinhardt and Ryan 1988; Ryan et al. 1988; Stephens 1995; Finney 1999) and scorch height above ground level (Bevins 1980; Peterson 1985; Saveland et al. 1990). Peterson (1985) found that percentage of crown
∗ This manuscript was written and prepared by a U.S. Government employee on official time and therefore is in the public domain and not subject to copyright.
10.1071/WF02054
1049-8001/03/010007
8
volume scorched was strongly related to post-fire tree mortality for Douglas-fir (Pseudotsuga menziesii), lodgepole pine (Pinus contorta), subalpine fir (Abies lasiocarpa), and western red cedar (Thuja plicata) compared with scorch height. Heat damage to tissues in the tree bole can contribute to tree mortality after fire (Peterson and Arbaugh 1986, 1989; Peterson and Ryan 1986; Brown and DeByle 1987). The extent of bole damage from fire primarily depends on bark thickness and the duration of exposure to lethal temperatures (Ryan 1983, 1990, 1998). Likewise, root damage from fire can contribute to tree mortality. Accurate evaluation of root damage by fire often requires root excavation (Ryan 1983; Swezy and Agee 1991). A surrogate measure of root damage by fire is the amount of charred ground (Ryan 1983; Ryan and Noste 1985; Swezy and Agee 1991). Several factors contribute to the difficulty in determining root damage by fire, such as the spatial distribution of roots, species variation in rooting depth, species successional status, soil type and moisture content, duff moisture content and flammability, and the duration of exposure to lethal temperatures (Ryan 1983, 1990, 1998). The use of secondary agents, such as insects and fungal pathogens, in models of tree mortality after fire has been limited. Despite many reports of insect infestation of trees following fire (Morris and Mowat 1958; Miller and Keen 1960; Dieterich 1979; Mitchell and Martin 1980; Amman and Ryan 1991; Agee 1993; Ryan and Amman 1994, 1996; Rasmussen et al. 1996), few studies have included measures of insect infestation in tree mortality models (Peterson and Arbaugh 1986). Injuries to root systems and tree boles have been identified in lodgepole pine as entry ports for root and bole diseases following fire (Geiszler et al. 1980; Littke and Gara 1986). Little information is available on factors that promote tree mortality after fire in ponderosa pine forests of the south-western United States. This region includes the largest contiguous area of ponderosa pine forests in the world in Arizona and New Mexico (Burns and Honkala 1990), and is characterized by a strongly bimodal pattern of precipitation with winter snow, extremely dry weather in spring and early summer, and intense late-summer rains that differs from the climate in other regions that support ponderosa pine forests. Logistic regression and discriminate analysis have been used to model ponderosa pine mortality after fire in California, Colorado, Idaho, Montana, and Oregon (Wyant and Zimmerman 1983; Wyant et al. 1986; Saveland et al. 1990; Swezy and Agee 1991; Harrington 1993; Regelbrugge and Conard 1993; Stephens 1995; Finney 1999). Early studies of ponderosa pine mortality after fire in northern Arizona were based on small sample sizes and a limited number of tree size classes (Herman 1950, 1954; Dieterich 1979). Harrington and Hawksworth (1990) developed a logistic regression equation for modeling ponderosa pine mortality after fire in northern Arizona, but their equation applies only
C. W. McHugh and T. E. Kolb
to stands heavily infected with dwarf-mistletoe. Harrington’s (1993) study in south-western Colorado addressed effects of season of fire, tree size, and fire damage on ponderosa pine mortality for small trees [diameter at dbh between 4 and 34 cm] with little bole scorch. Little information exists on mortality of larger trees after fire in the south-western US. The objectives of our study were to: (1) Describe temporal trends in ponderosa pine mortality following three fires in northern Arizona; (2) Use logistic regression models to better understand factors associated with tree mortality; and (3) Examine the influence of tree size on mortality after fire. Methods Study sites The three fires for this study were selected based on their proximity to Flagstaff, Arizona, and season of fire occurrence. The Dauber prescribed fire was located in the Peaks Ranger District, Coconino National Forest, approximately 24 km west of Flagstaff (N3905541, E420436, UTM Zone 12, NAD27) (Fig. 1). The study site was 23.8 ha in size at an elevation range of 2225–2255 m. Aspect is generally southsoutheast with slopes of 0–8%. Soils within the study area are fine, montmorillonitic Typic Argiborolls and are gravely loams derived from residuum basalt/cinder parent material (Miller et al. 1995). Vegetation at this site is a ponderosa pine–bunch grass type with ponderosa pine as the only tree species (USDA Forest Service 1997). Ponderosa pine in the study area ranges from 7.4 cm to 44.5 cm dbh with scattered groups and isolated old-growth trees. The Side wildfire was also located in the Peaks Ranger District, Coconino National Forest (N3900725, E446931, UTM Zone 12, NAD27) (Fig. 1). The study site was in an 80 ha portion of the 130 ha Side wildfire at an elevation range of 2072–2195 m. Site aspect is predominately flat except where dissected by two east–west running intermittent stream courses. Soils are mixed Mollic Eutroboralfs, and are very stoney, sandy loams derived from alluvium, mixed igneous parent material (Miller et al. 1995). Vegetation at this site was a ponderosa pine–cliffrose type (USDA Forest Service 1997). Ponderosa pine dbh in the study area ranged between 10.2 and 91.4 cm. Unlike the Dauber prescribed fire, mature trees occurred as scattered individuals and large groups throughout the study area. The study area also included Gambel oak (Quercus gambelii) and alligator juniper (Juniperus deppeana), as well as mountain-mahogany (Cercocarpus montanus), cliffrose (Purshia stansburiana), and a variety of grasses and forbs. The Bridger-Knoll wildfire was located in the North Kaibab Ranger District, Kaibab National Forest, approximately 32 km south-southwest of Jacob Lake, Arizona (N4048518, E465706, UTM Zone 12, NAD27) (Fig. 1). This site was 6475 ha of the 21 449 ha Bridger-Knoll wildfire.
Ponderosa pine mortality following fire
9
Fig. 1.
Study site locations.
Elevation for the area ranged between 2134 and 2255 m. All aspects were represented and slope percent ranged between 0 and 20% in bottomland areas to over 40% on ridges. Soils are clayey-skeletal and fine montmorillonitic, Mollic Eutroboalfs, loams and gravely loams, derived from residuum limestone parent material (Brewer et al. 1991). Vegetation at the site was a ponderosa pine–Gambel oak type (USDA Forest Service 1997). The study area was primarily composed of ponderosa pine trees 22.9–106.2 cm dbh. Other tree species present were Gambel oak, one seed juniper (Juniperus monosperma), and Utah juniper (Juniperus osteosperma). Cliffrose, New Mexican locust (Robinia neomexicana), Gambel oak in shrub form, and a variety of grasses and forbs were also present in the study area. Mean annual precipitation for the Dauber prescribed fire and Side wildfire areas is 57.9 cm with a mean annual snowfall of 276.4 cm (NOAA 1997). For the months of January and July, the mean daily minimum and maximum temperatures are −9.2◦ C and 5.7◦ C and 10.1◦ C and 27.7◦ C, respectively (NOAA 1997). Mean annual precipitation for the Bridger-Knoll wildfire area is 52.5 cm with a mean annual snowfall of 267.7 cm. For the months of January and July, the mean daily minimum and maximum temperatures are −9.1◦ C and 4.4◦ C, and 10.3◦ C and 26.3◦ C, respectively (National Climatic Data Center, station 024418, http://www.wrcc.dri.edu). The post-fire years in our study included one extreme drought (1996), two mild droughts (1997, 1999), and one wet year (1998). Total yearly precipitation in 1996, the extreme drought, was 53% of normal. Years 1997 and 1999 were milder droughts, with similar precipitation (1997: 68% of normal; 1999: 69% of normal). Year 1998 was unusually wet; yearly precipitation was 120% of normal. These precipitation data are for Flagstaff, Arizona (National Oceanic
and Atmospheric Administration, Stations 023010/03103 and 023009/9999, http://lwf.ncdc.noaa.gov/servlets/ACS), which is located close to the Dauber and Side fires. Similar trends in precipitation occurred at the site of the BridgerKnoll wildfire. Fire behavior and intensity Because of the opportunistic nature of this study, direct observations of fire behavior characteristics, such as flame length, are not available. Instead, BEHAVE version 4.4 (Andrews 1986), a fire behavior prediction model, was used to predict the possible range of fire characteristics experienced across each site. We used BEHAVE to predict fire behavior in the flaming front based on the following inputs: Northern Forest Fire Laboratory (NFFL) fire behavior fuel models (Anderson 1982), percent fuel moisture content of the 1, 10, and 100 hour time lag fuels (Fosberg and Deeming 1971; Rothermel 1983), midflame windspeed (Rothermel 1983), and percent slope (Table 1). Required fuel moisture and wind data were obtained from fire records of each fire. Fireline intensity, because of its relation to flame length, is best used to express the effects of fire on items affected by convective heating, such as foliage (Van Wagner 1973; Finney and Martin 1993). Using Agee’s (1993) definitions of fire behavior based on fireline intensity (Table 1), the Dauber prescribed fire was primarily a surface fire, whereas the Side and Bridger-Knoll wildfires varied from surface fire to active crown fire. Estimated fire behavior from BEHAVE closely matched our qualitative assessments of observed burn conditions for all three fires. The Dauber site was prescribed burned on 9 September 1995 and contained both natural and activity fuels (fuels generated as a result of logging activities). Strip ignitions designed to create head fires were initially used to ignite the
10
C. W. McHugh and T. E. Kolb
Table 1.
Fuel model, fuel moisture, slope, and windspeed values used in the fire behavior model BEHAVE to predict the range of fire characteristics experienced across the study sites
Parameter
Fireline intensity (kW m−1 ) Heat/unit area (kJ m−2 ) Fuel modelA 1-hour fuel moisture content (%) 10-hour fuel moisture content (%) 100-hour fuel moisture content (%) 1000-hour fuel moisture content (%) Slope (%) WindspeedB (km h−1 ) A B
Dauber prescribed fire, Fall
Side wildfire, Spring
44–234 3809–8058 9,11 9 10 14 18 5 3.2–8.0
338–3726 5093–6260 2,9 3 4 5 8 5 8.0–12.9
Bridger-Knoll wildfire, Summer 118–4132 5544–6836 2,9 2 3 4 6 5–30 3.2–32.2
Following Anderson (1982). Midflame windspeed (Rothermel 1983).
area. Later into the ignition phase, lighting patterns were changed to create low-intensity backing fires. The 1, 10, 100, and 1000 hour time-lag moisture classes (Fosberg and Deeming 1971; Rothermel 1983) were within normal ranges for prescribed burning and winds were light (Table 1). Predicted peak fireline intensity at the Dauber site was lowest of all sites (Table 1). The Side wildfire was a human-caused wildfire that started at approximately 1430 hours, 4 May 1996; fire danger rating for the Coconino National Forest was extreme. At the time of ignition, year-to-date precipitation was 15 cm below normal in Flagstaff, Arizona (NOAA 1997). Fuel moisture percentages for 1, 10, 100, and 1000 hour time-lag fuels were extremely low (Table 1), and fire behavior was extreme. Rates of fire spread were 0.8 km per hour with spotting 0.4 km in front of the main fire. This extreme fire behavior was primarily driven by very low fuel moisture content and wind. The Bridger-Knoll wildfire was ignited by lightning within Grand Canyon National Park on 20 June 1996, and burned onto the North Kaibab Ranger District, Kaibab National Forest on 21 June 1996. Fire danger rating for the Kaibab National Forest at the time of ignition was extreme. As with the Side wildfire, fuel moisture percentages for 1, 10, 100, and 1000 hour time-lag fuels were extremely low (Table 1). Initial fire behavior for the Bridger-Knoll wildfire was extreme with rates of spread 0.4–0.6 km per hour and spotting 0.2 km in front of the main fire. Low fuel moisture content and wind were important drivers of fire behavior. Sampling Initial assessments of tree condition were completed in 1996, 5 months post-fire on the Side and Bridger-Knoll wildfires and 11 months post-fire on the Dauber prescribed fire. Trees with no foliage left (e.g. 100% consumption of foliage) were not included in the initial sampling because we assumed these trees were killed immediately by the fire front. Mortality was
assessed for every tree (n = 1367 total) in September 1997, 1998, and 1999. Trees were recorded as dead if no green foliage was visible on the tree after 1996. For the Dauber prescribed fire, 16 plots of 0.04 ha were used to collect data on 222 trees ranging in dbh from 7.4 cm to 44.5 cm. On the Bridger-Knoll wildfire, 75 plots of 0.08 ha and 46 plots of 0.4 ha were used to collect data on 833 trees between 22.9 cm and 106.2 cm dbh. These plots were established on systematic grids using a random start, and resulted in unbiased sampling of fire-damaged trees. At the BridgerKnoll wildfire, plots were established by Kaibab National Forest personnel for monitoring following post-fire salvage logging. At the Side wildfire, a total of 312 trees ranging in dbh between 10.2 cm and 91.4 cm were measured. Of these trees, 241 with dbh 10.2 cm and greater were measured on 18 archaeological sites in which trees were protected from salvage logging. In order to increase the sample size of trees 45 cm dbh and larger, seven transects 20 m in width, bounded by the fire perimeter and oriented across the primary direction of the fire, were established and used to sample an additional 71 trees. Independent variables Sixteen tree morphological variables and measures of fire damage were assessed on all trees at each fire (Table 2). All variables were chosen a priori based on factors that were important in previous studies of tree mortality following fire. We (i.e. the authors) measured all variables on the Dauber prescribed fire and Side wildfire in all years. For the BridgerKnoll wildfire, variables were measured by United States Forest Service personnel after our training. We checked year 1 measurements for accuracy on 80% of the trees on the Bridger-Knoll wildfire. Diameter at breast height was measured from the highest ground side at 1.37 m above the forest floor to the nearest 0.10 cm. Total tree height was measured to the nearest
Ponderosa pine mortality following fire
Table 2.
11
Mean, standard error (SE), and range of data collected for fire-damaged ponderosa pine for three fires in northern Arizona
Data definitions: Live crown ratio (% pre-fire live crown/total tree height); crown position (0, open grown; 1, dominate; 2, co-dominate; 3, intermediate; 4, suppressed); crown scorch (% pre-fire live crown scorched); crown consumption (% pre-fire live crown consumed); total crown damage (crown scorch plus crown consumption); bole char severity rating lee side (0, none; 1, light char; 2, medium char; 3, heavy char); bole char severity rating windward side (0, none; 1, light char; 2, medium char; 3, heavy char); ground char severity rating beneath crown dripline (0, none; 1, light; 2, medium; 3, high); insect rating (0, none; 1, partial attack; 2, mass attack); weather damage (0, none; 1, wind damage portion of tree; 2, tree blown down; 3, lightning strike post-fire); logging damage (0, none; 1, cat-face from skidding operations; 2, broken top from falling operations); soil disturbance (0, none; 1, operation of skidding equipment within dripline of crown; 2, skid trail located within dripline of crown; 3, spur road located within dripline of crown) Mode values are displayed in parentheses for crown position, bole char severity lee side, bole char severity windward side, groundchar severity, insect rating, weather damage, logging damage, and soil disturbance Data
dbh (cm) Height (m) Live crown ratio (%) Crown position Crown scorch (%) Crown consumption (%) Total crown damage (%) Bole char, lee side (m) Bole char, windward side (m) Bole char severity, lee side Bole char severity, windward side Groundchar severity Insect rating Weather damage Logging damage Soil disturbance
Dauber prescribed fire Fall (n = 222)
Side wildfire Spring (n = 312)
Bridger-Knoll wildfire Summer (n = 833)
Mean
SE
Range
Mean
SE
Range
Mean
SE
Range
24.2 11.6 41.7 1.7 (1.0) 46.0 0 46.0 3.1 0.76
0.439 0.172 0.765 0.062 2.233 0 2.233 0.140 0.057
7.4–44.5 3–16 20–80 1–4 0–100 0 0–100 0–8 0–4
40.1 13.2 63.1 1.1 (1.0) 55.3 10.3 65.6 6.6 3.4
1.196 0.306 1.052 0.055 1.781 1.165 1.861 0.224 0.191
10.2–91.4 4–27 20–90 0–4 0–100 0–90 0–100 0–20 0–17
51.7 24.5 47.7 1.8 (2.0) 27.2 4.3 31.5 7.5 3.7
0.569 0.216 0.624 0.030 1.068 0.552 1.220 0.219 0.201
22.9–106.2 7–43 0–90 0–4 0–100 0–90 0–100 0–36 0–36
1.7 (2.0)
0.048
0–3
2.4 (2.0)
0.035
0–3
1.9 (2.0)
0.015
0–3
1.1 (1.0)
0.059
0–3
1.8 (2.0)
0.046
0–3
1.6 (2.0)
0.024
0–3
2.3 (3.0) 0.14 (0.0) 0.11 (0.0) 0 (0.0) 0 (0.0)
0.053 0.029 0.029 0 0
0–3 0–2 0–2 0 0
2.5 (3.0) 0.58 (0.0) 0.04 (0.0) 0.03 (0.0) 0.05 (0.0)
0.039 0.044 0.018 0.015 0.015
0–3 0–2 0–3 0–2 0–3
1.9 (2.0) 0.21 (0.0) 0.02 (0.0) 0.01 (0.0) 0.18 (0.0)
0.018 0.016 0.008 0.004 0.017
0–3 0–2 0–3 0–2 0–3
meter with a clinometer. Pre-fire live crown ratio was ocularly reconstructed and estimated to the nearest 10% as the percentage of pre-fire total tree height occupied by live crown. Two types of crown damage were measured directly on each tree: percent of pre-fire live crown volume scorched and percent of pre-fire live crown volume consumed. A third measure of damage, total crown damage, was derived from the previous measures (total crown damage = scorch + consumption). Estimates of crown damage were made during the initial assessment only on cloud-free days and perpendicular to the direction of the sun. Because scorch and consumption of tree crowns following wildfire is often asymmetrical, measurements from all four quadrants were used to calculate an average for the tree. Crown scorch was ocularly estimated to the nearest 10% by observers following Peterson (1985), and was defined as the percentage of pre-fire live crown volume scorched, but not consumed by the fire (Ryan 1982; Harrington 1987). Foliage that exhibited a change in color as a result of the fire, but not consumed, was considered to be scorched. Crown
consumption was ocularly estimated to the nearest 10%, and was the proportion of pre-fire live crown volume consumed by active combustion. Evidence of residual buds on branch tips was used to identify branches that supported foliage prior to the fire. Bole char was used to estimate cambial damage from fire, and was measured two ways. First, char height above ground level was measured for each tree on the uphill, or leeward side, and on the downhill, or windward side, to the nearest meter using a tape or clinometer. Second, bole char severity was assessed using four classes (none, light char, medium char, heavy char) following criteria established by Ryan (1982). Definitions of these classes were: none: no evidence of flame contact with the bole and no charring of the bole; light: light scorch or char on edges of bark plates or where moss burned off the bole; medium: bark uniformly black with the possible exception of the inner depths of the prominent fissures, but bark character is still discernible; heavy: bark deeply charred, but not necessarily to the wood, and surface characteristics have been lost. Because cambial damage is usually greater near ground level than at breast height (Ryan 1990), bole
12
char severity was based on the depth of bole char in the first 45.7 cm above ground. Ground fire severity was measured under the dripline of the tree crown using four classes to indirectly measure damage to root systems (Swezy and Agee 1991). These classes followed Ryan (1982), and were defined as: none: no visible effect on soil; light: surface of litter and duff layers scorched or charred; medium: litter completely consumed and duff deeply charred or consumed, but the underlying mineral soil not visibly altered; high: litter and duff completely consumed. In addition, burned-out stump holes and the presence of consumed downed logs within the dripline were noted. Tree crown position may be important in determining survival following fire. Thus, crown position was assessed using four classes: dominant, co-dominant, intermediate or suppressed (Smith 1986). An additional classification for open-grown trees was added to account for trees that developed without any visible interaction or competition from other trees. Attacks of western pine beetle (Dendroctonus brevicomis), roundheaded pine beetle (Dendroctonus adjunctus), mountain pine beetle (Dendroctonus ponderosa), and Ips (Ips species) were recorded for each tree after tree death. Insect attacks were detected by inspecting for boring dust or pitch tubes. Insect species were determined by removing sections of the bark and examining gallery patterns within the first 2 m of the tree bole on dead trees (Beatty 1986). Presence or absence of wood borers (Buprestidae and Cerambycidae) was noted yearly on live and dead trees. For red turpentine beetle (Dendroctonus valens), the number of quadrants with pitch tubes on the bole was recorded yearly for both live and dead trees. For western pine beetle, mountain pine beetle, roundheaded pine beetle, and Ips species, attack level was also assessed yearly for each species. If the species was not present on the tree, a rating of none was assigned. If attacks occupied less than 75% of the tree bole circumference based on distribution of gallery patterns, a rating of partial attack was assigned. If attacks occupied greater than 75% of the tree bole circumference, a rating of mass attack was assigned. An overall rating of insect attack was determined for each tree by using three classes (none, partial, mass). Attacks by wood borers were not included in the overall rating because these insects generally attack only dead trees or dead sections of cambium, thus their contribution to mortality is likely small (Mitchell and Martin 1980; Rasmussen et al. 1996). An overall rating of mass attack was assigned if any individual insect species had this rating, or if two or more species had partial ratings. Also, a rating of partial attack was assigned if species of Dendroctonus or Ips was present with a partial attack rating. The presence or absence of other secondary factors that may contribute to tree mortality was also recorded. Secondary factors included: weather damage, lightning damage,
C. W. McHugh and T. E. Kolb
logging damage, and soil compaction from road building and skidding operations associated with post-fire logging operations. Lightning strikes were recorded only if the tree had been struck since the fire. Physical logging damage (‘catface’) was recorded if bark had been removed from greater than 50% of the tree circumference. Broken tops and limbs were also noted if they obviously resulted from felling operations. Soil disturbance was recorded if skidding equipment was operated within the dripline of the tree crown, a skid trail was created within the dripline of the crown, or if a temporary road was constructed within the dripline. Data analysis Mann–Whitney tests were conducted to test for differences between fire-damage and tree morphological characteristics of live and dead trees within each fire. Numbers of live and dead trees were compared by a two-dimensional contingency table using a χ 2 test to evaluate whether mortality differed among fires. Logistic regression models were developed for each fire and for data pooled over fires using SPSS version 8.0 (SPSS, Chicago, IL, USA). For each fire, independent variables were screened for their influence on tree mortality by comparing values for dead versus live trees using two sample t-tests. Only those independent variables that differed between live and dead trees (P ≤ 0.10) and were not strongly correlated (r ≤ 0.50) with other independent variables were used in development of logistic regression models. Independent variables in the resulting logistic regression equations were used if significantly different from zero (P ≤ 0.10). Model goodness of fit was assessed using graphical interpretation of each model’s residuals and the −2 Log Likelihood Ratio statistic (−2LL) (Hosmer and Lemeshow 1989; Norusis 1994). The model form used to model tree mortality was: Pm = 1/[1 + exp(−(β0 + β1 X1 + · · · + βn Xn ))],
(1)
where Pm is the probability of tree mortality, β0 , β1 , and βn are regression coefficients, and X1 and Xn are representative independent variables. Several regression models were developed for each fire, and for data pooled over all fires following the model form of equation (1). Receiver Operating Characteristic (ROC) curves were used to compare the accuracy of different logistic regression models for each fire (Saveland and Neuenschwander 1990; Finney and Martin 1993; Regelbrugge and Conard 1993; Stephens 1995; Finney 1999). The ROC curve is a plot of the probability of a true positive prediction, or hit rate (tree is classified as dead when it is dead) versus the probability of a false positive, or false alarm rate (tree is classified dead when it is alive) by varying the decision criterion from 0 to 1 for group membership (Saveland and Neuenschwander 1990; Bradley 1996). The area under an ROC curve is equal to the probability of correctly classifying a concordant pair of observations. The ROC curve
Ponderosa pine mortality following fire
13
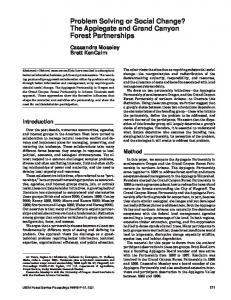
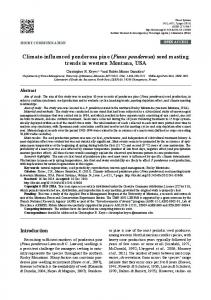
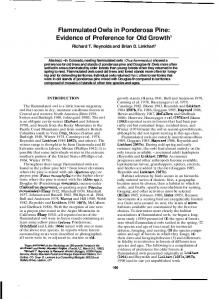
value can vary from 0.50, which is no better than chance, to 1.0, where all predictions are correct (Saveland and Neuenschwander 1990; Swets 1996). ROC values between 0.50 and 0.70 indicate low accuracy, values between 0.70 and 0.90 indicate moderate accuracy, and values greater than 0.90 indicate very high accuracy (Swets 1996). Models for each fire were ranked based on their −2 Log Likelihood ratio statistic values (−2LL), Receiver Operating Characteristic curve values (ROC), and number of independent variables. Results Tree characteristics by fire and mortality group Sample trees were smaller in dbh and total height on average in the Dauber prescribed fire compared with the Side and Bridger-Knoll wildfires (Table 2). There was considerable overlap in tree size between the Side and Bridger-Knoll wildfires, but the Side wildfire had trees with dbh < 22 cm whereas the Bridger-Knoll wildfire did not (Table 2). Live trees had larger dbh than dead trees in the Dauber prescribed fire and Side wildfire (Table 3). In contrast, dbh of live and dead trees did not differ at the Bridger-Knoll wildfire (Table 3). Plots of percent tree mortality 3-years post-fire versus dbh revealed a U-shaped distribution for all
Table 3.
fires (Fig. 2). Percent mortality was lowest for trees with dbh between 35 and 55 cm for the Side and Bridger-Knoll wildfires and between 25 and 35 cm on the Dauber prescribed fire. Mortality was highest for the smallest trees at all fires and for trees with dbh of 75 cm at the Side and Bridger-Knoll wildfires (Fig. 2). The U-shaped mortality distribution versus dbh also occurred for data pooled over all fires (Fig. 3). Average live crown ratio was highest on the Side wildfire, and nearly equal on the Dauber prescribed fire and BridgerKnoll wildfire (Table 2). Live crown ratio was higher for live compared with dead trees at the Side and Bridger-Knoll wildfires, with no difference at the Dauber prescribed fire (Table 3). Average crown position was nearly equal for trees in the Dauber prescribed fire and Bridger-Knoll wildfire at 1.7 and 1.8, respectively, indicating that the majority of trees at these sites were in the co-dominant crown class. The average crown position rating for the Side wildfire was lower at 1.1, indicating that more trees at this site were in dominant and open-grown classes. While open grown trees (rating of 0) occurred on the Side and Bridger-Knoll wildfires, none occurred at the Dauber prescribed fire (Table 2). Dead trees at the Dauber prescribed fire and Side wildfire had significantly lower crown position rating than live trees, suggesting that dead trees in these two fires were more suppressed (Table 3).
Mean characteristics of live (L) and dead (D) ponderosa pine for three fires in northern Arizona. The P -value shows results of Mann–Whitney tests between live and dead trees
Data definitions: Live crown ratio (% pre-fire live crown/total tree height); crown position (0, open grown; 1, dominate; 2, co-dominate; 3, intermediate; 4, suppressed); crown scorch (% pre-fire live crown scorched); crown consumption (% pre-fire live crown consumed); total crown damage (crown scorch plus crown consumption); bole char severity rating lee side (0, none; 1, light char; 2, medium char; 3, heavy char); bole char severity rating windward side (0, none; 1, light char; 2, medium char; 3, heavy char); ground char severity rating beneath crown dripline (0, none; 1, light; 2, medium; 3, high); insect rating (0, none; 1, partial attack; 2, mass attack) Mode values are displayed in parentheses for crown position, bole char severity lee side, bole char severity windward side, groundchar severity, and insect rating Data
Tree status Dauber prescribed fire Fall (n = 222)
dbh (cm) Height (m) Live crown ratio (%) Crown position Crown scorch (%) Crown consumption (%) Total crown damage (%) Bole char, lee side (m) Bole char, windward (m) Bole char severity, lee side Bole char severity, windward side Ground char severity Insect rating
Side wildfire Spring (n = 312)
Bridger-Knoll wildfire Summer (n = 833)
L
D
P -value
L
D
P -value
L
D
P -value
25.1 11.9 41.4 1.6 (1.0) 37.5 N/A 37.5 2.8 0.64 1.6 (2.0) 0.94 (1.0)
20.3 10.3 42.7 2.1 (1.0) 84.8 N/A 84.8 4.3 1.3 2.3 (2.0) 1.9 (2.0)
≤0.001 0.005 0.557 0.019 ≤0.001 N/A ≤0.001 ≤0.001 ≤0.001 ≤0.001 ≤0.001
41.8 13.6 66.3 1.0 (1.0) 48.9 3.5 52.4 5.9 2.4 2.3 (2.0) 1.6 (2.0)
36.4 12.2 56.4 1.3 (1.0) 68.8 24.4 93.2 8.0 5.5 2.7 (3.0) 2.2 (2.0)
0.007 0.012 ≤0.001 0.117 ≤0.001 ≤0.001 ≤0.001 ≤0.001 ≤0.001 ≤0.001 ≤0.001
51.7 24.8 48.2 1.8 (2.0) 21.3 0.79 22.1 6.0 2.1 1.9 (2.0) 1.5 (2.0)
51.6 22.4 44.6 1.7 (2.0) 63.5 26.2 89.8 16.6 13.1 2.1 (2.0) 2.0 (2.0)
0.920 ≤0.001 0.079 0.192 ≤0.001 ≤0.001 ≤0.001 ≤0.001 ≤0.001 ≤0.001 ≤0.001
2.2 (3.0) 0.08 (0.0)
2.9 (3.0) 0.45 (0.0)
≤0.001 ≤0.001
2.4 (3.0) 0.22 (0.0)
2.8 (3.0) 1.35 (2.0)
≤0.001 ≤0.001
1.8 (2.0) 0.15 (0.0)
2.2 (2.0) 0.63 (0.0)
≤0.001 ≤0.001
14
C. W. McHugh and T. E. Kolb
60
(a)
50
40
Mortality (%)
Mortality (%)
50
30 20 10 0 10
15
20
25 30 dbh (cm)
35
40
40 30 20 10
45
0 10 15 20 25 30 35 40 45 50 55 60 65 70 75 80 85 90 dbh (cm)
(b)
Fig. 3. Observed percent mortality of ponderosa pine 3 years after fire by 5 cm dbh class for data combined over three fires in northern Arizona. Data are not shown for dbh classes with