Fisher-transformed Pearson correlation (PRx) is used to assess cere- ... mean intracranial pressure with no change in mean blood pres- sure, with intact ... Second, a positive PRx occurs even with .... Such empiric associations can lead to new hypotheses ... mean CPP values is divided into 5 mm Hg width “bins,” and.
Meaning of Intracranial Pressure-to-Blood Pressure Fisher-Transformed Pearson Correlation– Derived Optimal Cerebral Perfusion Pressure: Testing Empiric Utility in a Mechanistic Model Alireza Akhondi-Asl, PhD1; Frederick W. Vonberg, MBBS1; Cheuk C. Au, MBBS1; Robert C. Tasker, MD, FRCP1,2 Objectives: Time-averaged intracranial pressure-to-blood pressure Fisher-transformed Pearson correlation (PRx) is used to assess cerebral autoregulation and derive optimal cerebral perfusion pressure. Empirically, impaired cerebral autoregulation is considered present when PRx is positive; greater difference between time series median cerebral perfusion pressure and optimal cerebral perfusion pressure (ΔCPP) is associated with worse outcomes. Our aims are to better understand: 1) the potential strategies for targeting optimal cerebral perfusion pressure; 2) the relationship between cerebral autoregulation and PRx; and 3) the determinants of greater ΔCPP. Design: Mechanistic simulation using a lumped compartmental model of blood pressure, intracranial pressure, cerebral autoregulation, cerebral blood volume, Paco2, and cerebral blood flow. Setting: University critical care integrative modeling and precision physiology research group.
Department of Anesthesiology, Critical Care and Pain Medicine, Boston Children’s Hospital and Harvard Medical School, Boston, MA. 2 Department of Neurology, Boston Children’s Hospital and Harvard Medical School, Boston, MA. Supplemental digital content is available for this article. Direct URL citations appear in the printed text and are provided in the HTML and PDF versions of this article on the journal’s website (http://journals.lww.com/ccmjournal). Supported, in part, by a Trailblazer award from the Department of Anesthesiology, Critical Care and Pain Medicine, at Boston Children’s Hospital, Boston, MA. Dr. Akhondi-Asl received other support from a Trailblazer Award. Dr. Tasker received funding from a “Trailblazer Award” from the Department of Anesthesiology, Perioperative and Pain Medicine, at Boston Children’s Hospital, Boston, MA. The remaining authors have disclosed that they do not have any potential conflicts of interest. For information regarding this article, E-mail: Robert.tasker@childrens. harvard.edu Copyright © 2018 The Author(s). Published by Wolters Kluwer Health, Inc. on behalf of the Society of Critical Care Medicine and Wolters Kluwer Health, Inc. This is an open-access article distributed under the terms of the Creative Commons Attribution-Non Commercial-No Derivatives License 4.0 (CCBY-NC-ND), where it is permissible to download and share the work provided it is properly cited. The work cannot be changed in any way or used commercially without permission from the journal. 1
DOI: 10.1097/CCM.0000000000003434
e1160
www.ccmjournal.org
Subjects: None, in silico studies. Interventions: Simulations in blood pressure, intracranial pressure, Paco2, and impairment of cerebral autoregulation, with examination of “output” cerebral perfusion pressure versus PRxplots, optimal cerebral perfusion pressure, and ΔCPP. Measurements and Main Results: In regard to targeting optimal cerebral perfusion pressure, a shift in mean blood pressure or mean intracranial pressure with no change in mean blood pressure, with intact cerebral autoregulation, impacts optimal cerebral perfusion pressure. Second, a positive PRx occurs even with intact cerebral autoregulation. In relation to ΔCPP, for a given input blood pressure profile, with constant intracranial pressure, altering the degree of impairment in cerebral autoregulation or the level of Paco2 maintains differences to within ±5 mm Hg. Change in intracranial pressure due to either an intermittently prolonged pattern of raised intracranial pressure or terminal escalation shows ΔCPP greater than 10 mm Hg and less than –10 mm Hg, respectively. Conclusions: These mechanistic simulations provide insight into the empiric basis of optimal cerebral perfusion pressure and the significance of PRx and ΔCPP. PRx and optimal cerebral perfusion pressure deviations do not directly reflect changes in cerebral autoregulation but are, in general, related to the presence of complex states involving well-described clinical progressions with raised intracranial pressure. (Crit Care Med 2018; 46:e1160–e1166) Key Words: blood pressure; cerebral autoregulation; cerebral blood flow; cerebral hemodynamics; intracranial pressure; mathematical modeling
A
key concern in the management of patients with severe traumatic brain injury (TBI) is whether cerebral autoregulation (CA) is intact and able to minimize alterations in cerebral blood flow (CBF) due to changes in cerebral perfusion (1–3). Because there are a number of processes underlying CA and CBF control, we have two main clinical challenges to consider: variance in the upper and lower limits of CA, and not knowing patient-specific optimal levels in December 2018 • Volume 46 • Number 12
Online Clinical Investigations
intrinsic physiologic factors such as Paco2, blood pressure (BP), and intracranial pressure (ICP) (4–6). These are two general approaches studying indirectly whole brain circulation pathophysiology (6). First, an empirical approach using observational and epidemiologic evidence to establish statistical relationships and correlations between inputs and outputs. This approach is best exemplified by studies in severe TBI using ICP to BP Fisher-transformed Pearson correlation (“PRx”) (i.e., 5–7 min of time-averaged ICP and BP data to calculate mean Fisher-transformed Pearson correlation) to derive, by statistical analyses, the cerebral perfusion pressure (CPP, the difference between mean BP and mean ICP) optimal for an individual (i.e., optimal CPP [CPPOpt]). Briefly, by inference, because positive PRx is considered representative of disturbed CA and negative PRx is reflective of intact CA (7), the CPPOpt is defined as the CPP at which PRx is at its minimum (7–10). In severe TBI, the difference between contemporaneous time series median CPP (CPPMed) and CPPOpt (i.e., difference between time series CPPMed and CPPOpt [ΔCPP]) 0–5 mm Hg is associated with favorable outcome, whereas ΔCPP –10 to –15 mm Hg occurs only in those with unfavorable outcome (8). Such empiric associations can lead to new hypotheses and, possibly, pragmatic trials. However, these observations cannot provide better understanding of pathophysiology or even the determinants of CPPOpt. Second, we have a mechanistic approach to indirect assessment of global cerebrovascular behavior using electrical analog models of CA control pathways, feedback loops, and arterial network structure (2, 3, 7, 11–20). Here, in silico evidence is rationalized according to the fluid dynamics or electronics of inputs and outputs. In 1988, Ursino (11, 12) proposed the first “lumped compartmental model” of cerebral circulation physiology that included CA. Since then, the modeling mechanistic approach has been used to better understand patient data from, for example, transcranial Doppler studies of middle cerebral artery flow velocity (6, 21, 22). To date, such models have not been used to provide mechanistic insight into the questions of “What does PRxderived CPPOpt mean?” and “What is the effect of manipulating BP, ICP and Paco2?” In this report, we use the lumped compartmental model of brain circulation physiology and CA, with its system operating CPP, to assess PRx and calculated CPPOpt. Our aims are to simulate the physiology in severe TBI and better understand: 1) the potential strategies for targeting CPPOpt; 2) the relationship between CA and PRx; and 3) the determinants of ΔCPP.
MATERIALS AND METHODS This experimental in silico study did not require Local Ethics Committee approval. Lumped Compartmental Model of CA We have implemented the model by Ursino et al (2), Ursino and Giannessi (3), Ursino (11, 12), and Ursino and Lodi (13, 14) to first test potential strategies for targeting CPPOpt. Figure 1 shows the electrical analog of our model with its four compartments that account for interactions among BP, ICP, CA, cerebral Critical Care Medicine
blood volume, Paco2, and CBF. Supplemental Digital Content 1 (http://links.lww.com/CCM/D992) provides more information about the model and the transient 6-hour change in BP profile (with 50 Hz sampling rate) used in the simulations (11, 14, 23). At baseline, the model operates with BP, CPP, CBF, and ICP at 100 mm Hg, 90.5 mm Hg, 12.5 mL/s (750 mL/min), and 10 mm Hg, respectively. PRx and Estimation of CPPOpt We have simulated changes in BP, Paco2, CA state, and ICP (by fluid injection into the cerebrospinal fluid [CSF] space). CPP is calculated from BP and ICP signals. CPPMed is the CPPMed for the whole simulation. To compute PRx, we average BP and ICP over 10 seconds, and then use 40 consecutive time-averaged samples. Individual correlations are collated throughout the simulation. Mean CPP during each time series correlation calculation is then associated with the individual PRx. Then, the range in these mean CPP values is divided into 5 mm Hg width “bins,” and the mean PRx corresponding to each bin is plotted—hereafter called the “PRx-plot.” We use these data in another exploratory plot to calculate the minimum of the curve that defines CPPOpt (4, 7, 8, 24). The ΔCPP is also evaluated as a difference category (ΔCategory) according to previously used ranges (9).
RESULTS Figure 1 shows the steady-state characteristics of the electrical analog model under conditions of Paco2 variation and CA gain. There is the expected dependence of CBF on CPP: for any given value in CPP, an increase in Paco2 causes the expected increase in CBF, whereas a decrease in Paco2 leads to the expected decrease in CBF (Fig. 1B). Figure 1C shows that when CA is impaired, there is more significant alteration in CBF with variation in CPP. Potential Influencers of CPPOpt Change in BP. We tested different BP profiles using fully intact CA and constant ICP and Paco2, 10 and 40 mm Hg, respectively. An example of the full graphical process for each “input” BP to “output” PRx-plot is shown in Figure S1 (Supplemental Digital Content 2, http://links.lww.com/CCM/E35). Figure S2 (Supplemental Digital Content 2, http://links.lww. com/CCM/E35) shows that degree and pattern of change in BP impact the PRx-plot and derivation of CPPOpt. Figure 2 shows the effect of shifting by a fixed amount one of the BP profiles from Figure S2E (Supplemental Digital Content 2, http://links.lww.com/CCM/E35—see bold black line originating at 80 mm Hg), thereby maintaining the same BP profile but with different median BP (BPMed) during the whole simulation (Table S1, Supplemental Digital Content 3, http://links.lww. com/CCM/E36). A shift in BPMed (Fig. 2A) has an impact on the position of the minimum in the PRx-plots (Fig. 2B) and CPPOpt (Table S1, Supplemental Digital Content 3, http://links.lww.com/ CCM/E36). A downward shift in BP profile by 10 mm Hg, from the line originating at 80 mm Hg (Fig. 2A, black line) to the line originating at 70 mm Hg, leads to a similar 10 mm Hg downward www.ccmjournal.org
e1161
Akhondi-Asl et al
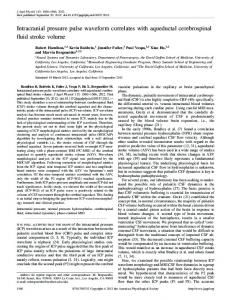
Figure 1. The electrical circuit equivalent of the lumped compartment model and some baseline physiologic operating characteristics. A, The model includes different segments: proximal and distal cerebral arteries, cerebral and intracranial veins, extracranial venous, and cerebrospinal fluid (CSF) formation and outflow. B, The dependence of cerebral blood flow (CBF) on cerebral perfusion pressure (CPP) under steady-state conditions at various Paco2 values (36, 38, 40, 42, and 44 mm Hg). Increasing Paco2 increases CBF at any given CPP. C, The dependence of CBF on CPP when cerebral autoregulation (CA) gain varies. CPP variation leads to more alteration in CBF as CA impairment increases (0%, 25%, 50%, 75%, and 100%). BP = blood pressure, ICP = intracranial pressure.
Figure 2. Impact of shifting the 6-hr mean blood pressure (BP) profile on intracranial pressure-to-BP Fishertransformed Pearson correlation (PRx) when cerebral autoregulation is intact. Paired graphs with input BP profiles (A) and output cerebral perfusion pressure (CPP) PRx-plots before final curve fitting (for details and text, see Fig. S2, Supplemental Digital Content 2, http://links.lww.com/CCM/E35). A, BP profile shifted either up or down by fixed amount, giving six inputs differing in mean BP. B, Output PRx-plots for profiles in A, showing that difference in mean BP, but fixed pattern, results in shift in the minima in the plots (for results of final mathematical transformation to calculate optimal CPP [see text], see Table S1, Supplemental Digital Content 3, http://links.lww.com/CCM/E36).
e1162
www.ccmjournal.org
shift in CPPMed (from 71 to 61 mm Hg) and similar downward shift in CPPOpt (from 68 to 56 mm Hg) (Table S1, Supplemental Digital Content 3, http://links.lww.com/CCM/ E36). On inspecting these data with the same BP profile, BPMed or CPPMed (if ICP is at a constant level) determines the position of CPPOpt. Change in Paco2. The impact of change in Paco2 on CPPOpt is minimal (Fig. S3, Supplemental Digital Content 2, http://links.lww.com/ CCM/E35; and Table S1,
December 2018 • Volume 46 • Number 12
Online Clinical Investigations
Figures 4 and 5 use the same BP profile to Figure S2C (see also Fig. S4, Supplemental Digital Content 2, http://links. lww.com/CCM/E35). (Table S1 [Supplemental Digital Content 3, http://links.lww.com/CCM/ E36] shows for comparison the findings when using the ICP profiles in Fig. 3A with the BP profile from Fig. S2C Figure 3. Impact of fixed change in mean intracranial pressure (ICP) profile over 6 hr when cerebral [Supplemental Digital Content autoregulation is intact and Paco2 is 40 mm Hg. Paired graphs with input ICP profiles (A) and output cerebral 2, http://links.lww.com/CCM/ perfusion pressure (CPP) ICP-to-blood pressure (BP) Fisher-transformed Pearson’s correlation (PRx) plots before final curve fitting (the BP profile is the same in all simulations). A, The effect of injection of fluid into the E35].) Figure 4 shows the effect cerebrospinal fluid space at six different rates (0.0–0.05 mL/s) to raise mean ICP to six constant levels (10, 15, of a series of peaks in ICP. (Of 20, 25, 30, and 35 mm Hg). B, Output PRx-plots for profiles in (A) showing shift similar to that seen with fixed note, Fig. S5E [Supplemental alteration in BP (Fig. 2B for comparison; for results of final mathematical transformation to calculate optimal CPP, see Table S1, Supplemental Digital Content 3, http://links.lww.com/CCM/E36). Digital Content 2, http://links. lww.com/CCM/E35] shows Supplemental Digital Content 3, http://links.lww.com/CCM/ that during such wave-like changes, PRx goes from a negative E36). Alterations in Paco2 (32–48 mm Hg) lead to small changes value to a positive value, and back to a negative value in the in ICP and little impact on the position of the minimum in the course of each wave in ICP.) An upward shift in peak ICP by PRx-plots. The increase in CPPOpt with increase in Paco2 from 32 10 mm Hg (20–30 mm Hg) results in minimal downward shift to 48 mm Hg was 5 mm Hg (87–92 mm Hg). in CPPMed by approximately 2 mm Hg (from 86 to 84 mm Hg), Change in ICP. The effects of changes in ICP profile— but CPPOpt shows an upward shift by approximately 10 mm Hg when CA is intact and 40 mm Hg Paco2—on the PRx-plot show (from 63 to 73 mm Hg). increasing shift with constantly increased ICP. When using the Figure 5 shows the effect of an escalation in ICP profile, with BP profile from Figure 2A (see red line originating at 100 mm the same BP profile used in Figure 4. In this instance, an upward Hg) with six constant levels in ICP, the output PRx-plots are shift in the final peak in ICP by 10 mm Hg (20–30 mm Hg at shown (Fig. 3). For comparison, Figure S4 (Supplemental peak) results in downward shift in CPPMed by 10 mm Hg (from Digital Content 2, http://links.lww.com/CCM/E35), using the 78 to 68 mm Hg), but CPPOpt exhibits a smaller downward shift BP profile in Fig. S2C (Supplemental Digital Content 2, http:// (≈4 mm Hg, from 85 to 81 mm Hg) (Table S1, Supplemental links.lww.com/CCM/E35), illustrates the output PRx-plots Digital Content 3, http://links.lww.com/CCM/E36). with the same constant shift in ICP). Figure 3 and Table S1 (Supplemental Digital Content 3, http://links.lww.com/CCM/ CA and PRx E36) show that a constant shift of 10 mm Hg (from 20 to 30 mm At baseline state (40 mm Hg Paco2 and 10 mm Hg ICP with conHg) results in a downward shift in CPPMed by 9 mm Hg (from sistent BP profile), change in CA gain—an indicator of impair81 to 70 mm Hg). CPPOpt also decreases by 9 mm Hg (from 79 ment of feedback systems—has minimal consequence on the to 70 mm Hg). Therefore, similar to the findings in Figure 2, A position of the minimum in the PRx-plots (Table S1, Suppleand B, the position of CPPOpt is determined by constant rise in mental Digital Content 3, http://links.lww.com/CCM/E36). ICP level or constant change in CPP with a constant BP profile. The increase in CPPOpt with increasingly impaired CA from 0% to 50% was small (≈2 mm Hg, from 89 to 91 mm Hg). However, mean PRx at CPPOpt changes –0.14 to 0.25, to 0.80 with increase in CA impairment from 0% to 25%, to 50%, respectively. On inspection of Table S1 (Supplemental Digital Content 3, http://links.lww.com/CCM/ E36), it is also evident that in simulations with fully intact Figure 4. Impact of serial peaks in intracranial pressure (ICP) over 6 hr, when cerebral autoregulation is intact and CA, it is still possible to obtain Paco2 is 40 mm Hg. Paired graphs with input ICP profiles (A) and output cerebral perfusion pressure (CPP) ICPa positive mean PRx at soto-blood pressure (BP) Fisher-transformed Pearson correlation (PRx) plots before final curve fitting (the BP profile is the same in all simulations). A, Four serial peaks in ICP with five different peak levels (color-coding similar to called CPPOpt; that is, a positive Fig. 3, see text for details). B, Output PRx-plots for profiles in A, (for results of final mathematical transformation to coefficient is not necessarily calculate optimal CPP, see Table S1, Supplemental Digital Content 3, http://links.lww.com/CCM/E36).
Critical Care Medicine
www.ccmjournal.org
e1163
Akhondi-Asl et al
of BP and ICP in severe TBI? In this report, we describe three insights. First, in regard to targeting CPPOpt, a shift in BPMean or mean ICP, with intact CA, impacts CPPOpt. Second, a positive PRx at CPPOpt, which should signify impaired CA, in the lumped model also occurs with intact CA. Last, in relation to ΔCPP, the compartmenFigure 5. Impact of escalation in intracranial pressure (ICP) profile over 6 hr to a terminal plateau when tal model confirms that greater cerebral autoregulation is intact and Paco2 is 40 mm Hg. Paired graphs with input ICP profiles (A) and output cerebral perfusion pressure (CPP) ICP-to-blood pressure (BP) Fisher-transformed Pearson correlation (PRx) deviation from zero is associplots before final curve fitting (the BP profile is the same in all simulations). A, Five patterns of escalation in ICP ated with more severe 6-hour (color-coding similar to Fig. 3, see text for details). B, Output PRx-plots for profiles in A, showing shift in curves profiles in ICP. (for results of final mathematical transformation to calculate optimal CPP, see Table S1, Supplemental Digital Content 3, http://links.lww.com/CCM/E36). We should first note potential limitations in our simuan indicator of impaired CA. (Fig. S6 [Supplemental Digital lations. Our model simplifies a complex system. We could Content 2, http://links.lww.com/CCM/E35] summarizes add more feedback systems, but have settled on the balance the findings of a full analysis with 756 separate simulations, between complexity and the ability to model a system, which which comes to the same conclusion as Table S1, Supplemental is an approach now commonly used in so-called “personalDigital Content 3, http://links.lww.com/CCM/E36.) ized, model-based critical care medicine” (28). Other limitations of the model are that CBF is derived without accounting The Determinants of ΔCPP for changes in cerebral metabolism, the effects of medicaA fixed change in BP (Fig. 2A) or a constant rise in ICP (Fig. tions or CSF diversion on cerebrovascular dynamics, and 3A), using the same BP profile, resulted in ΔCPP values in the the consequence of surgical interventions (e.g., craniotomy, ΔCategory 0–5 mm Hg (Table S1, Supplemental Digital Content hematoma evacuation). Neither does the model account for 3, http://links.lww.com/CCM/E36). We could only simulate a brain heterogeneity in CA and microvascular nonnutritive state with ΔCategory 5–10 mm Hg when selecting a lower BP pro- phenomena such as shunt flow (29). That said, there are four file (with constant ICP 10 mm Hg), and CPPMed approximately advantages of our in silico testing: 1) “ground truth” CA is 61 mm Hg. We could simulate ΔCPP –19.9 mm Hg if we used a known and model parameters can be set to desired values; different BP profile (Fig. S2C, Supplemental Digital Content 2, 2) changes in BP and ICP can be controlled and examined; http://links.lww.com/CCM/E35) and constantly raised ICP of 3) confounding factors can be controlled or eliminated; and 25 mm Hg. 4) measurement errors can be removed as noise level can be In the simulations with serial peaks in ICP (20–35 mm Hg; controlled. Fig. 4), the ΔCategory was consistently greater than 10 mm Hg (Table S1, Supplemental Digital Content 3, http://links.lww. Potential Strategies for Targeting CPP Opt com/CCM/E36). Last, an escalating rise in ICP (Fig. 5) with Our first finding about strategies in targeting CPP when CA Opt peak 15–25 mm Hg resulted in ΔCategory –10 to –5 mm Hg. An is intact found that shift in either BP or ICP has an impact on escalating ICP peak 30–35 mm Hg resulted in ΔCategory less than CPP . CPP is also sensitive to the low-frequency characterOpt Opt –10 mm Hg (Table S1, Supplemental Digital Content 3, http:// istics of the BP and ICP profiles. Because CPP is a derived varilinks.lww.com/CCM/E36). able and mathematically coupled to both BP and ICP, we show
DISCUSSION
PRx-derived CPPOpt, with calculation of ΔCPP and ΔCategory, are statistical constructs and have proven value in patient risk stratification and in epidemiologic association with poor outcome (4, 7–9, 23–26). However, CPP is not physiologically controlled in homeostasis; there is no sensor, error signal, set point, or optimum within the operating range between the upper and lower limits of CA. Hence, CPPOpt-guided management may be a testable pragmatic therapeutic approach, but, intrinsically, empiricism has limitations to understanding mechanistic functions (27). How could a mechanistic model of cerebrovascular pathophysiology improve on an empirical approach that is already able to predict outcome during real-time monitoring e1164
www.ccmjournal.org
in a separate mathematical analysis that CPPOpt can change just by changing the input BP or ICP profiles, which confirms the findings in our simulations (Supplemental Digital Content 4, http://links.lww.com/CCM/E37). The equations also show that even when PRx does not change substantially, there can be significant change in CPPOpt. These features may explain why PRxderived CPPOpt has applications in pediatric severe TBI even though children have lower BP (10, 30). Returning to adult severe TBI, a recent analysis of CPPOpt in 104 patients managed in two European centers found heterogeneity in CPPOpt between the centers, which was attributed to different management protocols, especially different CPP targets, and different demographic factors like age-related BPMean (31). Our report provides in silico and mathematical underpinnings for these December 2018 • Volume 46 • Number 12
Online Clinical Investigations
expected observations and an explanation as to how these factors should be considered in practice. CA and PRx In theory, a positive PRx should be associated with impaired CA, whereas negative values should reflect intact CA. In our simulations, we found that even when CA is fully intact, it is possible to obtain a positive mean PRx at the value of CPPOpt, which is at odds with the pressure reactivity concept. In the mathematical analysis (Supplemental Digital Content 4, http:// links.lww.com/CCM/E37), the equations confirm that impairment of CA will have an impact on PRx, but no major difference in ΔCPP, which in our simulations remained within ±5 mm Hg (see below). That said, under controlled conditions, in which impairment in CA is known to be present, more positive PRx does reflect more severe impairment. However, when using only ICP, BP, and CPP data, we cannot always know whether CA is impaired or not. Hence, taken in isolation, monitoring PRx is not providing added information about CA. ΔCategory and Outcome Several clinical studies have used the PRx-based estimate of CPPOpt (4, 7–10, 24–26) with some adult patient cohorts demonstrating an association between outcome after severe TBI and ΔCategory (9, 25). In a case series of 299 adults with severe TBI, Aries et al (8) found the following: when their summary of ΔCategory for the whole period of ICP monitoring (using a moving window of 4 hr over and average of 4 d of data) was less than –10 mm Hg, all patients died; when their summary ΔCategory was greater than 10 mm Hg, approximately 30% survived with favorable outcome, approximately 60% survived with severe disability, and the remainder died. Our simulations add to the face validity of these associations and also provide further insight. They show that during constant decrease in BP or nonextreme constant increase in ICP, shift in CPPOpt is similar to shift in CPPMed, and so the ΔCPP remains within ±5 mm Hg. The mathematical handling (Supplemental Digital Content 4, http://links.lww.com/CCM/E37) also indicates that even when CA impairment has an impact on PRx, there may not be a major change in ΔCPP, which in our simulations also remained within ±5 mm Hg. In order to generate a ΔCategory more typical of those associated with poor outcomes in the clinical literature (8, 25), our simulations needed to incorporate a major abnormality in ICP 6-hour profile. A constant ICP at 25 mm Hg or escalation in ICP without remission to greater than 30 mm Hg gave ΔCategory less than –10 mm Hg. A series of peaks in ICP up to 20–35 mm Hg resulted in ΔCategory greater than 10 mm Hg.
CONCLUSIONS Taken together, our simulations provide mechanistic insight into the interpretation of PRx, CPPOpt, and ΔCategory. These empirically derived variables do provide a numerical summary of complex states involving well-described clinical progression and deterioration with raised ICP (32). This feature has epidemiologic importance, and we also wonder whether Critical Care Medicine
these composite indices may serve to provide a threshold for shift in treatment paradigm when managing cases with severe TBI—such as moving from medical to surgical interventions. Last, as illustrated by this report, the value of empirical and model-based mechanistic approaches in critical care medicine should be considered as complementary and potentially synergistic (27).
REFERENCES
1. Lassen NA: Cerebral blood flow and oxygen consumption in man. Physiol Rev 1959; 39:183–238 2. Ursino M, Di Giammarco P, Belardinelli E: A mathematical model of cerebral blood flow chemical regulation–Part I: Diffusion processes. IEEE Trans Biomed Eng 1989; 36:183–191 3. Ursino M, Giannessi M: A model of cerebrovascular reactivity including the circle of Willis and cortical anastomoses. Ann Biomed Eng 2010; 38:955–974 4. Czosnyka M, Smielewski P, Kirkpatrick P, et al: Continuous assessment of the cerebral vasomotor reactivity in head injury. Neurosurgery 1997; 41:11–17 5. Panerai RB, Chacon M, Pereira R, et al: Neural network modelling of dynamic cerebral autoregulation: Assessment and comparison with established methods. Med Eng Phys 2004; 26:43–52 6. Payne S: Cerebral Autoregulation: Control of Blood Flow in the Brain. Berlin, Germany, Springer, 2016 7. Steiner LA, Czosnyka M, Piechnik SK, et al: Continuous monitoring of cerebrovascular pressure reactivity allows determination of optimal cerebral perfusion pressure in patients with traumatic brain injury. Crit Care Med 2002; 30:733–738 8. Aries MJ, Czosnyka M, Budohoski KP, et al: Continuous determination of optimal cerebral perfusion pressure in traumatic brain injury. Crit Care Med 2012; 40:2456–2463 9. Lazaridis C, Smielewski P, Steiner LA, et al: Optimal cerebral perfusion pressure: Are we ready for it? Neurol Res 2013; 35: 138–148 10. Lewis PM, Czosnyka M, Carter BG, et al: Cerebrovascular pressure reactivity in children with traumatic brain injury. Pediatr Crit Care Med 2015; 16:739–749 11. Ursino M: A mathematical study of human intracranial hydrodynamics. Part 1–The cerebrospinal fluid pulse pressure. Ann Biomed Eng 1988; 16:379–401 12. Ursino M: A mathematical study of human intracranial hydrodynamics part 2—Simulation of clinical tests. Ann Biomed Eng 1988; 16: 403–416 13. Ursino M, Lodi CA: A simple mathematical model of the interaction between intracranial pressure and cerebral hemodynamics. J Appl Physiol (1985) 1997; 82:1256–1269 14. Ursino M, Lodi CA: Interaction among autoregulation, CO2 reactivity, and intracranial pressure: A mathematical model. Am J Physiol 1998; 274:H1715–H1728 15. Piechnik S, Czosnyka M, Smielewski P, et al: Indices for decreased cerebral blood flow control–A modelling study. Acta Neurochir Suppl 1998; 71:269–271 16. Banaji M, Tachtsidis I, Delpy D, et al: A physiological model of cerebral blood flow control. Math Biosci 2005; 194:125–173 17. Payne S: A model of the interaction between autoregulation and neural activation in the brain. Math Biosci 2006; 204:260–281 18. Spronck B, Martens EG, Gommer ED, et al: A lumped parameter model of cerebral blood flow control combining cerebral autoregulation and neurovascular coupling. Am J Physiol Heart Circ Physiol 2012; 303:H1143–H1153 19. Hu X, Nenov V, Bergsneider M, et al: Estimation of hidden state variables of the intracranial system using constrained nonlinear Kalman filters. IEEE Trans Biomed Eng 2007; 54:597–610 20. Silvani A, Magosso E, Bastianini S, et al: Mathematical modeling of cardiovascular coupling: Central autonomic commands and baroreflex control. Auton Neurosci 2011; 162:66–71 www.ccmjournal.org
e1165
Akhondi-Asl et al 21. Ursino M, Giulioni M: Quantitative assessment of cerebral autoregulation from transcranial Doppler pulsatility: A computer simulation study. Med Eng Phys 2003; 25:655–666 22. Aoi MC, Kelley C, Novak V, et al: Optimization of a mathematical model of cerebral autoregulation using patient data. IFAC Proc Vol 2009; 42:181–186 23. Alastruey J, Parker K, Peiró J, et al: Lumped parameter outflow models for 1-D blood flow simulations: Effect on pulse waves and parameter estimation. Commun Comput Phys 2008; 4:317–336 24. Bijlenga P, Czosnyka M, Budohoski KP, et al: “Optimal cerebral perfusion pressure” in poor grade patients after subarachnoid hemorrhage. Neurocrit Care 2010; 13:17–23 25. Zweifel C, Lavinio A, Steiner LA, et al: Continuous monitoring of cerebrovascular pressure reactivity in patients with head injury. Neurosurg Focus 2008; 25:E2 26. Petkus V, Krakauskaitė S, Preikšaitis A, et al: Association between the outcome of traumatic brain injury patients and cerebrovascular autoregulation, cerebral perfusion pressure, age, and injury grades. Medicina (Kaunas) 2016; 52:46–53
e1166
www.ccmjournal.org
27. Baker RE, Pena J-M, Jayamohan J, et al: Mechanistic models versus machine learning, a fight worth fighting for the biological community? Biol Lett 2018; 14:20170660 28. Chase JG, Preiser JC, Dickson JL, et al: Next-generation, personalised, model-based critical care medicine: A state-of-the art review of in silico virtual patient models, methods, and cohorts, and how to validation them. Biomed Eng Online 2018; 17:24 29. Dai X, Bragina O, Zhang T, et al: High intracranial pressure induced injury in the healthy rat brain. Crit Care Med 2016; 44: e633–e638 30. Young AM, Donnelly J, Czosnyka M, et al: Continuous multimodality monitoring in children after traumatic brain injury-preliminary experience. PLoS One 2016; 11:e0148817 31. Howells T, Smielewski P, Donnelly J, et al: Optimal cerebral perfusion pressure in centers with different treatment protocols. Crit Care Med 2018; 46:e235–e241 32. Lundberg N: Continuous recording and control of ventricular fluid pressure in neurosurgical practice. Acta Psychiatr Scand Suppl 1960; 36:1–193
December 2018 • Volume 46 • Number 12