18 min point; e and e', the approx. 24 min point; f and f', the approx. 32 min point; g and g', the approx. 135 min point after the 0 min point, respectively. Horiba ...
Plant Physiol. (1984) 76, 266-269 0032-0889/84/76/0266/04/$0 1.00/0
Dynamic Analysis of Water Stress of Sunflower Leaves by Means of a Thermal Image Processing System' Received for publication November 15, 1983 and in revised form May 15, 1984
YASUSHI HASHIMOTO*2, TAKETOSHI INO, PAUL J. KRAMER, AUBREY W. NAYLOR, AND BOYD R. STRAIN Botany Department, Duke University, Durham, North Carolina 27706 (Y. H., P. J. K., A. W N., B. R. S.); and Department ofAgricultural Engineering, Ehime University, Matsuyama 790, Japan (T1 I.) ABSTRACT This paper describes a method for measuring the temperatures of all regions of an intact leaf by using an infrared scanning thermometer at wavelengths between 8 and 14 micrometers combined with a digital image processing system. Pictures obtained every 2 minutes from leaves of sunflower (Helianthus aanuus L. cv Large Russian) plants subjected to increasing water stress showed that water deficit develops first at the margins of leaves, accompanied by stomatal closure and increase in temperature. Finally, the temperature of the entire leaf rises 3 to 5°C above that of nonstressed leaves. When transpiration resumed, it did so first at the leaf margins and these proceeded nonuniformly inward. The results of these experiments indicate that there are significant differences in the temperature and water status of different parts of a leaf. This makes it important to determine causes of such behavior and decide in what part of a leaf the temperature and water status should be measured. The thermo-imaging method can be useful in monitoring short term temperature changes occurring in leaves undergoing water, chilling, and other stresses.
A number of methods have been used to measure plant water status under several stress conditions (14). These include measurements of leaf water content, relative water content, and leaf water potential by means of the pressure chamber and the psychrometric methods (2). Stomatal aperture generally is measured by porometers (13). The drawback, however, is that there is no satisfactory method of monitoring changes in leaf water status of all parts of a leaf blade. Localized water deficits may well foreshadow the necrosis and localized spotting often observed following imposition of stress. It was reported by Slavik ( 18) that the rates of photosynthesis and respiration were significantly higher at the base than at the tip of tobacco leaves, and the osmotic potential was lower. Rawlins ( 17) also observed differences in water status in various parts of large leaves. Differences have been noted as well in basal, mid-, and distal segments of maize leaves (15). Only a few attempts have been made to measure variations in temperature across a leaf. The observed differences have been attributed to differential transpiration rates (4). Many studies on leaf temperature have been undertaken from the standpoint of the physical energy budget (6), but variations in leaf temperature caused by
differential transpiration as a result oflocalized stomatal behavior differences have rarely been taken into consideration. It is very desirable to know the temperature of various regions of leaves because temperature can serve as an indicator of transpiration. If temperature measurements were combined with measurements of stomatal conductance or aperture, useful information would be provided concerning leaf water status as the leaf responds to environmental stresses. Leaf temperature can be measured continuously and nondestructively with IR thermometers (5, 19). Distributional patterns of surface temperature also can be measured with a scanning IR thermographic camera (3) and by IR thermography (16). Described herein is an improyed method that permits nondestructive monitoring of temperature changes over an entire leaf. This is done by means of an IR mechanical scanning camera connected to an image interface and a computer that processes the signals to produce a thermal picture of a leaf (7, 1 1). If desired, a complete scan be made every 2 s. Experiments with this equipment indicate that in well watered leaves the pattern of leaf temperature is closely related to the stomatal aperture patterns over the leaf surface as observed with a scanning electron microscope (1 1). When stomata were kept open by treatment with kinetin, variation in temperature over the leaf surface declined (8); but, when the stomata were closed with ABA, variation in temperature across the leaves increased (10). The next step was to quantitate dynamic variations in leaf water status and temperature of all parts of an entire leaf during increasing water stress. MATERIALS AND METHODS
Sunflower (Helianthus annuus L. cv Large Russian) plants were grown in a greenhouse for about 40 d following germination. Then, the plants were placed in a growth chamber (Koitotron, KGS-1, Japan) and kept at 25 ± 0.1°C and 50 ± 2% RH and irradiated with 570 uE m 2 s-' of fluorescent light (I 10 w x 32) supplemented with incandescent light (150 w x 8) for 12 h/ d. After 4 d under these conditions, the plants were considered acclimated. Actual rates of transpiration were 0.4 to 0.7 x 10-' g-cm 2s-' and stomatal conductance was 0.5 to 2.7 cm*s'. The fifth leaf of acclimated plants was used for measurement. A well watered plant served as the 'control.' To cause water stress, 40% of the root system of a previously measured control plant was removed and the plant was placed in the dark. Two h later, the light was turned on and new measurements made. Such plants are referred to as 'root pruned.' To avoid possible confounding effects by soil, a hydroponic system was used. The temperature of the nutrient solution (Minerap, Sumitimo Chemical Co., Japan) was kept at 24.9 to 25.80C. Net CO2 uptake was measured by an IR analyzer of the differential type (Hitachi-
' Supported in part by National Science Foundation Grant DEB8021312 to the Duke University Phytotron. 2Present address: Department of Agricultural Engineering, Ehime University, Tarumi, Matsuyama 790. Japan. 266
DYNAMIC ANALYSIS OF WATER STRESS
267
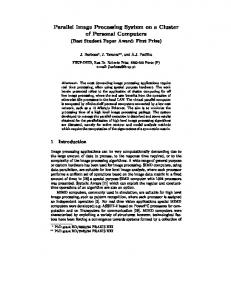
FIG. 1. Schematic diagram of the thermal image processing system.
accuracy of one picture element in the system is guaranteed to be no less than 0.1 C. Figure 1 shows the system used for measurement and control in this research. It consists of the image processing system for measuring the pattern of leaf temperature distribution (7), a scanning electron microscope to measure stomatal aperture (1 1), a system for the measurement of photosynthesis, and a computer controlled environmental system for the leaf cuvette and root (9). Following turning on of the light over a well watered plant, the average temperature was obtained with the IR thermometer. Net CO2 uptake was measured with the CO2 analyzer with continuous telemetry. Changes of the surface temperature with time over a whole leaf were obtained by the image processing of discrete pictures. Time (min) FIG. 2. Short-term plant responses in leaf temperature and net CO2 uptake following illumination. ( ), Responses by the 'Control;' (---), responses following root pruning. Air temperature maintained at 25 ± 0.1'C and RH at 50 ± 2%. The light is turned on at 0 min point, which is the starting point. D and D' are the approx. 6 min point before the 0 min point; a and a', the approx. 2.8 min point; b and b', the approx. 7 min point; c and c', the approx. 14 min point; d and d', the approx. 18 min point; e and e', the approx. 24 min point; f and f', the approx. 32 min point; g and g', the approx. 135 min point after the 0 min point, respectively.
Horiba, Japan). CO2 concentration of incoming air to the single leaf assimilation chamber was kept at 356 to 360 'I 1L'. To obtain leaf temperature, two different thermometers sensitive to IR emissivity between 8 and 14 Am were used. One was the usual IR thermometer (Matsushita ER-2005, Japan), used to obtain the continuous time course of leaf temperature. The sensor monitored the average temperature of a circle 30 mm in diameter on the leaf. The sensitivity and time constant of the thermometer was 0.1 °C and I s, respectively. The other thermometer was the newly devised image processing system, used to obtain the distribution of temperature over a whole leaf at discrete time intervals. The thermographic camera (JTG-MD, Japan) was mounted on a mechanical scanner based on a moving mirror. It has a field of 10 x 10 cm. The signals were fed to a computer (MELCOM70: core, 64kbytes; disc, 5Mbytes; and magnetic tape; Japan) through an image interface (7). Two s is enough time to obtain one picture composed of 256 x 240 picture elements, and 4 s are required to store in information on the disc via the image interface. Each picture element has 8 bits and the resolution of the thermographic camera is 0.05°C. Therefore, the integrated
RESULTS AND DISCUSSION Figure 2 shows the responses of a Control and Root-pruned sunflower plant when the light was turned on. The upper part of Figure 2 shows the time course of the average leaf temperature measured on a 30 mm diameter sub-area of a whole leaf. The lower part of Figure 2 shows the time course of net CO2 uptake. The time points in the chart shown as D and a to g for the Control, and D' and a' to g' for the Root-pruned plant give the leaf temperatures obtained with the image processing system. The initial water status of the leaves of the Control and the Root-pruned plants was similar, because the plants had been well watered and kept in darkness before turning on the light. The average leaf temperatures in both instances were observed to be equivalent to the surrounding air temperature of 25°C. When the plants were exposed to light (570 ,E m-2 s-') after they had been kept in the dark for 12 h, the temperature of both leaves rose at first because of a sudden gain in radiant energy (6). Later, at a or a', the temperature began to fall as transpiration increased following stomatal opening (1, 10, 12). However, transpiration later reached a plateau and leaf temperature ceased to fall at c and c'. In the Control, leaf water deficiency soon disappeared and during the next 100 minutes, the leaf temperature fell about 0.3°C (d-g). In contrast, in the Root-pruned plant, leaf temperature continued to rise after the 15 min point because transpiration was insufficient to reduce leaf temperature. At e' (about 24 min), the leaf temperature began to fall, but after f' (about 32 min), it slowly rose again. The lower part of Figure 2 shows CO2 uptake. In the Control, net CO2 uptake began to increase as the leaf temperature changed through a, b, and c. and reached a constant rate after about 10 min. This is an expected response if the stomata are fully open. In contrast, in the Root-pruned plant there was a decrease in net CO2 uptake at c', presumably because of stomatal closure caused by water deficit as indicated by observations reported by Hashi-
268
HASHIMOTO ET AL.
Plant Physiol. Vol. 76, 1984
FIG. 3. Distributional patterns of leaf temperature in sunflower leaf: D and a to g show changes in the Control over approximately 2.5 h. D' and a' to g' show changes in a leaf of the Root-pruned plant. D, D', a, a', etc. are the same points as shown in Figure 2.
moto et al. (1 1). Figure 3 shows 16 patterns of leaf temperature distribution obtained from the thermal images at the times shown in Figure 2, for both the Control and the Root-pruned plant. The distributional pattern is displayed in eight colors: white (28.5-27.8°C),
3 can be obtained in detail from examining frames from 1 to 6 in Figure 4. It is especially clear from frames 2, 3, 4, and 5 of Figure 4 that there is a progressive increase in leaf temperature from the edge inward. These findings can be interpreted to mean that a water deficit develops initially at the edge of the leaf, yellow (27.8-27.20C), pink (27.2-26.60C), red (26.6-26.0XC), resulting in stomatal closure and a decrease of transpiration with blue (26.0-25.4°C), green (25.4-24.80C), dark blue (24.8- a concomitant rise in temperature. 24.1 C), and black. Black denotes temperatures either over Next, changes in distributional pattern of leaf temperature 28.50C or under 24.10C. In the Control, the leaf temperature at from e' to f' can be followed by examining the frames numbered D seems to be nearly uniform over the entire leaf and at a, the 6 to 10 in Figure 4. Frames 6, 7, and 8 show that leaf temperature upper part of the leaf is displayed in black, so the leaf temperature decreased from near the edge of leaf as transpiration began to of these areas is over 28.5°C as shown at point a and a' on Figure increase following an increase in leaf water content. From frame 2, while the leaf temperature in the lower part is under 27.8°C. 10 onward, it seems that only the central parts of the leaf adjacent At b, the leaf temperature of the lower part fell below 26.6°C. At to the main veins were maintained at a lower temperature. c, the minimum leaf temperature, the temperature of the entire Apparently, stomatal closure, caused by a water deficit, prevailed leaf was below 25.40C. From c to f, the distributional pattern of in almost all parts of the leaf except in the central sector. leaf temperatures did not change significantly. At g, the temperThese data show that significant differences arise in temperaature of almost the entire leaf was below 24.80C. In contrast, in ture patterns over the whole leaf during the development of water the Root-pruned plant, distributional patterns of leaf tempera- stress. Thus, stomatal aperture and transpiration by a single leaf ture from c' to f' were quite different and more complex than may show considerable variation within a short time span. This those in the Control. suggestion is supported by other observations reported by HashIn order to follow changes in leaf temperature patterns under imoto et al. (I 1), where the close relationship between stomatal water stress in greater detail, we obtained images every 2 min aperture and leaf temperature was obtained by using the image from the starting point of c', over a 22 min time span (Fig. 4). processing system linked to a scanning electron microscope for The distributional pattern of c' shown in Figure 3 corresponds 30 stomata in each sampled piece of well watered normal toto that of 1 shown in Figure 4; similarly, d' corresponds to 3, e' bacco. Therefore, when the water status of a plant is to be to 6, and f' to 10, respectively. For example, information about measured, it is very important to decide where samples are to be time course changes in leaf temperature from c' to e' in Figure taken for the psychrometer or where the sensing part of porom-
DYNAMIC ANALYSIS OF WATER STRESS
269
FIG. 4. Temperature pattern changes in a single leaf over a 22-min period in the Root-pruned plant. Picture imaged at 2-min intervals starting at c'.
eter is to be attached and to be consistent in sampling procedures. Furthermore, this method is expected to be useful not only in determining short-term plant response under water stress but also in estimating plant responses under many other stresses, such as those described by Treshow (20).
10. I 1.
LITERATURE CITED 1. BARRS HD 1971 Cyclic variation in stomatal aperture, transpiration, and leaf water potential under constant environmental conditions. Annu Rev Plant
2. 3. 4.
5. 6. 7.
8.
9.
Physiol 22: 223-236 BOYER JS 1969 Measurement of water status of plants. Annu Rev Plant Physiol 20: 351-364 CETAS DM 1978 Practical thermometry with a thermographic camera. Rev Sci Instrum 49: 245-254 COOK( GD. AC LEOPOLD. JR DIXON 1964 Transpiration: Its effects on plant leaf temperature. Science 144: 546-547 FUCHS M, CB TANNER 1966 Infrared thermometry of vegetation. Agron J 58: 597-601 GATES DM 1968 Transpiration and leaf temperature. Annu Rev Plant Physiol 19: 211-238 HASHIMOTO Y. N NIWA 1978 Image processing of leaf information. Joint Conf Image Processing 9: 51-54 (in Japanese) HASHIMOTO Y. T MORIMOTO, S FUNADA 1980 Computer processing of speaking plant for climate control and computer aided cultivation. Acta Hortic 115: 3 17-325 HASHIMOTO Y. T MORIMOTO, S FUNADA, J SuGi 1981 Optimal control of greenhouse climate by the identification of water deficiency and photosynthesis in short-term plant growth. In H Akashi, ed, Control Science and
12.
13. 14. 15.
16. 17. 18.
19.
20.
Technology for The Progress of Society (Proceedings of The Eighth Triennial World Congress of The International Federation of Automatic Control). Pergamon Press, Oxford, pp 3621-3626 HASHIMOTO Y 1982 Dynamic behaviour of leaf temperature. Biol Sci (Tokyo) 34: 68-75 (in Japanese) HASHIMOTO Y. T MORIMOTO, S FUNADA 1982 Image processing of plant information in the relation between leaf temperature and stomatal aperture. In G Striker, K Havrilla, J Solt, T Kemeny, eds, Technological and Methodological Advances in Measurement, Vol 3. North-Holland Publishing Co., Amsterdam, pp 313-320 HOPMANS PAM 1971 Rhythms in stomatal opening of bean leaves. Meded Landbou Wageningen 71: 1-86 HSIAo TC, RA FISHER 1975 Mass flow meters. Wash State Univ Coll Agric Res Cent Bull 809: 5-1 1 KRAMER PJ 1983 Water Relations of Plants. Academic Press, New York MICHELENA VA, JS BOYER 1982 Complete turgor maintenance at low water potentials in the elongative region of maize leaves. Plant Physiol 69: 11451149 PIETERS CA 1975 Thermography and plant physiology. Bibl Radiol 6: 210217 RAWLINS SL 1963 Resistance to water flow in the transpiration stream. Conn Agric Exp Stn Bull (New Haven) 664: 69-85 SLAViK B 1963 On the problem of the relationship between hydration of leaf tissue and intensity of photosynthesis and respiration. In AJ Rutter, FH Whitehead, eds. The Water Relations of Plants. John Wiley & Son, New York pp 225-234 TAKIUCHI M, Y HASHIMOTO 1977 Measurement of leaf temperature by means of infrared thermometer in connection with plant physiological information. Trans Soc Instr Cont Eng 13: 482-488 (in Japanese) TRESHOW M 1970 Environment and Plant Response. McGraw Hill, New York