consistent with the operation of a H+: solute symporter. .... 100. Points. 200. Fig. 4. A. Ratio image and brightness profile along the transect indicated of BCECF-.
Measurement of intracellular pH in fungal hyphae using BCECF and digital imaging microscopy Evidence for a primary proton pump in the plasmalemma of a marine fungus
JULIA M. DAVIES1'3'*, C. BROWNLEE2 and D. H. JENNINGS 1 1
Department of Genetics and Microbiology, University of Liverpool, PO Box 147, Liverpool L69 3BX, UK ^Marine Biological Association, The Laboratory, Citadel Hill, Plymouth PL1 2PB, UK ^Present address: Department of Biology, University of York, Heslington, York Y01 5DD, UK * Author for correspondence
Summary The facultative marine fungus, Dendryphiella salina, has the most negative membrane potential yet recorded for a marine organism. The ionic basis for this is thought to be through the action of a primary proton pump, though there exists the possibility of electrogenic pumping of Na+ or Cl~, given the high ambient concentration of these ions. Fluorescence ratio imaging microscopy with the pH-sensitive fluorescent probe 2',7'-bis-(2-carboxyethyl)-5(and-6) carboxyfluorescein (BCECF) has been used to estimate intracellular pH. Hyphae loaded readily with BCECF after incubation with the acetoxymethyl ester (BCECF/AM). Mean resting intracellular pH (pHi) was 7.3, calculated by comparing 490/450 nm fluorescence ratios with in vivo calibration curves
obtained by pH equilibration using nigericin. Distinct pH compartments could be observed, corresponding to cytoplasmic and smaller vacuolar compartments. Sodium azide reversibly reduced pHi by an average of 0.51 of a pH unit, though the response varied between individual hyphae. Inhibiting the plasmalemma ATPase with orthovanadate also reversibly decreased pH|. The results support the presence of a proton pump in the plasmamembrane. The energetic and evolutionary implications are discussed.
Introduction
electrochemical gradient (A/iH+). The morphology of D. salina renders the use of H+-sensitive microelectrodes unsuitable and the magnitude of Aty might distort pH estimates using lipophilic probes (Raven and Smith, 1978). An alternative method uses the fluorescent pH probe BCECF. The acetoxymethyl ester form of the dye diffuses into the cell where esterase activity releases the pHsensitive free acid (Tsien, 1981; Bright et al. 1987; Dixon et al. 1989; Paradiso et al. 1984). In this work, BCECF has been used to estimate pHj and to assess the effects of azide and vanadate as inhibitors of the mitochondrial H+-ATPase and plasmamembrane ATPase, respectively.
Mesophytic plants and fungi energise secondary solute transport through vectorial translocation of H + at the plasma membrane (Serrano, 1984). The active extrusion of H + generates a proton electrochemical gradient (A^H+) that can be partitioned into membrane potential (AV) and pH (ApH) components. Solute uptake is coupled to the reentry of H + . For a marine fungus, the high ambient pH (pH 8) could put H + at a premium and necessitate the use of Na + or Cl~ as the working ion of primary and/or secondary systems. Precedents for electrogenic primary Na + and Cl~ transport come from the marine algae Halicystis (Blount and Levendahl, 1960) and Acetabularia (Saddler, 1970). Dendryphiella salina is a facultative marine fungus and is thought to have evolved from a terrestrial ancestor (Kohlmeyer, 1974; Kohlmeyer and Kohlmeyer, 1979). The possible retention of typical mesophytic H+-based transport systems has been explored in a series of electrophysiological studies (Brownlee, 1984; Davies et al. 1990). In D. salina, the large negative A'V was found to be metabolic in origin and sensitive to specific inhibitors of the plant and fungal plasma membrane H + ATPase. Uptake of glucose depolarised A1!* in a manner consistent with the operation of a H + : solute symporter. Further evidence for primary H + pumping would come from the estimation and manipulation of the proton Journal of Cell Science 96, 731-736 (1990) Printed in Great Britain © The Company of Biologists Limited 1990
Key words: intracellular pH, ratio imaging, proton pump, marine fungus.
Materials and methods Stock cultures of Dendryphiella salina Sutherl. (Pugh & Nicot) pp6604 were grown on plates of (w/w) 0.5% glucose, 0.3% tryptone, 1 % agar in filtered sea water for 14 days at 20°C. Then, 0.6 cm discs from the periphery of cultures were inoculated onto 2 cm x 2 cm cellophane squares laid on fresh agar. These were incubated for 3 days at 20 °C.
Fluorescence microscopy Hyphae growing on cellophane were bathed in lcm 3 glucoseartificial sea water medium (GASW: (in mM) NaCl, 500; KC1, 10;
731
CaCl2, 10; KHCO3, 2.5; Tris/HCl, 10; pH8.0). BCECF/AM was added to the bathing medium to a final concentration of 6 fiM from a 1 mM stock solution in dimethyl sulphoxide. Hyphae were incubated for 60-90 min and then washed with 10 x 1 cm3 portions of GASW. Fluorescence was observed with a modified Zeiss fluorescence microscope with a x40 Neofluar water immersion objective. Excitation wavelengths were produced with a SOW mercury vapour lamp and 10 nm bandwidth filters (490 and 460 nm). Filters were changed manually. Excitation was restricted to ~ 10 s to minimise dye bleaching. Fluorescence was monitored at 530 nm through a 50 nm bandwidth filter. Images were recorded with an image-intensified CCTV camera (Panasonic, Japan) and stored on video tape.
Image analysis Images were digitised using a Kontron digital image analyser with IBAS software (512x512 pixels, 256 grey levels). After subtraction of autofluorescence, recorded before dye loading, 490/450 nm ratio images of dye-loaded cells were obtained (Bright et al. 1987). Up to 10 frames were averaged for each image. Brightness profiles across selected hyphal transects in the ratio images were compared with calibration curves (see below) to give intracellular pH values.
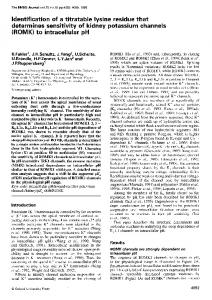
2.5
•S 1-5
0.5
5
6
7 PH
8
9
Fig. 1. In vitro (A) and in situ ( • , • ) pH calibration curves; (•) hyphae equilibrated with 112.5 mM K + /nigericin solutions; (•) hyphae equilibrated with 10 mM K + /nigericin solutions.
Calibration An in vitro calibration curve was obtained from drops of buffer (130 mM KC1, lmM MgCl2, 15 mM Mes, 15 mM Hepes, pH5-9) (Bright et al. 1987) on a microscope slide. In situ calibration was carried out on dye-loaded hyphae after incubating in either low K + /nigericin (GASW+15mM Mes, 15 mM Taps, 3mM sodium azide, with 10//gcm~3 nigericin, pH5-9) or high K + /nigericin (the above solution modified by substituting 100 mM NaCl with 100 mM KC1). After equilibration in these solutions for 5-10 min, fluorescence was recorded and hyphae were washed with 5x1 cm buffer at the next pH. The sequence was repeated for each pH tested. Calibration curves (fluorescence ratio as a function of pH) were constructed from these treatments for comparison with experimental pH measurements.
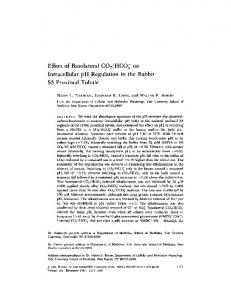
Results After loading with BCECF/AM, fluorescence was restricted to viable hyphae. Conidia or hyphae that had been deliberately damaged did not fluoresce. BCECF/AM had no effect on hyphal extension rates (not shown). Dye distribution was generally diffuse throughout the cytoplasm, though occasional bright spots were observed, probably representing accumulation into small vacuoles. Such regions were avoided in quantitative measurements of cytoplasmic pH where possible. Experimental and calibration ratio values were computed by averaging 10-20 points along a profile of the ratio image. All three calibration curves showed linearity in the pH range 6-8 (Fig. 1). The in vitro and high K + /nigericin in situ calibrations showed good agreement but the low K + /nigericin in situ standards gave significantly lower mean ratio values. Fig. 2A-C shows brightfield, 490 nm and 450 nm fluorescence images of a BCECFloaded hypha bathed in GASW, pH8.0. The corresponding 490/450 nm ratio image is shown in Fig. 2D. The high background ratio is due to slight persistence of extracellular fluorescence following washing, possibly due to adsorption of leaked dye to the cellophane substrate or incomplete washing of the BCECF/AM used during loading. Fluorescence from out-of-focus hyphae will also contribute to the background ratio. The high extracellular ratio value does not significantly affect the hyphal ratio values, since the absolute fluorescence is much higher from the loaded hyphae. For clearer presentation of the hyphal ratio image 732
J. M. Davies et al.
Fig. 2. A. Bright-field image of mature hyphae. Bar, 10 /an. B,C. 490 and 450 nm fluorescence images of the same BCECFloaded hyphae in GASW. D. 490/450 nm ratio image.
and to define precisely the hyphal edges, the bright-field image of the hypha has been used as a template to mask the background (Fig. 3A). The hypha shows a complex distribution of pHj values. A mean pH^ was calculated from 15 profile points (Fig. 3A) using the high K + calibration. The mean intracellular pH from 10 hyphae bathed in GASW at pH8 was 7.33 (±0.34) (ire vitro calibration) or 7.30 (±0.32) (high K + calibration). These are gross estimates, which do not distinguish between cytoplasmic and the smaller vacuolar compartments. Two ratio profiles across clearly vacuolar regions (Fig. 3A, arrows) gave a mean vacuolar pH of 5.85. A 5 min incubation with 3mM sodium azide produced a clear reduction in fluorescence ratio (Fig. 3B). The pH of this azide-treated hypha was estimated to be