www.nature.com/scientificreports
OPEN
Received: 8 December 2017 Accepted: 4 October 2018 Published: xx xx xxxx
Measurement of mean subcutaneous fat thickness: eight standardised ultrasound sites compared to 216 randomly selected sites Paul Störchle1, Wolfram Müller1, Marietta Sengeis1, Sonja Lackner2, Sandra Holasek2 & Alfred Fürhapter-Rieger1 Ultrasound (US) provides the most accurate technique for thickness measurements of subcutaneous adipose tissue (SAT) layers. This US method was recently standardised using eight sites to capture SAT patterning and allows distinguishing between fat and embedded fibrous structures. These eight sites chosen for fat patterning studies do not represent the mean SAT thickness measured all over the body that is necessary for determining subcutaneous fat mass. This was obtained by SAT measurements at 216 sites distributed randomly all over the body. Ten participants with BMI below 28.5kgm−2 and SAT means (from eight sites) ranging from 3 mm to 10 mm were selected. The means from eight sites overestimated the means obtained from 216 sites (i.e. 2160 US measurements in the ten participants); the calibration factor of 0.65 corrects this; standard deviation (SD) was 0.05, i.e. 8%. The SD of the calibration factor transforms linearly when estimating the error range of the whole body’s SAT volume (body surface area times the calibrated mean SAT thickness). The SAT masses ranged from 3.2 to 12.4 kg in this group. The standard deviations resulting from solely the calibration factor uncertainty were ±0.3 and ±1.0 kg, respectively. For these examples, the SAT percentages were 4.9(±0.4)% and 13.3(±1.0)%. A balanced body composition is an essential determinant of both health and physical performance. Noncommunicable chronic diseases that are associated to inactivity and body composition disturbances are among the major public health problems of the 21st century1,2. According to the World Health Organization (WHO), the worldwide prevalence of obesity nearly doubled between 1980 and 2014. Meanwhile more than 1.9 billion adults are overweight, and more than half a billion of them are obese2. Overweight and obesity were estimated to account for 3.4 million deaths per year and 93.6 million disability-adjusted life years in 20102,3. On the other hand, malnutrition and eating disorders can lead to underweight and body composition disturbances that are likely to result in severe diseases like anorexia nervosa, which is associated with alarming mental and physical implications and a high mortality rate4–7. Better protection of health and the development of improved diagnostic criteria and intervention control depend on the availability of accurate and reliable methods for assessing body composition. Ultrasound has been established as an accurate and reliable method for measuring subcutaneous adipose tissue (SAT) thicknesses when used in standardised way.
Body Composition Assessment Techniques
Over the past decades, many measurement techniques and equations have been developed for body composition assessment; among them are reference, laboratory, and field methods8–10. The body composition components can be analysed on the molecular or on the anatomical level. The most accurate method for determining body fat on the molecular level is the 4-component model8,11,12 that measures the hydration status (D2O-diliution method), density (underwater weighing or plethysmography), bone mineral density (double X-ray absorptiometry, DXA), and determines the total body fat content (TBF) this 1
Medical University of Graz, Institute of Biophysics, Graz, Austria. 2Medical University of Graz, Institute of Pathophysiology and Immunology, Graz, Austria. Correspondence and requests for materials should be addressed to W.M. (email:
[email protected])
SCIentIfIC REPOrTS |
(2018) 8:16268 | DOI:10.1038/s41598-018-34213-0
1
www.nature.com/scientificreports/ way. Other methods like bio-impedance (BIA), or calculations based on skinfolds or near infrared spectroscopy, are associated with major measurement errors and therefore of limited value8,11,13. Also the X-ray based DXA method for fat measurement is far from being the gold standard, particularly in slim persons where severe measurement errors can occur; even “negative” amounts of fat on the trunk have been “measured”8. Manufacturers use different simplifying models and calculation algorithms which are necessary because two X-ray energies are not capable of distinguishing between three sorts of tissue (bone, muscle, and fat). This results in different “measurement values” depending on the machine used and also on the individual deviations from the type of “standard person” mapped in the algorithm. There is also a difference in pencil versus fan-beam accuracy, and according to Aragon et al.11, DXA may be unreliable for longitudinal studies of subjects who undergo major changes in glycogen or hydration status between measurements, when compared to the 4 component model8,11. On the anatomical level, cadaver dissections, skinfold thickness measurements, or medical imaging techniques like MRI, CT, and US are in use. It has been shown recently that US provides the highest measurement accuracy for thickness measurement of SAT13–17 because image resolution can be as high as 0.1 mm (18 MHz probe) when using state-of-the art US equipment, whereas pixel size in MRI used for total body scans today is typically between 1.3 and 2.0 mm only8. However, there are many inherent problems involved in all measurement techniques and in the assumptions they make8–11,13,18. Skinfold methods for measuring SAT thickness are of limited value because fat is highly compressible, and skin thickness, which is included in skinfold measurements, varies from site to site and among individuals8,13,15. Many methods that are widely used in field studies are not standardised sufficiently. When the body composition status is assessed with multiple technologies, often results vary substantially because accuracy, reliability, or both are far from what should be expected from a good measurement technique8,13. Such results are confusing and not helpful for diagnosis or treatment control. Particularly high demands on accuracy and reliability are necessary when investigating athletes, where body composition is a major performance determinant. Inaccurate measurements of body composition and its changes would be confusing and misleading: most athletes have very low body fat and therefore very high accuracy and reliability is necessary for detecting the small changes of relevance for performance optimisation, and also for monitoring the health status of the athletes in order to prevent severe diseases like anorexia nervosa or other medical (and performance) problems associated with eating disorders19–21. Most recently, the best techniques for measuring body composition have been summarised in Best Practice Protocols for Physique Assessment in Sport13. Application of poor methods in terms of accuracy and reliability or both can be misleading, particularly in competitive sports, and also in other groups where body composition is a crucial health factor like in anorexia nervosa patients (this wide-spread severe disease is among the major medical problem in both female and male athletes)8,15,19.
Ultrasound Measurement of Subcutaneous Adipose Tissue (SAT)
Adipose tissue is mainly stored in the subcutaneous region of the body, but significant amounts can also be found near organs (visceral adipose tissue, VAT), in the bone marrows, and within tissues, e.g. in muscle9,22. The amount of SAT ranges from only a few kilograms up to 50% of body weight and even more17. Adipose tissue consists of adipocytes and embedded collagen and elastin fibres which support the tissue23. US was used for SAT thickness measurements in 1965 and 1966 already24,25. Bellisari et al. found that interand intra-observer errors were less than 0.15 mm at all of their investigated sites, except for triceps where they found 0.6 mm26. US has also been applied for measuring visceral fat. Koda et al.27 compared MRI measurements to US measurements of subcutaneous and visceral fat and they already found that US was highly accurate and reliable. 2016 a standardised US technique for measuring SAT has been presented16,17. US is the only imaging method capable of measuring both the thickness of the fat layer with and without the embedded structures14–16,28. The applicability of this novel approach in groups with overweight and obesity has been shown by Störchle et al.17. Eight sites are used to represent the trunk (three), the arms (two), and the legs (three). US images of all sites show a simple structure: skin, SAT, muscle fascia. The sites were selected such that the thickness of the layer does not change appreciably in the vicinity of the site; this increases reliability. Site marking is easy and can be learned with high precision within short time (one hour training is sufficient). All distances necessary to define the sites are relative to the body height of the person. This highly accurate and reliable US approach avoids compression artefacts, distinguishes between fat tissue and embedded structures, is not invasive, does not use ionising radiation, and is easily applicable in the field. However, it cannot be assumed that the mean thickness value of these eight standardised sites that were selected for fat patterning analyses is the best representation of the real mean SAT thickness which is needed to calculate the fat mass. Therefore, extended measurement series containing many more (and randomly selected) sites are necessary to calibrate the mean obtained from the eight standardised sites16,17.
Results
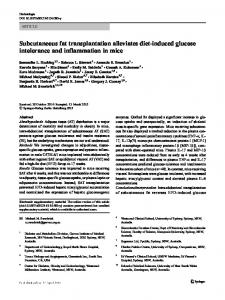
In a group of ten male participants (Table 1), subcutaneous adipose tissue (SAT) was measured twice at eight standardised sites using a recently developed ultrasound (US) method16,17. As an example, the US image of SAT at one of the eight standardised sites (lateral thigh, LT) is shown in Fig. 1d. In addition, SAT was also measured with the same US technique at 216 sites that were randomly distributed all over the body (Fig. 1a–c). The sums of the eight SAT thicknesses (D) of all 10 participants are shown in Table 2, and mean values of these eight measurements (dM8) are presented in Table 3. Thicknesses including the fibrous structures embedded in the SAT are indicated by the index “I”, measurements where these structures were excluded are indicated by the index “E”, and “F” indicates the thicknesses of the fibrous structures. For SAT thicknesses at individual measurement sites, the lower case letter “d” is used, and for the sums obtained from the eight sites at each participant, capital “D” is used. Table 2 also presents the surface areas (S) of the participants according to DuBois29, Haycock30, and Mosteller31, and also the means (SM) of these three. SCIentIfIC REPOrTS |
(2018) 8:16268 | DOI:10.1038/s41598-018-34213-0
2
www.nature.com/scientificreports/
A
Unit
P1
P2
P3
P4
P5
P6
P7
P8
P9
P10
M
SD
MD
MAX
MIN
y
21
26
27
23
22
26
20
21
21
31
23.8
3.6
22.5
31
20
m
kg
66.0
64.6
71.6
95.1
72.4
62.5
96.2
85.6
84.1
92.7
79.1
13.2
78.3
96.2
62.5
h
m
1.816
1.749
1.813
1.919
1.674
1.751
1.840
1.941
1.903
1.853
1.826
0.084
1.828
1.941
1.674
s
m
0.940
0.947
0.964
1.060
0.892
0.911
1.065
1.014
0.982
1.017
0.979
0.059
0.973
1.065
0.892
w
m
0.831
0.716
0.745
0.773
0.735
0.776
0.883
0.830
0.728
0.693
0.771
0.060
0.759
0.883
0.693
g
m
0.980
0.898
0.924
0.936
0.910
0.941
1.044
1.055
0.899
0.887
0.947
0.060
0.93
1.055
0.887
b
m
0.337
0.298
0.300
0.345
0.300
0.325
0.367
0.363
0.329
0.334
0.330
0.025
0.332
0.367
0.298
t
m
0.524
0.469
0.464
0.499
0.468
0.510
0.602
0.526
0.494
0.483
0.504
0.041
0.497
0.602
0.464
BMI
kgm−2
20.0
21.1
21.8
25.8
25.8
20.4
28.4
22.7
23.2
27.0
23.6
2.9
23.0
28.4
20.0
MI1
kgm−2
20.5
20.7
21.7
24.8
25.7
20.8
26.0
23.1
23.9
26.1
23.3
2.3
23.5
26.1
20.5
C
1
0.516
0.526
0.518
0.513
0.523
0.532
0.549
0.522
0.541
0.531
0.527
0.011
0.524
0.549
0.513
W
1
0.44
0.40
0.41
0.45
0.41
0.43
0.48
0.43
0.42
0.38
0.42
0.03
0.42
0.48
0.38
Table 1. Characteristics and anthropometric data of participants. The group included young normal or slightly overweight males (BMImin = 20.0 kgm−2; BMImax = 28.4 kgm−2). The table shows the individual values, mean values (M), standard deviations (SD), median (MD), maximum (MAX), and minimum (MIN) values of the following personal data: A (age), m (body mass), h (body height), s (sitting height), w (waist girth), g (gluteal girth), b (biceps girth flexed and tensed), t (thigh girth). Additionally, the following indices are included: body mass index (BMI), mass index (MI1), cormic index (C), and the waist to height ratio (W).
Figure 1. Ultrasound (US) measurement of mean subcutaneous adipose tissue (SAT). (a,b) exemplarily show randomly distributed measurement sites on the upper body of one of the ten participants. Crosses (+) belong to the first measurement series of 108 sites distributed all over the body, squares (□) to the second series. (c) Schematic drawing according to Lund and Browder32 indicating the 12 body parts. The segment genitalia was ignored in our study. In order to obtain integer numbers also for subsets of 108 and 54 sites, the following numbers of sites on the individual body parts were used: head HE (7%, 16 sites), neck NE (2%, 4 sites), anterior trunk AT (13%, 28 sites), posterior trunk PT (13%, 28 sites), buttocks BU (5%, 12 sites), upper arms AU (8%, 16 sites), forearms FA (6%, 12 sites), hands HA (5%, 12 sites), thighs TH (19%, 40 sites), legs LE (14%, 32 sites), and feet FE (7%, 16 sites). (d) Example of an evaluated US image. The red area represents the SAT in the region of interest (ROI). Marked are: the thick layer of US gel (which prevents compression), the epidermis, dermis, SAT, embedded fibrous structure, the fascia of the muscle, and the muscle underneath. In this example, the semiautomatic image evaluation software (USTissue Scientific - FAT Analysis Tool) measured 92 thicknesses with a mean value of dI = 6.95 mm, and dE = 5.51 mm. The dI value includes the thickness of the fibrous structures, dE represents the SAT without fibrous structures.
SCIentIfIC REPOrTS |
(2018) 8:16268 | DOI:10.1038/s41598-018-34213-0
3
www.nature.com/scientificreports/ Unit
P1
P2
P3
P4
P5
P6
P7
P8
P9
P10
M
SD
MD
MAX
MIN
DI
mm
23.5
28.4
31.8
36.0
39.7
45.5
51.6
59.6
62.1
81.6
46.0
18.0
42.6
81.6
23.5 18.5
DE
mm
18.5
23.2
25.9
30.9
34.9
39.2
44.9
53.5
51.8
74.6
39.8
17.0
37.1
74.6
DF
mm
5.0
5.2
5.9
5.1
4.8
6.3
6.7
6.1
10.3
7.0
6.2
1.6
6.0
10.3
DF/DI
1
0.21
0.18
0.19
0.14
0.12
0.14
0.13
0.10
0.09
0.14
0.04
0.14
0.17
0.21
4.8 0.09
S1
m²
1.85
1.79
1.91
2.25
1.82
1.76
2.19
2.17
2.12
2.17
2.0
0.19
2.02
2.25
1.76
S2
m²
1.82
1.77
1.90
2.26
1.85
1.74
2.24
2.14
2.11
2.20
2.0
0.21
2.00
2.26
1.74
S3
m²
1.82
1.77
1.90
2.25
1.83
1.74
2.22
2.15
2.11
2.18
2.0
0.20
2.00
2.25
1.74
SM
m²
1.83
1.78
1.90
2.25
1.83
1.75
2.22
2.15
2.11
2.18
2.0
0.20
2.01
2.25
1.75
VSATI
dm³
3.49
4.05
5.23
6.73
6.16
6.45
10.70
9.45
9.75
13.42
7.54
3.18
6.59
13.42
3.49
VSATE
dm³
2.82
3.26
4.45
5.63
5.05
5.49
9.61
8.31
8.16
12.09
6.49
2.96
5.56
12.09
2.82
TSATI
kg
3.21
3.73
4.81
6.19
5.67
5.94
9.84
8.69
8.97
12.35
6.94
2.92
6.06
12.35
3.21
TSATE
kg
2.59
3.00
4.09
5.18
4.65
5.05
8.84
7.64
7.51
11.12
5.97
2.73
5.12
11.12
2.59
TSATI%
%
4.9
5.8
6.7
6.5
7.8
9.5
10.2
10.2
10.7
13.3
8.56
2.64
8.66
13.32
4.86
TSATE%
%
3.9
4.6
5.7
5.4
6.4
8.1
9.2
8.9
8.9
12.0
7.33
2.51
7.25
12.
3.93
Table 2. Sums of subcutaneous adipose tissue from eight sites. The table presents the sums (D) of subcutaneous adipose tissue (SAT) thicknesses measured at the eight standardised sites: DI (fibrous structures included), DE (fibrous structures excluded), DF (fibrous structures). S1, S2, and S3 represent the surface areas according to DuBois29, Haycock30, and Mosteller31, respectively. The total SAT volume VSAT [dm³] = dM216 [mm] ∙ SM [m²]. The total SAT mass in kg: TSAT = VSAT ∙ ρ, with ρ = 0.92 [kg dm−3] for the density of fat33. TSAT[%] = 100 ∙ TSAT/m.
P1
P2
P3
P4
P5
P6
P7
P8
P9
P10
M
dIM8
2.94
3.55
3.98
4.50
4.97
5.69
6.45
7.46
7.76
10.20
5.75
dIM216
1.91
2.28
2.75
2.98
3.36
3.69
4.83
4.39
4.62
6.14
3.69
dIM108a
1.99
2.18
2.72
2.88
3.58
3.91
4.26
4.53
4.44
6.14
3.66
dIM108b
1.82
2.39
2.77
3.09
3.14
3.47
5.40
4.24
4.79
6.15
3.73
dEM8
2.32
2.90
3.24
3.87
4.36
4.90
5.61
6.69
6.48
9.33
4.97
dEM216
1.54
1.84
2.34
2.50
2.76
3.14
4.34
3.86
3.86
5.54
3.17
dEM108a
1.60
1.74
2.32
2.41
2.95
3.34
3.75
4.00
3.69
5.56
3.14
dEM108b
1.48
1.93
2.35
2.58
2.56
2.95
4.93
3.72
4.04
5.51
3.20
dFM8
0.62
0.65
0.74
0.64
0.60
0.79
0.84
0.76
1.28
0.87
0.78
dFM216
0.37
0.44
0.41
0.49
0.60
0.55
0.49
0.53
0.75
0.61
0.52
dFM108a
0.39
0.44
0.40
0.46
0.63
0.57
0.51
0.54
0.75
0.58
0.53
dFM108b
0.34
0.45
0.42
0.51
0.58
0.53
0.47
0.52
0.75
0.64
0.52
Table 3. Measurement of mean SAT. Mean SAT thicknesses dM. The upper part shows mean SAT thicknesses obtained from eight standardised sites (dM8)16, and from 216 randomised sites on the body of each of the ten participants. The latter measurements were performed in two series of 108 measurements each (dM108). The index I stands for fibrous structures included in the thickness measurement, E for excluded, and F for the thickness of the fibrous structures.
The measurements at the 216 sites resulted in the reference means of SAT thicknesses for each of the participants (Table 3). A comparison of the SAT means obtained with the eight standardised sites16,17 is presented in Fig. 2. Means of typically 50 to 300 measurements obtained from each US image were used to represent the SAT thickness at a given individual site. The mean thicknesses obtained from the eight standardised sites deviated from the means obtained from the 216 randomised sites. The factor k represents this for the individual ten participants (Table 4). For measurements that included (index “I”) fibrous structures the calibration equation is: dIM216 = dIM8 ∙ kIM216, and for measurements that exclude (index “E”) fibrous structures: dEM216 = dEM8 ∙ kEM216. The table also shows the factors when the eight-site measurements are compared to the 108-site measurements (the measurement series of 216 sites was taken in two series of 108 sites each). The k-values corresponding to 216 measurements with fibrous structures included (I), and without (E), are shown in Fig. 3a,c, and for the 108-site measurement series in Fig. 3b,d. Mean k values were 0.65 in both cases. Figure 4a and c show the correlations between the mean thicknesses obtained for the 216 randomised sites (dM216) and the calibrated means (dM8,k) from the eight standardised sites according to: dM8,k = k ∙ dM8. The correlation coefficient R² was 0.95 (p