Azmi et al.---------------------------------------------------------------------Prosiding Seminar Nasional APISORA 2018
MEASUREMENT OF METAL THICKNESS USING X-RAY COMPUTED RADIOGRAPHY Pengukuran Ketebalan Logam Menggunakan Computed Radiography Sinar-X Bayu Azmi*, Harun Al Rasyid Ramadhany, and Firliyani Rahmatia Ningsih Center for Isotopes and Radiation Application, National Nuclear Energy Agency Jl. Lebak Bulus Raya No 49, Jakarta 12440, Indonesia *Corresponding author:
[email protected]
ABSTRACT Computed radiography (CR) uses the similar equipment as conventional radiography except the presence of imaging plate (IP) that replace films for recording images. The applications of radiography in the industry include products inspection, welds inspection, and others. This paper explores the use of X-ray CR to measure the thickness of metal. Inspection of metal (material) thickness of process industrial units is essential to ensure the production continuity and safety. A steel step wedge was used as the standard value of IP’s blackness with thickness of material. The measurement parameters are 130 kV and 5 mA for the X-ray machine and source to detector (IP) distance (SDD) is 600 mm with exposure time of 45 seconds. There are three steel samples with thickness of 8.5 mm, 9.5 mm, and 16 mm with three repetitions of testing for each sample. The results show the pixel values of the standard matches the pixel values at the samples for each thickness. This proves if X-ray CR can be applied to measure the thickness of material in addition to inspect products and welds. Therefore, further research is necessary to get a better method and standard. Keywords: computed radiography; imaging plate; industry; material inspection; X-ray ABSTRAK Computed radiography (CR) menggunakan peralatan yang serupa dengan radiografi konvensional kecuali penggunaan imaging plate (IP) yang menggantikan film untuk perekaman citra. Aplikasi radiografi di industri meliputi inspeksi produk, inspeksi pengelasan, dan lainnya. Paper ini mengembangkan penggunaan CR sinar-X untuk mengukur ketebalan dari logam. Inspeksi ketebalan logam (material) pada unit-unit industri proses sangat penting untuk memastikan keberlangsungan produksi dan keselamatan. Sebuah step wedge baja digunakan sebagai nilai standar tingkat kehitaman IP berbanding ketebalan material. Parameter pengukuran adalah 130 kV dan 5 mA untuk mesin sinar-X dan jarak sumber ke IP adalah 600 mm dengan waktu penyinaran selama 45 detik. Terdapat tiga sampel baja dengan ketebalan 8,5 mm, 9,5 mm, dan 16 mm dengan tiga kali pengulangan pengukuran pada tiap sampel. Hasilnya menunjukkan nilai-nilai piksel dari standar sesuai dengan nilai-nilai piksel pada sampel untuk masing-masing ketebalan. Ini membuktikan CR sinar-X dapat diaplikasikan untuk menghitung ketebalan material selain inspeksi produk dan lasan. Oleh karena itu, dibutuhkan penelitian lebih lanjut untuk mendapatkan metode dan standar yang lebih baik. Kata kunci: computed radiography; imaging plate; industri; inspeksi material; sinar-X
INTRODUCTION The structures of all kinds are usually made of metal plates subjected to constraints related to their functioning and climatic conditions [1]. The units in process industry are generally made of metal with workloads such as high temperature, high pressure, high acidity materials, vibration, and so on. In the case of metal thickness, corrosion may cause significant reduction in thickness. For example, Flow Accelerated Corrosion (FAC) has extensively occurred in power industry, process plants, and Nuclear Power Plants (NPPs) in primary and secondary side of operation [2]. It causes temporal and spatial variation of wall
thickness in straight pipe and bends. It can be the source of serious damage of the units. Therefore, it is necessary to measure the wall thickness of the process units to ensure the sustainability of production and safety and environment. Radiography is a method of inspecting materials for seeing hidden flaws by using the ability of short wavelength of X-rays, gamma rays and neutrons to penetrate various materials and imaged in the film. At present, there are some Xray imaging techniques which has turned out to be one of the most valuable instruments in inspection of product content [3]. Nowadays, film usage is being replaced with imaging plate (IP) and the
Halaman | 215
Azmi et al.---------------------------------------------------------------------Prosiding Seminar Nasional APISORA 2018 technique is called computed radiography (CR). The CR system consists of ionizing radiation source, computer unit, CR scanner and phosphor imaging plate (IP). Phosphor IPs used for industrial radiography contain BaBr:Eu2+ active layer in which, after radiographic exposure, latent image is formed [4]. The X-ray CR is particularly suitable for products or welds inspensions. In addition, X-ray CR was used to evaluate pipe wall thickness [4], visualize the development of the fracture process zone in the rock samples [5], analysis of scale deposits [6], for medical pusposes [7–11], for industrial purposes [12–14]. This paper explores the use of X-ray CR to measure the thickness of metal. When penetrating through matter, radiation photons interact with matter and there will be an absorbsion. The reduction of initial radiation intensity after penetrating through matter can be expressed by Beer’s absorption law [15]:
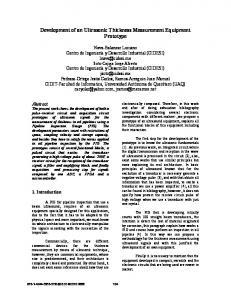
where I is the intensity of radiation transmitted through the absorber. I0 is the intensity of initial radiation. µ is linear attenuation coefficient and t is the thickness of the absorber. Therefore, material (absorber) thickness is possible to measure. MATERIALS AND METHODS To be able to measure material thickness, it is necessary to get a calibration curve between material thickness with IP blackness value. A steel step wedge was used as the standard as shown in Figure 1. It has varying thickness as shown in Table 1. The two thinnest step is not measured in this experiment. Table 1. Steel step wedges code and thickness.
Code T1 T2 T3 T4 T5 T6 T7 T8
Halaman | 216
Figure 1. Steel step wedges.
(1)
I I 0e t
No 1 2 3 4 5 6 7 8
Three steel plates were used as the samples as shown in Figure 2. The Thickness of samples (S1, S2, and S3) are 8.5 mm, 9.5 mm, and 16 mm, respectively.
Thickness (mm) 7 9 11 13.6 15.8 18.1 20.2 22.2
Figure 2. Steel plates samples, (a) S1 (t= 8.5 mm), (b) S2 (t= 9.5 mm), and (c) S3 (t= 16 mm).
The objects (steel step wedge and plates) were exposed perpendicular to the focal spot. The focal spot is always straight against the center of the imaging plate as shown in Figure 3. The interest thickness of step wedge was placed at the center of the beam. That means every thickness will be measured respectively to avoid differences in distance between the steps of the focal spot resulting in differences in radiation reception. Each sample was exposured three times in the same condition. The applied equipment and setups as shown in Table 2. The exposured imaging plate was then to be scanned using the imaging plate scanner as shown in Figure 4. The results were in 16 bit gray scale digital images format. It means the pixels vaules range is from 0 to 65535. The 0 value represents the black color while the 65535 value represents the white color. Higher pixel value means the sample was thicker.
Azmi et al.---------------------------------------------------------------------Prosiding Seminar Nasional APISORA 2018 was read with a program built in Matlab. Hence image resolution setup was 50 µm and the dimension of the IP is 10 x 24 cm2, then the coordinate of the imaging plate center is 2377:1027 as shown in Figure 6.
Figure 3. Experiments setup Table 2. The applied equipment and setup
X-ray tube Focal spot size Tube voltage SDD Exposure time Imaging plate type Imaging plate dimension Scanner Image format Scan resolution Image bit depth
Rigaku RF-300EGM2 2.5 x 2.5 mm2 130 kV 600 mm 45 s HD (Blue) 10 x 24 cm2 Durr CR 35 NDT tif 50 µm 16 bit
Figure 4. Computed radiography equipments, (a) Durr CR 35 NDT scanner and (b) Durr imaging plate
RESULTS AND DISCUSSION The first step was testing the steel step wedge as a standard. As previously described that each thickness was tested under the same conditions and the results as shown in Figure 5. The pixel value at the center of the imaging plate
Figure 5. Digital images of steel step wedge
Figure 5 shows the gradation of gray scale caused by thickness of steel step wedge. At T1 and T2, two thinnest step wedges can not be observed, white at T3 the second thinnest step wedge appeared. It might be caused of distance difference between T1 -T2 and T3 to the focal spot. T3 had the longer distance that could decrease the radiation intensity then caused the second thinnest step wedges can be observed. It is the reason why it is necessary to set the distance of interest thickness to the focal spot is constant (600 mm) then the measured pixel is at the center of the imaging plate. The values of the IP’s center pixels were then built into a graph of the relationship between pixel values and step wedge thickness as shown in Figure 7. The graph is the result of the steel step wedge (T1-T8) measurement. The trendline is polynomial order 3 with y= 10.05x3 – 693.58x2 + 15953x – 66286. The interpolation is quite good with R2= 0.9999. It is become a calibration curve for the steel samples. It was used to convert pixel values to steel thickness.
Halaman | 217
Azmi et al.---------------------------------------------------------------------Prosiding Seminar Nasional APISORA 2018
Figure 6. Pixel region of T1 digital image.
The digital images with 16 bit data range make the measurement is more sensitive. It means there are value 0 – 65535 between black colour to white color. The measurement conditions made T1 (7 mm steel step wedge thickness) center pixel value is 14135. T2 until T8 pixel value are 28270, 38807, 47545, 52428, 54741, 55769, and 56026 respectively.
Figure 8. Digital images of steel samples
Table 3. Pixel values and measured thickness of steel samples. Actual samples Code S1A S1B S1C S2A S2B S2C S3A S3B S3C
Figure 7. Pixel values versus steel thickness
The digital images of the steel samples as shown in Figure 8. They show the gradation of gray scale caused by the thickness of steel samples. The thicker steel made more white color. The steel samples pixel values and the measured thickness as shown in Table 3. The value of pixel was converted to thickness using the interpolation of the steel step wedge measurement. The first sample (S1) measurements results are 8.55, 8.59, and 8.51 mm and the mean of the thickness is 8.55 mm. If compared to the actual sample thickness (8.5 mm) there is a difference of 0.05 mm. The biggest modulus between the actual and measured thickness is 0.09 mm that in the second measurement (S1B).
Halaman | 218
Thickness (mm) 8.50 8.50 8.50 9.50 9.50 9.50 16.00 16.00 16.00
Measured image Code S1A S1B S1C S2A S2B S2C S3A S3B S3C
Pixel value 25700 25957 25443 31611 31354 31097 52428 52685 52171
Thickness (mm) 8.55 8.59 8.51 9.56 9.51 9.46 15.91 16.08 15.74
Mean (mm) 8.55 9.51 15.91
The measured thickness of the second sample (S2) are 9.56, 9.51, and 9.46 mm with the mean value of 9.51 mm. There is just 0.01 mm difference between the actual and the measured thickness. The biggest modulus is in the first measurement (S2A) which is 0,05 mm. The third sample is the thickest one (16 mm). The measured thickness results are 15.91, 16.08, and 15.74 mm. The mean value is 15.91 mm. The modulus of actual and mean thickness value is 0,09 mm. The biggest modulus is 0.26 which is in S3B measurement. The measurement results of S1, S2, and S3 samples are 8.55 mm ±0.59%, 9.51 mm ±0.10%, and 15.91 mm ±0.56% respectively. CONCLUSION The results in digital images make CR more effective and can be explored to be more
Azmi et al.---------------------------------------------------------------------Prosiding Seminar Nasional APISORA 2018 comprehensive. Digital images with 16 bit depth make the results move sensitive to material thickness. The results of experiments are accurate. The errors are quite small. It proves that X-ray CR can be used to measure the thickness of materials. Further research is necessary to get a better method and standard. ACKNOWLEDGEMENTS The authors would like to acknowledge Center for Isotopes and Radiation ApplicationBATAN who has been continuously encouraging the realization of the application of nuclear technology in the field of industry.
[8].
[9].
[10]. REFERENCES [1]. S. Sait, Y. Abbas, and F. Boubenider, “Estimation of thin metal sheets thickness using piezoelectric generated ultrasound,” Appl. Acoust., vol. 99, pp. 85–91, 2015. [2]. M. Prasad, V. Gopika, A. Sridharan, and S. Parida, “Pipe wall thickness prediction with CFD based mass transfer coefficient and degradation feedback for flow accelerated corrosion,” Prog. Nucl. Energy, vol. 107, no. July 2017, pp. 205–214, 2018. [3]. A. Bozydar Knyziak, W. Rzodkiewicz, E. Kaczorowska, and M. Derlacinski, “New Xray testing methods of aerosol products for industrial radiography,” Nucl. Instruments Methods Phys. Res. Sect. A Accel. Spectrometers, Detect. Assoc. Equip., vol. 844, no. November 2016, pp. 141–146, 2017. [4]. M. Rakvin, D. Markučic, and B. Hižman, “Evaluation of pipe wall thickness based on contrast measurement using Computed Radiography (CR),” Procedia Eng., vol. 69, pp. 1216–1224, 2014. [5]. L. Vavro, K. Souček, D. Kytýř, T. Fíla, Z. Keršner, and M. Vavro, “Visualization of the Evolution of the Fracture Process Zone in Sandstone by Transmission Computed Radiography,” Procedia Eng., vol. 191, pp. 689–696, 2017. [6]. J. P. Candeias, D. F. De Oliveira, M. J. Dos Anjos, and R. T. Lopes, “Scale analysis using X-ray microfluorescence and computed radiography,” Radiat. Phys. Chem., vol. 95, pp. 408–411, 2014. [7]. R. Behling, “Medical X-ray sources now
[11].
[12].
[13].
[14].
[15].
and for the future,” Nucl. Instruments Methods Phys. Res. Sect. A Accel. Spectrometers, Detect. Assoc. Equip., vol. 873, pp. 43–50, 2017. W. Thomlinson, H. Elleaume, L. Porra, and P. Suortti, “K-edge subtraction synchrotron X-ray imaging in bio-medical research,” Phys. Medica, vol. 49, no. May, pp. 58–76, 2018. H. Han, Y. Sharma, G. Zan, Z. Wu, S. Wang, and Y. Wu, “Preliminary research on body composition measurement using X-ray phase contrast imaging,” Phys. Medica, vol. 52, no. May, pp. 1–8, 2018. R. Behling and F. Grüner, “Diagnostic X-ray sources—present and future,” Nucl. Instruments Methods Phys. Res. Sect. A Accel. Spectrometers, Detect. Assoc. Equip., vol. 878, no. April 2017, pp. 50–57, 2018. I. J. Dempsey, M. E. Kew, J. M. Cancienne, B. C. Werner, and S. F. Brockmeier, “Utility of postoperative radiography in routine primary total shoulder arthroplasty,” J. Shoulder Elb. Surg., vol. 26, no. 7, pp. e222– e226, 2017. S. Eckel, P. Huthwaite, M. Lowe, A. Schumm, and P. Gu, “Establishment and validation of the Channelized Hotelling Model Observer for image assessment in industrial radiography,” NDT E Int., vol. 98, no. April, pp. 1–7, 2018. P. Knoblauch, V. Raspa, F. Di Lorenzo, A. Clausse, and C. Moreno, “Hard X-ray dosimetry of a plasma focus suitable for industrial radiography,” Radiat. Phys. Chem., vol. 145, no. October 2016, pp. 39– 42, 2018. K. S. Kim, S. Y. Kang, W. S. Kim, H. S. Cho, C. K. Park, D. Y. Lee, G. A. Kim, S. Y. Park, H. W. Lim, H. W. Lee, J. E. Park, D. H. Jeon, Y. H. Lim, U. K. Je, and T. H. Woo, “Improvement of radiographic visibility using an image restoration method based on a simple radiographic scattering model for x-ray nondestructive testing,” NDT E Int., vol. 98, no. May 2017, pp. 117–122, 2018. Glenn F. Knoll, Radiation Detection and Measurement, 2nd ed. John Wiley & Sons, Ltd, 2010.
Halaman | 219
Azmi et al.---------------------------------------------------------------------Prosiding Seminar Nasional APISORA 2018 -------------------------------------------------------------------------------------------------------------------------------
PERTANYAAN SAAT PRESENTASI 1. Pertanyaan (Leons Rixon (BATAN)): 1) Apa yang menyebabkan hasil ketebalan sampel secara percobaan dengan perhitungan
berbeda? Jawaban:
1) Hal tersebut dikarenakan ketidakpastian pengukuran yang didapatkan dari kondisi pengukuran, interpolasi standar, dan kestabilan mesin sinar-x Tebal sampel: s1 = 8,5 mm s2 = 9,5 mm s3 = 16 mm Pengukuran: s1 = 8,55 mm ± 0,59% s2 = 9,51 mm ± 0,10% s3 = 15,91 mm ± 0,56%
Halaman | 220