# Cellular Engineering
Measurement of sealing resistance of cell-electrode interfaces in neuronal cultures using impedance spectroscopy J. R. Buitenweg 1 W.L.C. Rutten I W.P.A. J. W. van N i e u w k a s t e e l e 1
Willems 2
1institute of Biomedical Technology, Faculty of Electrical Engineering, University of Twente, PO Box 217, 7500 AE Enschede, The Netherlands 2Netherlands Institute for Brain Research, Amsterdam, The Netherlands
Abstract--Sealing resistance is highly significant with respect to the electrical neuronelectrode contact because it decreases the stimulation threshold of neurons cultured on a planar micro-electrode array. A method is proposed for measurement of the sealing resistance using impedance spectroscopy. The effect of the sealing resistance on the total impedance spectrum of a cell-electrode interface is modelled for complete coverage of the electrode by the cell. Sensitivity analysis demonstrates that the impedance spectrum is determined by four parameters: two electrode parameters, the sealing resistance and the shunt capacitance between the lead of the electrode and the culture medium. Experimental verification of the model is performed by simultaneous measurement of the impedance spectrum and electrode coverage. A good and unique fit between the simulated and measured impedance spectra was obtained by varying the two electrode parameters and the sealing resistance. Keywords--Seating resistance, Cell-electrode interface, Neuron-electrode Cultured neurons, Multi-electrode arrays, Impedance spectroscopy
interface,
Med. Biol. Eng. Comput., 1998, 36, 630-637
1 Introduction
PLANAR SUBSTRATE, multielectrode arrays (PEAs) offer the possibility to contact neuronal cultures with a large number of cell-size electrodes. They have been explored as a tool for development of a cultured neuron-probe, a new type of neuroelectronic interface (PINE et al., 1996; RUTTEN et aL, 1997) and as a tool for long-term extracellular recording from and stimulation of cultured neuronal networks (JIMBO and KAWANA, 1992; GROSS et al., 1993; VAN PELT et al., 1996). For stimulation, as well as recording, a tight contact (electrical coupling) between a neuron and an electrode site is desired. Several techniques have been explored which may promote tight coupling, for example by chemical or mechanical surface patterning or electric field traps (CLARK et aL, 91992; BRECKENRIDGEet al., 1995; FUI-IRet aL, 1994). The goal is to cover an electrode site by a neuron as completely and tightly as possible in order to ensure a high quality neuron-electrode contact. However, methods for assessment of the quality of this contact have not been reported yet.
Correspondence should be addressed to Dr. J. R. Buitenweg; emaih
[email protected] First received 8 October 1997 and in final form 29 January 1998 9 IFMBE:1998 630
In literature, models of the neurorv-electrode contact are presented for clarification and prediction of the amplitudes and shapes of extracellular recordings. Both simulation and experimental results suggest that the signal-to-noise ratio of the recordings increases and the stimulation threshold decreases if a neuron completely covers (seals) an electrode (REGEHRe t al., 1989; GRATTAROLAand MARTINOIA, 1993; BOVE et al., 1995). Both effects are ascribed to the sealing resistance, as a high resistance would restrict the leakage current through the gap between the cell and the substrate (Fig. 1). As a consequence, sealing resistance is a major determining factor for the quality of the neurorv-electrode contact. As a first step towards assessment of the neuron-electrode contact, this paper focuses on the measurement of the sealing resistance, using impedance spectroscopy. Other investigators have already demonstrated the influence of cell growth and mobility on the impedance of electrodes covered with cells (GIAEVER and KEESE, 1984; EHRET et al., 1997). Therefore, the above mentioned models are modified to allow prediction of the current response of the cell--electrode interface to a harmonic voltage stimulus. Using the resulting model, the impedance spectrum of the cell-electrode interface is simulated. Sensitivity analysis is used for identification of the model parameters which primarily determine the impedance spectrum. Experiments were carried out to verify the model of
Medical & Biological Engineering & Computing
September 1998
the cell-electrode interface, using dissociated neurons cultured on a PEA. Simultaneous measurement of impedance spectrum and electrode coverage was performed on a large number of electrodes at several stages of culture development. It was our hypothesis that the parameters of the impedance model (including the sealing resistance) can be fitted to the measured impedance spectra and that the fitted sealing resistance is related to the electrode coverage. Fig. 2
2 Impedance model of cell-electrode interface The model of the cell-electrode interface assumes complete coverage of the electrode by a cell. This geometrical configuration and the corresponding equivalent circuit are depicted in Figs. 1 and 2. The membranes are modelled as passive RC combinations and can be computed from their areas, the unit capacitance C m and conductivity gin" In the following equations, Zpatch and Apatch denote the impedance and the area of the membrane over the electrode. Zm~r~ and Amem denote the impedance and area of the rest of the cell membrane:
Electrical equivalent circuit of the cell-electrode interface. Only passive properties are modelled. The total current through the cell-electrode interface firstly passes the electrode, modelled as Zelectrode. The current through the cell, [c~u, passes two membranes. Each membrane is modelled as a passive RC system (with Cpatch and 1/gpatch for the patch (lower membrane) and Cmem and 1/gmem for the upper membrane of the cell. The leakage current, Iseat, is restricted by the resistance of the gap, the sealing resistance Rseal. A capacitor C,h is added to account for the capacitive coupling between the lead of the electrode and the culture medium
1 Zpatch = Apatch ( i~
-1- gm)
1 Zrnem = Amem( iO)Cm -1- gin)
(1)
(2)
The current path through the gap between the bottom of the cell and the surface of the substrate (see Fig. 1) is modelled with a sealing resistance, Rs~t. As the sealing resistance increases, this current becomes more and more restricted and a larger fraction of the total current tends to flow through the cell. The electrode is modelled according to the empirically derived model of the electrode impedance used in literature (MCADAMS et al., 1995; DE BOER and VAN OOSTEROM, 1978; EHRET et al., 1997), which consists of two terms: Zelectrode = ~
K
-[- Rspread
current density in the electrolyte close to the small electrode surface. The spreading resistance, Rspread, is assumed to be negligibly small compared to the electrode-electrolyte impedance, so we take Rmre~a = 0 and therefore Zel~ctrode = X(ico) -m.
A shunt capacitance, C~h, is included in the electrical equivalent circuit, to model the capacitive coupling between the electrode leads and the culture medium: Zsh --
(4)
#nCsh
Now, the cell--electrode impedance, ZcE, consists of the electrode impedance, the sealing resistance and both the membrane impedances:
(3)
The first term represents the impedance of the electrodeelectrolyte interface, which depends on frequency, but has a constant phase angle. The second term, R~p~e~a, represents the spreading resistance of the electrode which is due to the high
1
ZCE = Zelectrode -]
Rseal(Zme m "~ Zpatch) Rseal q- gmem -3v Zpatc h
(5)
From the electrical equivalent circuit in Fig. 2, it can be seen that the impedance of the cell-electrode interface is in parallel with the shunt capacitance. Therefore, the total impedance equals Zeot~t
Z~hZcs Z~h + ZcE
(6)
Ztotat is taken as the output of the model, since it is also the
impedance to be measured in practice.
3 Methods and materials 3.1 Simulations
Fig. 1 Assumed geometric configuration of the cell-electrode interface. The cell is modelled with an upper membrane (referred to as membrane) and a lower membrane (referred to as patch), The area of the patch equals the area of the electrode. Electrical coupling between the gap and the intracellular space is not considered. Since the cell covers (seals) the electrode completely, the current through the electrode splits up into a current through the cell, Ic~m and a leakage current through the gap between the cell and the
substrate, Iseal
Medical & Biological Engineering & Computing
The total impedance of the cell-electrode interface (including the shunt capacitance), were computed for the frequency range 300 Hz to 20 kHz, and Rseal = 0 to 10 M~. Other model parameters were K = 8 x 10⁹, m = 0.90 resulting in an electrode impedance of 3.05 MY~ at 1 kHz; these values are based on the measurements, reported in this paper, in order to facilitate comparison with the experimental results, Amem =Apatc h = 115 l.tm2, C m = 1 I.tF/cm2, g m = 0"3 mS/cm2 and Csh = 13 pF.
September 1998
631
Sensitivity analysis was performed to gain insight into the influence of variations in the model parameters on the predicted impedance Ztor~l. The following measure of sensitivity was chosen S~(f) = IZ~+~(f) - Z~(f)l/IZ~(f)l
I~.~1/1,~1
(7)
with ~ a vector with model parameters, and Z?(f) the predicted impedance at frequency f with model parameter vector p. The sensitivity measure, s~(f), expresses the relative change in the predicted impedance due to a relative change in the model parameters, for a given set of model parameters and at a given frequency. A value smaller than one indicates a low sensitivity, whereas a value larger than one indicates a high sensitivity. The sensitivity of the total impedance, Ztotat, to the model parameters was computed as a function of frequency (300 Hz to 20kHz) at a range of working points of the sealing resistance (0 to 10Mf~).
3.2 Experimental verification For verification of the predicted impedance, fetal rat cortical neurons were cultured on a PEA. Simultaneous assessment of impedance spectrum and electrode coverage was performed in three measurement sessions during culture development: at 6, 10 and 15 days in vitro. The experimental set-up is addressed in more detail below. 3.2.1 Preparation o f the multielectrode plate: The starting point in the fabrication of the MEA was a square glass plate 5cm• with a 100rim thick layer of a transparent semiconductor, indium tin oxide (ITO). The ITO wires to the 61 electrodes were patterned using microposit S1813 photoresist* and an etching solution with HzO:HCI:HNO3=50:50:I (vol. %). Before application of the photoresist, the ITO plate was cleaned with HNO3 (10rain) and an O2-plasma (10min). The layout of the wiring is depicted in Fig. 3a. After patterning of the ITO wiring, a sandwich combination of silicon dioxide and silicon nitride was deposited for insulation. The first layer, formed by deposition of 100rim silicon dioxide using a plasma enhanced chemical vapour deposition (PECVD) process, was applied for egalisation of
the steps in the surface, due to the ITO wiring. The second layer of 400 nm silicon nitride was formed using the same type of process and was applied for excellent long-term electrical isolation. This way, possible porosity (causing bad isolation) of silicon dioxide in saline environments will be prevented. The third layer of I00 nm silicon-dioxide was applied for cellsurface adhesion and biocompatibility reasons. For deinsulation of the electrode tips, a SF 6 reactive ion etching (RIE) technique was used, resulting in electrodes with a diameter of 12 gm. The electrode tips were slightly platinised to reduce the electrode impedance without obstructing sealing of the electrodes by too large a 'bulb' of electroplated platinum. A computer controlled platinisation current was applied with an amplitude of 500 nA for 50 ms, followed by an amplitude of 50 nA for 40 s. The first current pulse initiated a large number of granules of condensed platinum. During the second pulse these granules grew, resulting in a 'layer' of platinum which did not exceed the height of the insulation layer, as is illustrated in Fig. 4. The resulting electrode impedance was 2 M r to 3 Mf~, which is much higher than the fraction of a megaohm that can be achieved by growing a protruding platinum 'bulb.' However, in this study it was important not to obstruct sealing of cells to electrode perimeters. 3.2.2 Culturing procedures: The cortices of El8 Wistar rat foetuses were removed and dissociated by trituration following enzymatic treatment with trypsin (RAMAKERSet al., 1991). To promote cell-surface adhesion, the dissociated neurons were plated on the PEAs coated with 201.tg/ml polyethylene-iminet, in glass rings (diameter=7mm). In total 105 cells (50 t.tl cell suspension) were plated. After l h the rings were removed and l ml of glia conditioned medium (GCM) was added. At six days in vitro, 1 ml GCM was added to the culture. 3.2.3 Impedance spectroscopy and extraction of model parameters: For the impedance measurements, a stimulus ampli-
i!... 9 9 9
~
9
Fig. 3
9
9 ~
~
9
9
9 9
9
9 9
9 ~
9
*
* ,
~
b
Fig. 4
Layout of the electrode pattern on the multielectrode arrays (MEAs), used for experimental verification of the model. (a) The layout of the connection of the wiring to the 61 electrode tips in the centre of the PEA. (b) The pattern of the electrode tips. Tip diameters = 12 btm, inter-electrode distances = 70 btm
* Shipley 632
~ ~ 9
9 9
9
9 ~
~
~ 9
9
9 ~
~
9 9
a
9 9
Scanning electron microscopy image of electrode tip (diameter=12btm). The deinsulated tip of the ITO lead is electroplated with platinum. The platinisation current consisted of a short pulse (50ms) of 500hA, immediately followed by a long pulse (40s) of 5OnA, resulting in a flat layer of platinum. The height of this layer did not exceed the height of the insulation layer. Therefore, sealing by a cell was not obstructed by the platinum
t Fluka, Buchs, Switzerland
Medical & Biological Engineering & Computing
September 1998
tude of 500 mVpw was applied and the resulting current was measured using a conventional operational amplifier currentto-voltage conversion circuit. Frequency points were chosen at 300, 500, 1000, 1700, 3000, 3800, 5000, 7000, 10000 and 20000Hz. In each of the three measurement sessions, the impedance spectra of 30 electrodes were computed afterwards from the stimulus-response measurements. An initial least squares fit of the predicted impedance spectrum to the measured impedance spectrum was performed by variation of the electrode gain factor K, the electrode phase constant m, the sealing resistance Rse~t and the shunt capacity C,h, using Simpson's optimisation rule. In these results (not reported here) the fitted values for the shunt capacitance appeared to be distributed around a mean of 13 pF with low variation. Therefore Csh = 13pF was taken as a constant, which reduces the number of parameters to be fitted.
10
-g
ik 0
of the predicted impedance to the model parameters is plotted against frequency and sealing resistance. The sensitivity of the cell-electrode impedance to variations in the electrode phase constant m is very high, especially for low frequencies. For higher frequencies, the sensitivity decreases rapidly. The
4 C ..r N
\%
\\\
3 2
O~
0
. . . . . .
2
4
6
10
re{Z}, Ms
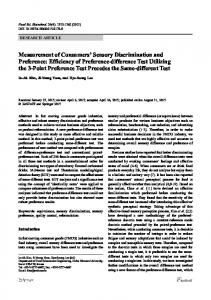
Fig. 5 Simulated impedance locus of sealing cell (without electrode and shunt capacitance), for sealing resistances of l - l OM ~ (curves from left to righO. Frequency range is 300 Hz to 20 kHz and all 1 kHz points are marked with 'x ". The locus has the form of a circular arc, which is typical for a RC system. The diameter of the are is determined by the sealing resistance, Rseal
Medical & Biological Engineering & Computing
. 4
.
. 6
8
10
J 12
)
, 2
, 4
,
re{ZcE}, MD
re{Ztotal}-, MQ
a
b
20 kHz with all 1 kHz points marked with 'x ". (a) Impedance locus of cell-electrode interface, Zce (sealing cell + electrode but without C~.a.)for seal resistances of 0-10 M ~ (curves left to righ O. When Rseat = O, the impedance locus corresponds to the locus of the electrode, Zetectroae, which is modelled as a constant phase element (most left hand curve). With an increase of the sealing resistance (in steps of 1 M~); the impedance of the sealing cell (Fig. 4) becomes visible. (b) Locus of the simulated total impedance of the cell-electrode interface (sealing cell + electrode + shunt capacitance) for the same sealing resistances as used in (a). Although the dip in the impedance locus (for Rs~,t > O) has disappeared, the influence of the sealing resistance on the impedance locus is still visible
4.1 Predicted impedance spectra
4.1.1 Sensitivity analysis: In Fig. 7, the computed sensitivity
. 2
Fig. 6 Simulated impedance loci for frequency range of 3OOHz to
4 Results
In Figs. 5 and 6, the total impedance spectrum is built up step by step from its constitute parts. First, the calculated impedance spectrum of a sealing cell is depicted as an impedance locus for sealing resistances from 1Mf~ to 10 Mf~ (Fig. 5). The loci have the form of circular arcs, typical for RC-circuits, with a radius that increases with the sealing resistance. The effect of the sealing cell is easily recognised in the impedance locus of the cell-electrode impedance, ZcE. In Fig. 6a, the locus of the system is plotted for all sealing conditions of OMfl (no sealing) to 10MfL Without sealing, no cell influences are found in the impedance locus; only the locus of the electrode impedance remains. The effect of the addition of the shunt capacitance becomes evident from a comparison of Fig. 6a to Fig. 6b. In Fig. 6b, the locus of the total impedance of the celt-electrode interface is plotted for sealing resistances of 0Mf~ to 10MfL The shunt capacitance becomes very dominant at higher frequencies, at the cost of the influence of ZcE on the total impedance.
.
sensitivities to variations in the electrode gain factor K and the shunt capacity C,.h are almost complementary: If for a certain frequency and sealing resistance, the sensitivity for variations in K is relatively high, then the sensitivity for variations in Csh is relatively low. Conversely, a relatively high sensitivity for variations in C~.h, corresponds to a relatively low sensitivity for variations in K. Apparently, somewhere in the frequency range, C~h takes over the dominant role in the total impedance. The 'transition frequency' between these two situations decreases with increasing sealing resistance. The sensitivity to variations in the sealing resistance Rseal is comparable to the sensitivities to variations in K and Csh. The maximum sensitivity is localised in the logarithmic centre of the frequency range. Except for very low sealing resistances, the sensitivity diminishes for high frequencies. Variations in membrane capacitance or membrane conductivity have a very poor influence on the total impedance, compared to the other sensitivities. In summary, the total impedance of the cell--electrode interface is mainly determined by only four parameters: the electrode--electrolyte parameters K and m, the sealing resistance Rseal and the shunt capacitance Csh. 4.1.2 Impedance measurements and model fit: The impedance loci, measured during the first session, are strongly clustered (Fig. 8). However, some of the impedance loci appear to have a substantial higher real part at the lower frequencies. The variability in this real component increases during later sessions, thereby reducing the degree of clustering. After termination of the culture and cleaning of the MEA, an additional impedance measurement is performed. The variability, as observed during the three sessions has disappeared and the original clustering is re-established. In Fig. 9, some examples are plotted of the model output, fitted to the measured impedance. The similarity with the predicted loci in Fig. 6b is ,easily recognised. Although the three measured impedance loci show large variability, the model impedance loci could be fitted very well by the
September 1998
633
Fig. 7 Sensitivity of the simulated impedance against frequency and sealing resistance to the parameters of the model. The sensitivity is expressed as the quotient of the relative change in the total impedance, Ztotal, and the causing relative change in one of the model parameters (see eqn. 6). Sensitivity to (a) electrode gain factor K, (b) electrode phase constant m, (c) sealing resistance Rseat and (f) shunt capacitance Csh is high compared to the sensitivity to (d) membrane capacitance Cm and (e) membrane resistance, I/gm~ Therefore, the impedance is mainly determined by four parameters; K, m, Rseal and Csh
Fig. 8 Impedance loci of all electrodes, measured during sessions 1 to 4for frequencies of 300 Hz (top ends of the loci), 500 Hz, 1 kHz, 1.7 kHz, 3 kHz, 3.8 kHz, 5 kHz, 7 kHz, 10 kHz and 20 kHz (bottom ends of the loci); (a) Session 1, (b) session 2, (c) session 3, (d) session 4; Most of the loci from session 1 (6 days in vitro) are clustered in a straight line, indicating a bare electrode impedance. A few impedance loci show a substantial higher real part for low frequencies, indicating sealing conditions (see Fig. 6b). The number of these loci increases during culture development ('session 2 and 3, 10 and 15 days in vitro, respectively. After termination of the culture and cleaning of the MEA, the clustering is fidly re-established, indicating bare electrodes again
selection of proper values for K, m and Rseal. The fitted parameters are listed in Table 1. The electrode parameters, K and m, show a low variability compared to the sealing resistance, Rseal. This could be expected from the predicted impedance spectra in Fig. 6b. In Table 2, the mean values and standard deviations of the fitted model parameters are listed for all measured impedance loci during each session (see Fig. 8). Note that the sealing resistance shows a high variance during the first three sessions but after termination of the culture and cleaning of the MEA (session 4) both the mean value and the variance drop to lower values. Again, a low variability of the electrode parameters K and m is observed during all sessions. The variability of the sealing resistance appears to be very high, except for the final session (session 4), after termination of the culture and cleaning of the electrode array. 4.1.3 Relation between impedance spectrum" and electrode coverage: Longitudinal observation of both the coverage and the impedance of an electrode confirms the simulated relation 634
between impedance locus and electrode coverage. In Fig. 10, the coverage and impedance of electrode 56 are depicted for all three sessions. During the first session, the electrode was covered by one or several cells and the impedance locus had a real component of 3 M r at 300 Hz. In the second session, the electrode appeared to be entirely free from cells and the real component was reduced to a normal value of 1 M r at 300 Hz. In session number three the electrode was occupied again, showing a real component of 2Mr).
5 Discussion A model has been presented for the prediction of the impedance spectrum of the cell-electrode interface. The influence- of the sealing resistance on the simulated impedance spectrum is clearly demonstrated. The conventional method for measurement of sealing resistance, using the complex impedance, Ztotal, at 1 kHz (e.g. BRECKENRIDGEet al., 1995), appears to be inaccurate here due to the high electrode
Medical & Biological Engineering & Computing
September 1998
Table 2 Fitted electrode parameters K, m and Rseat Session 1 in vitro
Session 2 in vitro
Session 3 in vitro
Session 4 terminated
5.934-1.42 0.88 5:0.04 529 5:974
6.20-t-1.74 0.89 5:0.05 337 5:454
6.945:1.61 0.90 5:0.03 517 5:557
6.475:1.39 0.89 4- 0.02 135 5:32
7
K x l0 -9 m R~e,t[kf~]
6
5
Electrode parameters K and m show relative low variances and do not significantly change during culture development.
4
(8)
Zsh'IZCE'I -- Zsh'2ZcE'2 Zsh, l "~ ZcE, 1 Zsh,2 + ZcE,2
3
2
With Zsh,i = (sCsh,i) -1 and s = ico, this can be rewritten as SCsh,ZZCE, 1ZcE,2 "Jr ZCE, I ~- SCsh,IZCE, 1ZcE,2 "Jr"ZCE,2
1
(9)
If this equation must hold for all frequencies, this implies that I
O0
2
ZCE, l = ZCE,Z
-ira{Z}, MD
(1 O)
Csh,1 = Ch,2
Fig. 9 Examples of three simulated impedance loci, fitted to measured impedance loci. Measured points of the impedance loci are plotted with ' + ' and linked with dotted lines. The impedances are simulated at the same frequencies (o) as the measured impedances and linked with solid lines9 A good fit was obtained for all three impedance loci. See Table l for fitted model parameters impedance and the shunt capacitance. This can be seen from Fig. 6b which shows that Ztot,i, is in no way linearly increasing with sealing resistance. From the sensitivity analysis it must be concluded that, apart from the sealing resistance, the electrode parameters K, m and the shunt capacity Csh are also important determining factors of the total impedance, Ztotat (Fig, 7). Furthermore, it is illustrated that a wide variety of measured impedance spectra can be successfully related to the electrode gain factor K, the electrode phase constant m and the sealing resistance Rse~t (Fig. 9 and Table 1). Finally, for both single and longitudinal observations (Fig. 10), the effect of the electrode coverage on the impedance spectrum is illustrated. With respect to the hypothesis from the introduction, if these results support the conclusion that impedance spectroscopy is a valid method for measurement of the sealing resistance then the following question arises: Is it valid to interpret the fitted model parameter Rseal, as a true estimate of the sealing resistance? The first requirement is that fitting the model to the measured impedance spectrum must result in a unique set of values for K, m and Rse,~~. If a second set of optimal values exists, the solution will loose its significance. Unicity of solution can be demonstrated by considering the impedance o f the shunt capacity and the impedance of the cell--electrode interface, Zce, in parallel. If two sets (1 and 2) of parameter values for K, m, Rse,~t and Csh result in the same total impedance spectrum, the following equation must hold:
Therefore, unicity of solution is guaranteed for the shunt capacitance. The impedance of the cell-electrode interface, has the form (compare with eqn. 3) K -+Z ZCE = - Sin2
with Z the impedance of the sealing cell. If two different sets of parameters values for K, m and Rse~,/ result in the same impedance, ZcE, at all frequencies, the following equation must hold:
Kt + ZI
sm---~
K
m
RseaI
25 35 39
7.08 X 10⁹ 6.57 • 109 6.57 x 10⁹
0.90 0.87 0.88
0.15 Mf~ 2.09 Mr2 4.79M~
Electrode parameters, K and m, are almost equal, whereas the sealing resistance varies with the real part of the impedance loci at low frequencies
Medical & Biological Engineering & Computing
Kz = ~ 2 -~- Z2
(12)
Rewriting this equation gives KI
K2
sml
sm2
- z2 - z l
(13)
It can be seen that if Z varies with frequency according to R1 sR1C + 1
Zl
Rz Z2 -- - sR2C + 1
(14)
this equation only holds for all frequencies if K 1 = K 2, m I = m 2 and R t = R 2. The impedance of a sealing cell can be written in the form of eqn. 14 by combination of eqns. 4 and 5 with Rseal,iRm
q'-
Ri =
i=l,2andR C
Table 1 Model parameters, fitte d to the measured impedance spectra, depicted in Fig. 8 Electrode
(11)
(15)
m = l/gm, and
ApatchAmem = Crn Apatch + Amem
(16)
Therefore, the constraint R 1 = R 2 implies that Rseal,1 = Rseal,2 and unicity of the solution is also guaranteed for estimation of K, m and Rseal. A second requirement for accepting the fitted Rseat as a true estimate of the sealing resistance, lies in the validity of the simplifications made in the model. The structure o f the model suggests that the cell-electrode interface consists of mutual independent entities; the electrode, the cell and the sealing
September 1998
635
session 1
session 2
session 3
7 6 C
5 4 3 2 1 0
Fig. 10
2 re{Z}, M'~
4
0
2 re{Z}, M~
4
o
re{Z}, MD
Longitudinal observation of electrode 56, illustrating the relation between electrode coverage and the impedance locus. During the first session, the electrode was covered with a number of cells. The impedance locus showed a substantial real part for low frequencies. In the second session, the electrode appeared to be entirely free from cells and the impedance locus had changed to a straight line. In session number three, the electrode was occupied again (by a macrophage) and the real part of the impedance had increased at low frequencies
Table 3 Mean values and standard deviations o f the fitted parameters K and m, computed for two different classes of sealing resistance R,eat < 300 kf2
Session 1 Session 2 Session 3 Session 4
Rseat > 300 kf2
n
K x 10-9
m
n
K x 10-9
m
24 22 17 26
6.304-0.924 6.834- 1 . 1 7 7.11 4- 1.31 6.47 4- 1.39
0.894-0.01 0.904-0.01 0.91 4-0.02 0.89 4- 0.02
5 7 12 0
4.154-2.08 4.21 4- 1.78 6.704-2.00 --
0.824-0.08 0.83 4-0.08 0.894-0.04
In the class of high sealing resistance (total electrode coverage) the variances of the estimated electrode parameters were substantial higher in comparison with the class of low sealing resistance. This indicates possible variation on the electrode parameters due to electrode coverage
resistance. No interactions between the parameters of these entities are modelled. However, it has been suggested in literature that in cases of complete coverage, the membrane of the patch (see Fig. 1) can be very close to the electrode area, which possibly affects the properties o f both the electrode and the membrane (GRATTAROLA and MARTINOIA, 1993). Because the sealing resistance seems to increase only at complete coverage o f the electrode, the possibility of influences o f complete coverage on electrode parameters can be illustrated by observation of these parameters in cases of low and high sealing resistance. In Table 3, the mean values and standard deviations o f the fitted parameters K and m are computed for two classes of electrodes: The class with Rseal 300k.Q. The former class represents all 'bare' and partially covered electrodes, and the latter class represents all electrodes that are 636
assumed to be completely covered by a sealing cell. The discrimination level of 300 kf2 is based on the maximum o f the sealing resistance, fitted in session 4. The variance in the former class is remarkably smaller than the variance in the latter class, which indicates a possible variation of the electrode parameters due to electrode coverage. Although fluctuations o f the model parameters due to electrode coverage do not necessarily imply an inaccurate estimation o f the sealing resistance, more knowledge about the principles involved in these alterations will be useful for future model correction, refinement or simplification.
Acknowledgements The authors gratefully acknowledge the help of Paula van Hulten who performed the culturing procedures and Ger Ramakers who evaluated the condition of the cultures.
Medical & Biological Engineering & C o m p u t i n g
S e p t e m b e r 1998
References DE BOER, R. W., and VAN OOSTEROM A. (1978): 'Electrical properties of platinum electrodes: impedance measurements and time domain analysis,' ivied. Biol. Eng. Comput., 16, pp. 1-I0 BOVE, M., GRATTAROLA,M., MARTINOIA,S., and VERRESCH1, G. (1995): 'Interfacing cultured neurons to planar substrate microelectrodes: characterisation of the neuron-to-microelectrode junction,' Biolectron. Chem., Bioenerg., 38, pp. 255-265 BRECKENRIDGE, L. J., WILSON, R. J. A., CONNOLLY, P., CURTIS, A. S. G., Dow, J. A. T., BLACKSHAW,S. E. and WILKINSON,C. D. W. (1995): 'Advantages of using microfabricated exracellular electrodes for in vitro neuronal recording,' J. Neurosci, 42, pp. 266-276 CLARK, P., CONNOLLY,P. and MOORES, G. R. (1992): 'Cell guidance by micropatterned adhesiveness in vitro, J. Cell. Sci., 103, pp. 287292 EHRET, R., BAUMANN,W., BRISCHWEIN,M., SCHWINDE,A., STEGBAUER, K. and WOLF, B. (1997): 'Monitoring of cellular behaviour by impedance measurements on interdigitated electrode structures,' Biosens. Bioeleetron., 12-1, pp. 29-41 FUHR, G., GLASSER, H., MUELLER, T. and SCHNELLE, TH. (1994): 'Cell manipulation and cultivation under AC electric field influence in highly conductive culture media,' Biochem. Biophys. Acta, 1201, pp. 353-360 GIAEVER, 1., and KEESE, C. R. (1984): 'Monitoring fibroblast behaviour in tissue culture with an applied electric field,' Proc. Natl. Acad. Sci. USA, 81, pp. 3761-3764 GRATTAROLA,M. and MARTINOIA,S. (1993): 'Modeling the neuronmicrotransducer junction: from extracellular to patch recording,' IEEE Trans. Biomed. Eng., 40-1, pp. 35-4l GROSS, G. W., RHOADES, B. K., REUST, D. L. and SCHWALM,F. U. (1993): 'Stimulation of monolayer networks in culture through thin-film indium-tin oxide recording electrodes,' J. Neurosc. Meth., 50, pp. 131-143. JIMBO, Y. and KAWANA, A. 1992): 'Electrical stimulation and recording from cultured neurons using a planar electrode array,' Bioelectron. Chem. Bioenerg., 29, pp. 193-204.
Medical & Biological Engineering & Computing
MCADAMS, E. T., LACKERMEIER, A., MCLAUGHLIN, J. A. and MACKEN, D. (1995): 'The linear and non-linear electrical properties of the electrode-electrolyte interface,' Biosens. Bioelectron., 10, pp. 67-74 VAN PELT, J., WOLTERS,P., VEEN, D. VANBOMER, J., RUTTEN, W. L. C., OVEROIJK, H. and RAMAKERS, G. J. A. (1996): 'Long-term multielectrode registration of neuronal firing activity from rat cerebral cortex tissue in vitro', Proc. Int. Conf. IEEE Eng. In Med. & Biol. Soe., CD-ROM PINE, J., MAHER, M., POTTER, S., TAI, Y-C, TATIC-LUCIC, S. and WRIGHT, J. (1996): 'A cultured neuron probe.' Proe. Int. Conf. IEEE Eng. In Med. & Biol. Soe., CD-ROM RAMAKERS, G. J. A., RAADSHEER,F. C., CORNER, M. A., RAMAEKERS, F. C. S. and VAN LEEUWEN,F. W. (1991): 'Development of neurons and glial cells in cerebral cortex, cultured in the presence or absence of bioelectric activity: Morphological observations,' Eur. J. Neurosei., 3, pp. 140-153 REGEHR, W. G., PINE, J., COHAN, C. S., MISCHKE,M. D. and TANK, D. W. (1989): 'Sealing cultured invertebrate neurons to embedded dish electrodes facilities long-term electrical stimulation and recording,' J. Neurosci. Meth., 30, pp. 91-106 RUTTEN, W. L. C., SMIT, J. P. A., FRIESWIJK,T. A., BIELEN, J. A. and BROUWER, A. L. H. (1997): 'Neuro-electronic interfaces: 2D and 3D multi-micro electrode systems and cultured multi electrode plates.' Proc. IFESS'97, CDROM (ISBN 0-86491-173-4-212)
Author's biography
September 1998
JAN REINOUD BUITENWEG received his MD in Electrical Engineering in 1998 at the University of Twente. He is presently working there as a PhD student in the Signals & Systems group-BME of the department of Electrical Engineering. His research interests include the characterisation and measurement of the electrical contact between cultured neurons and embedded microelectrodes.
637