MEASURING ENVIRONMENTAL ACTION AND ECONOMIC PERFORMANCE IN DEVELOPING COUNTRIES GGKP WORKING PAPER, 01|2015
GGKP Research Committee on Trade and Competitiveness
GGKP Working Paper 01|2015
Measuring Environmental Action and Economic Performance in Developing Countries GGKP Research Committee on Trade and Competitiveness May 2015
The Green Growth Knowledge Platform (GGKP) is a global partnership of leading organisations that identifies and addresses major knowledge gaps in green growth theory and practice. Established by the Global Green Growth Institute (GGGI), the Organisation for Economic Co-operation and Development (OECD), the United Nations Environment Programme (UNEP) and the World Bank, the GGKP includes over 35 partner organisations. For more information visit www.greengrowthknowledge.org.
This study received specific funding from the Government of Norway.
Copyright © UNEP, 2015 This publication may be reproduced in whole or in part and in any form for educational or non-profit purposes without special permission from the copyright holder, provided acknowledgement of the source is made. UNEP would appreciate receiving a copy of any publication that uses this publication as a source. No use of this publication may be made for resale or for any other commercial purpose whatsoever without prior permission in writing from the United Nations Environment Programme. Disclaimer The designations employed and the presentation of the material in this publication do not imply the expression of any opinion whatsoever on the part of the GGKP partners or donors concerning the legal status of any country, territory, city or area or of its authorities, or concerning delimitation of its frontiers or boundaries. Moreover, the views expressed do not necessarily represent the decision or the stated policy of the GGKP partners or donors, nor does citing of trade names or commercial processes constitute endorsement.
GGKP Working Paper 01|2015
Acknowledgements The GGKP convenes research committees on key green-growth themes to identify knowledge gaps and address them through coordinated research. Each committee is made up of experts from across the GGKP partner organisations and Advisory Committee as well as outside experts. The research committees are tasked with assessing the state of knowledge, identifying and prioritizing knowledge gaps and promoting a broader research agenda. This publication was produced through the GGKP’s Research Committee on Trade and Competitiveness. It was drafted by Serban Scrieciu under the direction of the Research Committee’s Co-Chairs, Ronald Steenblik (Organisation for Economic Co-operation and Development) and Marianne Fay (World Bank). Research committee members include: Tilman Altenburg (Deutsches Institut für Entwicklungspolitik / German Development Institute (DIE)), Ron Benioff (Low Emissions Development Strategies Global Partnership), Ann Harrison (University of Pennsylvania), Ilmi Granoff (Climate and Development Knowledge Network), Moustapha Kamal Gueye (International Labour Organisation), Danny Leipziger (Growth Dialogue), Wei Liu (United Nations Department of Economic and Social Affairs), Luciana Mermet (United Nations Development Programme), Simon Mevel (United Nations Economic Commission for Africa), Anja von Moltke (United Nations Environment Programme), Marisol Rivera Planter (Instituto Nacional de Ecología y Cambio Climático), Maryse Robert (Organization of American States), Mahesh Sugathan (International Centre for Trade and Sustainable Development) and Peter Wooders (International Institute for Sustainable Development). Additional comments were received from Silvia Albrizio, Brian Copeland, Tomasz Koźluk, Arik Levinson, Muthukumara Mani, John Maughan, Amanda McKee, Miles McKenna, Jehan Sauvage, and Benjamin Simmons.
Abstract Significant advances have been made in measuring the stringency of environmental policies, and understanding the relationship between environmental action and economic dynamics, particularly in high-income countries. Despite this, unequivocal empirical evidence on the impact of environmental policies on economic performance remains elusive, with conclusions being highly dependent on the conceptual and methodological choices with respect to defining and measuring the stringency of environmental policies. Most importantly, the literature evaluating these issues in developing countries remains sparse and robust findings are even more difficult to extract. This study reviews the existing body of work in both developed, and, where available, developing countries. It provides a comprehensive assessment of how environmental policy stringency has been measured, outlining definitional and conceptual challenges. It discusses the advantages and disadvantages of different indicators, and their usefulness for application in developing countries. In an effort to improve our understanding of the impact of environmental policy stringency in middleand low-income countries, the study draws lessons for the prioritization of future data collection and measurement efforts. Through the study, two types of stringency indicators emerge as requiring the most attention: de facto enforcement indicators and de jure explicit measures that capture the stringency of specific environmental laws, rules and regulations. While there is no “best” conceivable measure of the stringency of environmental policies, a multidimensional approach to quantifying stringency in developing countries, with a focus on explicit direct measures, is advocated. Data collection and indicator-improvement efforts need, though, to be updated periodically and supplemented by other proxies for environmental stringency.
Key words: environmental policy; stringency measures and indicators; competitiveness, productivity and growth; developed and developing countries
GGKP Working Paper 01|2015
Table of Contents 1. Introduction ............................................................................................................................. 1 2. Conceptualizing environmental policy stringency ...................................................................... 3 2.1 Definitions of environmental stringency ....................................................................................... 3 2.2 Some aspects of de facto versus de jure environmental stringency............................................. 4 2.3 Spatial considerations................................................................................................................... 5 2.4 Measurement frameworks ........................................................................................................... 5 3. Reviewing data and indicators of environmental policy stringency ............................................ 7 3.1 Policy response: Indicators measuring the stringency of policy formulation ............................. 10 3.2 Policy response: Indicators measuring the stringency of policy implementation ....................... 12 3.3 Policy impact: Indicators measuring the stringency of policy operation .................................... 14 3.4 Policy impact: Indicators measuring the stringency in relation to policy outcomes .................. 15 3.5 General composite indices of policy response and impact stringency ....................................... 17 4. An appraisal of stringency measures in relation to developing countries.................................. 18 4.1 Advantages and disadvantages of types of stringency indicators ............................................. 19 4.2 Lessons for the prioritization of future data collection and measurement efforts targeting developing countries......................................................................................................................... 24 5. Conclusion and Recommendations ......................................................................................... 26 Annex ........................................................................................................................................ 29 References................................................................................................................................. 33
Measuring Environmental Action and Economic Performance in Developing Countries
1. Introduction Since the end of the twentieth century, environmental concerns have continued to grow with the scale and diffusion of environmental problems, including forest degradation, oil spills, ozone depletion, biodiversity loss, the illegal trade of wildlife and, more recently, anthropogenic climate change. In parallel, increased globalization, the dismantling of trade barriers, transnational economic activity, international economic competition and consumer demand from various parts of the world have accelerated. This has given rise to widespread debates on the nature of the relationship between the economy and the environment. Some argue that strict environmental policies impose unnecessary administrative and compliance costs on the relative price competitiveness of targeted industries, with possible adverse implications for economic growth and jobs. Moreover, the imposition of more stringent environmental policies, particularly in the developed world, has led to concerns that investors and industries will relocate their production base to “pollution havens” in less developed countries (Copeland and Taylor 1995; Dean 1992). This is often referred to in the literature as “carbon leakage” when applied to climate change issues and the flight of carbon-intensive industries away from countries with binding greenhouse gas emissions reduction targets (World Bank 2008). Others argue that well-designed stringent environmental policy action can spur investments in cleaner technologies, innovation and output growth. This view, known as the Porter hypothesis, shifts attention from pollution control to resource productivity, and emphasizes innovation-based solutions that promote both environmentalism and industrial competitiveness (Porter and van der Linde 1995: 116). There is some empirical evidence in the literature sustaining this positive relationship between environmental policies and economic performance. This particularly holds in its weak form, whereby environmental regulation triggers innovation (e.g. Brunnermeier and Cohen 2003; Horbach 2008), but not necessarily sufficiently to boost, in its strong version, firm competitiveness. That being said, some evidence of the strong form is found in the literature, including in Albrizio and Koźluk (2014) for short-term industry-level productivity growth in OECD countries; Berman and Bui (2001) for Los Angeles refineries; Alpay et al. (2002) for the Mexican food-processing industry; and an ILO (2012) study arguing that greening investment and policies at the global level could be more resource productive and trigger net job gains relative to business-as-usual. There is also some evidence showing that environmental policies in a country may spur innovative responses elsewhere, such as the response from Japanese and German vehicle manufacturers to US vehicle emissions regulations (Lanjouw and Mody 1996). In broader terms, with the emergence of globalized value chains, it is increasingly important to link national regulatory stringency with impacts that go beyond the same national jurisdiction, such as overseas investment or the export performance or competitiveness of main trading partners. For instance, China has been reported to be increasing its overseas investments in solar and wind energy generation, concentrated in a few developed countries, such as the United States and Germany (Tan et al. 2013). Generalized empirical findings on whether modern, strict environmental policies hinder, encourage, or have no effect at all on businesses at home or abroad remain nonetheless elusive. Put differently, existing evidence is conflicting and many studies are fragile and context specific when assessing the relationship between the stringency of environmental policies and economic dynamics (e.g. Koźluk and Zipperer 2014; Brunel and Levinson 2013). Current thinking is moving away from the debate on whether environmental policies hinder or foster competitiveness. Rather, it focuses on how policy interventions in the area of environmental and 1
GGKP Working Paper 01|2015
climate protection could be shaped so that they steer economic growth pathways in more sustainable and cleaner directions. This is particularly relevant for lower-income and emerging economies, which find themselves grappling with the urgency of increasing living standards, while addressing their challenging social and environmental problems, often compounded by high population growth pressures. Studies investigating how environmental policies could impact economic dynamics have largely examined developed economies, whereas the corresponding body of literature focusing on developing economies is relatively thin. This is partly due to low data availability for developing countries, but also partly because environmental action in these economies is, grosso modo, weaker than that pertaining to their more developed counterparts. Why the latter may be the case could be attributed to lower economic and financial capacity (e.g. Guidotti 2011), weaker institutions (e.g. OECD 2012) or more widespread corruption (as empirically demonstrated in Welsch 2004 or Pellegrini and Gerlagh 2006). The choice of stringency measures and how the stringency of environmental policies is defined, measured and methodologically evaluated have been shown to have a significant influence on the results of the research (e.g. Mulatu et al. 2001; Jeppesen et al. 2002; Cagatay and Mihci 2006; Levinson 2008; Carraro et al. 2010; de Santis 2011; Brunel and Levinson 2013). For example, newer studies using panel data and employing more advanced econometric techniques have found statistically significant and reasonably sizeable effects of environmental regulations on competitiveness and industry location (e.g. Levinson 2008; Harris et al. 2003). However, panel data imply a greater availability of relevant data across space and time, a requirement that is more difficult to meet in developing countries. The current study commissioned by the Green Growth Knowledge Platform (GGKP) identifies data and knowledge gaps in relation to understanding and quantifying environmental policy stringency, with particular reference to developing non-OECD economies.1 It provides a comprehensive assessment of how environmental policy stringency has been measured and captured through the use of indicators. It also looks to draw useful lessons from the existing literature for future data collection and measurement efforts that would target the relationship between environmental policy stringency and economic dynamics in developing countries. More specifically, it provides the groundwork for the GGKP to catalyse this future research agenda, and contributes to capacity building in the area of understanding and evaluating the effects of green growth policies in developing economies. An important caveat to be made is that the choice of regulatory approach or mix of environmental policy instruments is also crucial in influencing policy effectiveness and impacts. There is some evidence that market-based flexible instruments, such as emission taxes or tradable allowances, are more likely to spur innovation relative to traditional technologically based standards (e.g. Koźluk and Zipperer 2014). In other words, it is acknowledged that the form of government intervention could also affect, in addition to the extent of governmental environmental action, firms’ decision-making and environmental outcomes. The role that broader environmental policy portfolio mixes or strategies may have on green growth is beyond the scope of this study. However, the relationship between the form of government intervention and the strictness of environmental policies is briefly discussed below. 1
The Green Growth Knowledge Platform (GGKP), launched in January 2012, is a partnership involving over 35 leading international organizations, research institutes and think tanks. It aims to collaboratively identify knowledge gaps in green growth theory and practice, catalyse knowledge generation to address these gaps, and share and disseminate green growth knowledge. The Trade and Competitiveness Research Committee, one of the four pilot committees of the GGKP, has initiated the work underpinning this study and the subsequent call for proposal. More information on the GGKP at: http://www.greengrowthknowledge.org.
2
Measuring Environmental Action and Economic Performance in Developing Countries
The following section focuses on definitional and conceptual matters pertaining to the strictness of a country’s environmental policy regime. It proposes a classification of stringency indicators to facilitate the review of an extensive literature in this area of research. Section 3 discusses in detail the types of indicators measuring environmental policy stringency that have been deployed in the literature. Studies discussing both developed countries and, where available, developing economies are reviewed. Section 4 assesses main advantages and disadvantages in relation to these types of stringency indicators. It also draws lessons for the prioritization of future data collection and measurement efforts targeting developing countries. Section 5 offers recommendations and insights into evaluating interactions between environmental policy stringency and economic dynamics in developing countries.
2. Conceptualizing environmental policy stringency Environmental policies are extremely varied and complex and the nature of their stringency is multidimensional and subject to intense debate. Before reviewing types of stringency indicators used in the literature, it is important to understand first how “stringency” may be defined and conceptualized.
2.1 Definitions of environmental stringency There is no unique definition of the concept of environmental policy stringency (EPS) or a commonly agreed theoretical construct of the term. On the contrary, a range of definitions and conceptualizations populate the relevant literature. Defining stringency is partly linked to views on the impact of environmental policies on the economy, i.e. whether it induces a burden on industry or whether it fosters innovation. Environmental stringency may also relate to the different stages of the policy process from formulation to implementation, enforcement and operation. EPS is sometimes defined through the lens of compliance costs incurred in response to measures, such as product norms, regulations and emission charges, imposed by regulators (Jeppesen et al. 2002). These costs may take many forms, such as environmental fees or taxes, permitting costs, regulatory delays, emissions limits that require installation of costly technology, the threat of lawsuits, product or process redesign, and forgone output (Levinson 2008).From this perspective, environmental policies are typically regarded as imposing sizeable compliance costs or policy sticks EPS may also be defined according to the degree of innovation it is able to foster. In other words, the level of compliance burden may go hand-in-hand with the degree of compliance innovation and this may vary from “moving-target regulations” to “disruptive regulations” (Stewart 2010). In the former, stringency increases gradually over time and encourages at the most incremental innovation, whereas the latter implies a substantial sudden increase in compliance and has the potential to result in more radical innovation. The concept of environmental stringency has also been applied to different aspects of the policymaking process. Narrow definitions of EPS tend to emphasize the incidence and coverage of legislation or implementing measures (e.g. number, severity and coverage of environmental regulations targeting an environmentally-sensitive industry or count of enforcement actions). They are sometimes referred to in the literature as “explicit” EPS measures and constitute a more direct interpretation or conceptualization of stringency. Since these are often context-dependent, they are more appropriate for the analysis of stringency levels within countries, although in some cases they also allow for cross-country analyses. Other, more comprehensive definitions of stringency have been deployed in the literature to deal with the growing multidimensional nature of environmental policies. For instance, EPS may be more
3
GGKP Working Paper 01|2015
comprehensively defined to cover the overall stringency of the environmental policy-making process, including, for instance, the standards imposed, enforcement mechanisms, and the associated institutions that directly affect pollution control and natural-resource management (Esty and Porter 2002). This broader conceptualization of EPS results in indicators that more readily lend themselves to cross-country comparisons relative to more explicit or direct definitions of stringency. Alternatively, stringency may be conceptualized even more generally to include both environmental policies and the observed impacts these are having on the environment, the economy and society. Such wide definitions of stringency encourage cross-country comparisons and usually employ highly aggregate measures in terms of general composite indices. They often include the severity or depth of government intervention across a range of key environmental issues and economic sectors.
2.2 Some aspects of de facto versus de jure environmental stringency A further important aspect for understanding, defining and conceptualizing EPS relates to the differentiation between de facto and de jure considerations. Both de jure and de facto aspects are critical to understanding a country’s willingness to tackle its environmental problems. De jure policy stringency primarily targets ex-ante dimensions of decision-making, largely in terms of the issuance of environmental legislation and the establishment of policy instruments to be activated. Focusing exclusively on certain de jure environmental measures (e.g. legislated levels of emission standards for a given industry), however, does not take into account the degree of actual regulatory enforcement, which can result in biased estimates (Carraro et al. 2010). Environmental policies in low- and middle-income economies may look good on paper, though they often face significant structural and institutional barriers when applied in practice. In contrast, de facto stringency takes into account ex-post aspects, once legislation has been passed and policies or measures have been issued. This includes the strictness of public enforcement, the extent to which industry responds to public policy and, in effect, controls pollution, as well as the overall policy effectiveness and resulting environmental outcomes. Enforcement actions can range from making warning telephone calls to levying fines. It is currently evolving in more advanced economies by augmenting monetary sanctions (enforcement “with teeth”) with softer tactics or more friendly advisory forms of enforcement involving cooperation (Shimshack and Ward 2005). Both de jure and de facto aspects are critical to understanding a country’s willingness to tackle its environmental problems. For instance, when international trade pressures are high and political constraints are low, both developed and developing governments tend to respond by de facto changes and reducing the level of enforcement of existing environmental regulations (Cao and Prakash 2012). This is because environmental groups are more likely to oppose the re-writing of legislation to render it weaker (de jure policy changes) than notice reductions in enforcement. These may be translated in practice through changes in enforcement budgets, reform of the penalties, and non-compliance fines or the adoption of administrative policies, all affecting overall stringency and environmental-policy outcomes (Cao and Prakash 2012). The literature puts forward conceptualizations and measurements of stringency targeting various phases of the environmental policy-making process. In broad terms, these may refer to either de jure aspects or to de facto considerations, or to both. Both de jure and de facto aspects are critical to understanding a country’s willingness to tackle its environmental problems.
4
Measuring Environmental Action and Economic Performance in Developing Countries
2.3 Spatial considerations Conceptualizing environmental stringency is also dependent on the type of pollution source covered by policies, particularly the distinction between point source and non-point source pollution. These are also sometimes referred to, respectively, as stationary and mobile sources. The former typically relates to large manufacturing and electric power plants, and the latter to the operation of motorized transport, construction and farm equipment, emissions from individual homes, and the consequences of land use (ERG 2001). The literature exploring the relationship between environmental stringency and the economy, in both developed and developing countries, typically relates to point source industrial pollution, and less to diffuse environmental degradation. Nonpoint source pollution, such as watershed agricultural pollution or the discharge of human sewage from diffuse sources, is comparably more difficult to measure, monitor and regulate in lower-income countries with low data availability (Hranova 2006). A further distinction with reference to the type of pollution source targeted by environmental policies concerns “new” versus “old” sources of pollution. An example often cited pertains to the US Clean Air Act, which prescribes new-source environmental performance standards that are “grandfathered” or “vintage-differentiated”. This means that regulations for new sources of pollution are often more stringent than those applied to existing sources, resulting in disincentives for new development of clean technologies. Measuring stringency on the basis of new-source performance standards, therefore, may make jurisdictions that apply laxer regulations to existing emitters appear more stringent than they actually are (Brunel and Levinson 2013). Environmental stringency, as well as the policies themselves, may also differ substantially within the boundaries of a given country. A particular set of nation-wide environmental regulations may be, in practice, more stringent for certain regions, cities or even plants. There may also be wide intracountry variations in implementing and enforcing environmental policies. For instance, although the US Clean Air Act imposes the same standards for six criteria pollutants across the country, for individual counties these emission requirements may translate into stricter or more lax restrictions. This may be attributed to different interactions between climatic conditions and pollutants across space or to differences in the industrial composition. Evidence of strong discrepancies across local jurisdictions has also been found for large developing countries, such as China (OECD 2006). As a result, the smaller the geographical coverage, the easier it may be to identify the influence of environmental policy, since other location factors affecting economic dynamics may vary less with the increase in geographical resolution (Jeppesen et al. 2002). It is therefore important to investigate intra-country variations in stringency levels, particularly for geographically large middle-income countries.
2.4 Measurement frameworks In addition to data-collection shortcomings, there are several methodological challenges in measuring EPS, which may be grouped into three biases: simultaneity, industrial composition and capital vintage (Brunel and Levinson 2013). Simultaneity concerns the circular causality between measures of policy stringency and the consequences these are perceived to have. Industrial composition refers to the specialization of countries in the production and export of certain products that might depend on stringency, but also on other non-measureable sources of comparative advantage correlated with stringency.
5
GGKP Working Paper 01|2015
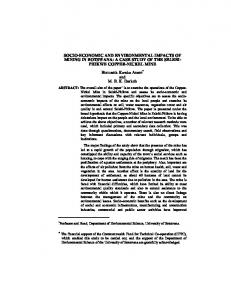
Vintage relates to the perverse effects that stricter policies for new relative to existing sources may have on environmental outcomes and perceived stringency. Although these biases are increasingly addressed in the literature, through various econometric or statistical techniques (among other approaches), an additional challenge to measuring EPS pertains to its multidimensional nature. A common problem in empirical research is that there is no unique measure of the strictness of environmental policies, meaning that no measure of stringency is perfect and all encompassing (Carraro et al. 2010). There are studies, however, that have attempted to summarize, group, and more comprehensively and assess the various dimensions of EPS measures. However, these are relatively scarce. Some have chosen to group stringency indicators into those that consider both the state of environmental problems and their policy responses on the one hand, and measures that “quantify the various types of pollution into an aggregate index” on the other (e.g. Cagatay and Mihci 2006). Other studies assess the range of EPS indicators based on the methods used to measure strictness, such as the recent work of Brunel and Levinson (2013) and of Botta and Koźluk (2014). The latter distinguishes between EPS measures that: assume to directly observe elements of environmental regulations; focus on implicit stringency through the measurement of perceived regulations and the use of surveys; evaluate changes in agents’ behavior and employ shadow prices for environmental inputs; or assess changes in environmental performance outcomes. Figure 1 puts forward a conceptual framework for categorizing and more systematically describing the various environmental stringency measures utilized in the literature. This approach is associated with a stylized description of the sequence of actions shaping policy-making, drawing on Krutilla and Krause (2011) and Krutilla (1999), who applied their environmental-policy analysis to the issue of transaction costs. More specifically, one may distinguish between stringency aspects across three different policy stages: Policy formulation, when the stringency of the environmental legislation deliberated, decided and enacted or adopted is considered Policy implementation, when the depth and coverage of regulations, instruments, guidelines and enforcement actions developed to implement the enacted legislation are taken into account2 Policy operation, when the stringency of the collective responses to the policy mandates or incentives created is referred to. This relates to the abatement expenditures that the affected economic operators incur, as they operationalize the policy
2
For added clarity of this study, the second phase of policy implementation includes public or government monitoring and enforcement action, whereas the third phase of policy operation relates only to abatement efforts, unlike in Krutilla and Krause (2011) or Krutilla (1999), who include enforcement in addition to abatement in the third phase of policy operation.
6
Measuring Environmental Action and Economic Performance in Developing Countries
Figure 1. A framework for conceptualizing and measuring environmental policy stringency
Source: Author’s own elaboration partly drawing on Krutilla and Krause (2011) and Krutilla (1999).
Although delineating boundaries between policy-making stages is a somewhat arbitrary choice (Krutilla and Krause 2011), this may offer a helpful framework for analysis, particularly when applied to developing countries, where issues of lax formal enforcement often play a greater role than in developed economies. In Figure 1, the stringency associated with the policy formulation and implementation stages are referred to as policy response stringency measures. Stringency associated with the policy operation stage and stringency associated with policy outcomes, in terms of overall impacts on environmental performance, the economy and society, are referred to as policy impact stringency measures. It should be noted that policy response stringency measures are sometimes combined with policy impact stringency measures in the literature, resulting in general composite measures of stringency. The following section discusses in detail the stringency indicators used in the literature under each of the categories outlined in Figure 1.
3. Reviewing data and indicators of environmental policy stringency As noted in the previous section, it is neither currently feasible nor desirable to have a universal or unique index measuring the stringency of environmental policy regimes given definitional and spatial challenges. As such, a wide range of indicators have been used in the literature to measure EPS. More direct EPS indicators focus on specific legislative and implementation issues characteristic to a particular national or sub-national jurisdiction, and in relation to given contextualized environmental issues. These are, in general, less suitable for meaningful cross-country comparisons. Less direct measures tend to refer, instead, to policy impacts, outcomes or highly aggregated composite indices that involve wider definitions or conceptualizations of stringency. They are better
7
GGKP Working Paper 01|2015
suited to cross-country comparison studies. EPS indicators have emerged especially in relation to developed countries, particularly the United States3, for which data sources are relatively more reliable, richer and go back further in time than data on lower-income economies.4 To provide a more systematic and clear discussion of the multidimensional nature of environmental stringency measures, this review maps the various EPS indicators used in more than 60 studies, out of which a third include developing countries in their analysis, against the conceptual framework presented above in Figure 1 relating to the main stages of the policy-making process. An initial mapping is presented in Table 1 below and categorizes the indicators around the following three broad groups taken from Figure 1 above: I.
Indicators measuring the stringency of environmental policy responses
II.
Indicators relating to the resulting policy impacts of abatement efforts, and, more generally, on the economy, environment and society
III.
General composite indicators often combining both policy response and impact dimensions
These three groups are further divided in Table 1 into five main categories and nine specific types of stringency indicators. The five main categories of indicators, which are reflected as grey circles in Figure 1, are: policy formulation stringency; policy implementation stringency; policy operation stringency; environmental stringency relating to policy outcomes; and general composite indices. The mapping in Table 1 is followed by a detailed analysis of the five categories of stringency indicators.
3
Box 1 in the Annex provides some examples of the data sources underpinning commonly deployed EPS proxies for the United States with a strong track record in data collection. 4
This is not to say that other studies measuring environmental policy stringency applied in other countries and not written in English do not exist. However, having in mind the good data availability and long experience with environmental policymaking in the United States, it is relatively safe to claim that these predominate in the literature. Studies written in languages other than English did not fall within the scope of this paper.
8
Measuring Environmental Action and Economic Performance in Developing Countries
Table 1: Indicators measuring environmental policy stringency used in the literature and categorized based on decision-making stage criteria
I. POLICY RESPONSE INDICATORS
Stringency Indicators Relating to Policy Formulation
Stringency Indicators Relating to Policy Implementation
Stringency Indicators Relating to Policy Operation
III. GENERAL COMPOSITE INDICES
2) Measures of international environmental cooperation, such as counts or dummies for membership of multilateral environmental agreements (e.g. Neumayer 2002*, de Santis 2011, de Vries & Withagen 2005, Damania et al. 2003, Cao & Prakash 2012*) 3) Perception-based indicators building on surveys, interviews and questionnaires (e.g. WEF 2013*, Madhoo 2013*, Horbach 2008, indices developed by NGOs such as Conservation Foundation Index & the Green Index for the US mentioned in Levinson 2000)
(Primary measures)
II. POLICY IMPACT INDICATORS
1) The presence or applicability of particular environmental legislation captured through the use of dummies, counts or continuous variables (e.g. Greenstone and Hanna 2014*, Hering and Poncet 2014*, Greenstone et al. 2012, Alberini 2001, Berman & Bui 2001, Hascic et al. 2009, Cao & Prakash 2012), or through the use of qualitative descriptors of environmental legislative frameworks (e.g. Taylor et al. 2003, Popp 2006)
Stringency Indicators Relating to Policy Outcomes
4) The presence, incidence and coverage of environmental policy instruments through the use of continuous variables where applicable (Rassier & Earnhart 2010, Fischer & Newell 2008, Barker & Scrieciu 2010, Johnstone et al. 2010, Dechezleprêtre et al. 2012*), the use of composite indices aggregating policy instruments (e.g. Botta and Koźluk 2014), or the use of dummies to capture the presence of particular environmental policy instruments (e.g. Popp 2010, Johnstone et al. 2010) 5) Enforcement measures, such as number of inspection visits (e.g. Brunnermeier & Cohen 2003, Husted and Logsdon 1997), count of formal notices, sanctions and other enforcement actions (e.g. Gray & Shadbegian 1993, OECD 2006*), dummies and magnitude variables for fines and other direct economic sanctions (e.g. Shimshack & Ward 2005, OECD 2006*), perception-based indicators (e.g. WEF 2013*) 6) Abatement expenditures, such as public R&D expenditures (Damania et al. 2003), private abatement or pollution control expenditures (e.g. Hamamoto 2006, Levinson 2000, Jaffe & Palmer 1997, Gray & Shadbegian 1993, Ederington & Minier 2003, Brunnermeier & Cohen 2003, Dincer & Fredriksson 2013), or total public and private pollution abatement expenditures (e.g. Lanjouw & Mody 1996, Caporale et al. 2010) 7) Individual or composite environmental performance measures, such as SO2 emissions or biochemical oxygen demand (e.g. Cao & Prakash 2012*), effluent intensity of output (e.g. Dessus et al. 1994), emission intensity (e.g. Brunel & Levinson 2013), the prevalence of landfilling for solid waste or the extent to which wastewater is treated before release into water bodies (e.g. Sauvage 2014), or aggregate environmental performance indices (e.g. Van Beers and van der Bergh 1997, Wackernagel et al. 2002 or the Environmental Performance Index, EPI in Emerson et al. 2012*) 8) Socioeconomic-related instrumental variables, such as population density or infant mortality (e.g. Xing & Kolstad 2002*), GPP and industrial output structure (e.g. de Vries & Withagen 2005), changes in water prices (e.g. Larson et al. 2002)*, changes in production or trade patterns of environmentally sensitive goods (e.g. Ratnayake 1998)
9) Aggregate indices of policy response and impact measures, such as indices aggregating across the policy formulation and implementation phases, e.g. the Environmental stringency index, ENSTR (Isik 2004), the Environmental Regulatory Regime Index, ERRI (Esty and Porter 2002*), or the World Bank’s perception-based Country Policy and Institutional Assessment Index (e.g. as deployed in Fredriksson et al. 2006*), or aggregates incorporating both policy response and impact indicators, e.g. Walter and Ugelow (1979),* Tobey (1990)*, the Environmental Policy and Performance Indices, EPPI in Dasgupta et al. (1995)*, Eliste and Fredriksson (2002)*, Xu (2000)* or Pellegrini and Gerlagh (2006)*, the Index of Environmental Sensitivity Performance, IESP in Cagatay and Michi (2006)*, or the Environmental Sustainability Index, ESI in Esty et al. (2005)*
Note: Studies marked with * include non-OECD developing countries in their analysis. 9
GGKP Working Paper 01|2015
3.1 Policy response: Indicators measuring the stringency of policy formulation The presence of particular environmental laws, rules and regulations are typically captured through the use of dummy variables5, often in combination with count variables referring, for instance, to the number of regulations in effect for a particular jurisdiction or the extent of coverage of stricter environmental regulations. These can be applied both within a given country and across countries, although the former type of studies tends to predominate. Examples of intra-country studies include Greenstone and Hanna (2014) for India, Hering and Poncet (2014) for China, and Greenstone et al. (2012) for the United States. These studies constructed detailed intra-country panel data sets, combining counts with dummy variables in their deployment of econometric approaches to linking environmental regulations with environmental, economic and social outcomes. A rich, arguably the most-comprehensive, developing country data set was assembled in Greenstone and Hanna (2014) for India’s anti-pollution laws in the area of air and water at the city level. A city level panel database is also deployed in Hering and Poncet (2014), who examined the impact of stricter environmental policies constraining sulfur-dioxide emissions in China on sectoral exports in target cities. The authors combine dummy variables for the cities being targeted by the policy and continuous variables reflecting the exposure of various sectors to the stricter environmental regulations (e.g. the ratio of coal consumption to value added for targeted sectors). Greenstone et al. (2012) also compiled their own information-rich panel data set, but with the aim of capturing variations in the applicability of environmental laws across counties and manufacturing plants for the United States. They capture de jure environmental regulations through the use of dummy variables, e.g. a county is assigned a value of 1 if pollution-intensive plants are not in attainment for a certain pollutant in a given year, and 0 otherwise. These dummy variables, as a measure of environmental stringency, are able to portray, to some extent, the regional and industry variation that the US Congress imposed when issuing the Clean Air Act Amendments legislation. Dummy and count variables (number of regulations in effect) were also employed in Alberini (2001) and, respectively, Berman and Bui (2001). They, too, focused on US regulations, but targeted petroleum and storage tanks for hazardous substances, in the former study, and California’s petroleum refining industry, in the latter. In addition, the latter study derived stringency data from regulatory documents and interviews with regulators, enabling a more explicit approach to measuring EPS. Cross-country data on de jure regulatory stringency are rarely available or are difficult to measure and quantify. Dummy variables are also often used in cross-country comparison studies, when sufficient information on de jure environmental legislation is made available. Examples include Hascic et al. (2009), who discussed emission standards for vehicles and on-board diagnostic systems in order to investigate the effects of environmental policy on innovation in the industry in a number of OECD countries. Emission standards may be regarded in this case as pertaining to the policy formulation phase. That is because they are specified during the stage of deliberating and deciding the environmental legislative framework (for example, the 1992 Clean Air Act Amendments established vehicular tailpipe emissions standards; see Hahn and Tetlock 2008). These environmental regulations in the automobile sector were captured through a vector of dummy variables, e.g. a dummy value of 1 was assigned to emission standards in Japan from 2000 and 0 otherwise. 5
Dummy variables are artificial variables used in empirical (regression or econometric) analyses to numerically represent attributes (or qualitative information) and sort data into mutually exclusive categories. They are binary variables and take the value of 0 or 1 to indicate the absence or presence of a categorical effect (e.g. environmental regulation) that may shift the outcome.
10
Measuring Environmental Action and Economic Performance in Developing Countries
Dummy variables are important for controlling for the effect of having a particular environmental regulation in place. These need, though, to be combined with a variable for the allowable level of regulated pollutant to control for the effect of more stringent regulatory levels conditional on facing the corresponding type of regulation (Popp 2010). Another study that combined counts and dummies for capturing de jure policy formulation stringency is that of Cao and Prakash (2012). The authors obtained their information from the ENVIPOLCON database recording domestic environmental policies and regulations for 24 EU countries across different points in time. Qualitative descriptions or assessments are also deployed in some cases to explicitly portray the stringency of the regulatory framework of a particular country. For example, Taylor et al. (2003) adopted such an approach to examine the relationship between environmental control and technological innovation in the case of SO2 emissions from coal-fired power plants in the United States. The authors used expert elicitations and extensive interview techniques in order to explicitly capture and describe the impact of the main US regulatory action related to SO2 control on inventive activity (i.e. patent data), finding a positive relationship between the two. Specific variations in regulatory stringency applied to NOX and SO2 emissions from coal-fired power plants since late 1960s and across three developed countries (Germany, Japan and the United States) were also more directly observed and qualitatively described in Popp (2006). The author then linked the observed variations in regulations over time and jurisdictions with patent data for NOX and SO2 emission abatement devices. The study finds that patent numbers increase after the passage of stricter regulations. A specific unidimensional measure employed, at times, in the literature evaluating the de jure stringency of environmental legislation across countries relates to international treaty commitment or membership in environmental organizations, typically quantified through the use of dummy variables. Examples include Neumayer (2002) and Cao and Prakash (2012), who used multilateral environmental agreements (MEAs) or international treaty commitment as proxies for de jure domestic regulatory stringency in their empirical investigations.6 Other examples refer to de Santis (2011), de Vries and Withagen (2005) and Damania et al. (2003), who also used MEA membership as an EPS proxy applied to developed economies. Perception-based indicators are often employed in the literature to capture in aggregate the perceived strictness of a country’s environmental legislative framework. These measures are typically better suited for cross-country comparisons and fare well on the time dimension. An example is Horbach (2008), who drew on data sourced from a firm-level opinion survey covering the German manufacturing and service sector (the Mannheim innovation panel) to investigate the impact of regulatory measures on innovation. Several perception-based indicators or composite indices have also been developed by environmental organizations in the United States through a mix of methods, including interviews, surveys and the aggregation of already available environmental policy and performance data. These assess the degree of environmental regulatory efforts across US states on a given scale and rank them accordingly, such as the Conservation Foundation Index, the Fund for Renewable Energy and Environment Index, or the Green Index mentioned in Levinson (2000).
6
Related environmental commitment proxies employed in Neumayer (2002) are: membership in environmental intergovernmental organizations (EIOs), measured in terms of counts of EIOs in which the country is a member; the existence of a national council for sustainable development (measured through dummies); the extent to which reporting requirements linked to certain MEAs are met (measured through percentage of requirements met); the percentage of a country’s land area under protection status; and the availability of environmentally related information of a country (measured through a country’s number of variables forming the Environmental Sustainability Index (ESI) put forward by the World Economic Forum, 2001).
11
GGKP Working Paper 01|2015
A frequently referenced perception-based indicator applicable across many countries is provided in the World Economic Forum’s Executive Opinion Survey on environmental regulatory regimes.7 The index reflects the perceived rigor of a nation’s air pollution, water pollution, toxic waste and chemical regulations (Esty and Porter 2002: 86). The World Economic Forum results have been used in several studies to examine the relationship between environmental strictness and economic performance, e.g. in Kalamova and Johnstone (2011), Busse and Silberberger (2013) and in Madhoo (2013), the latter having examined the political economy of environmental regulation and effectiveness in the Small Island Developing States.
3.2 Policy response: Indicators measuring the stringency of policy implementation The stringency of environmental policies may also refer to the stage when policy instruments and enforcement measures are agreed upon in order to implement the issued environmental legal frameworks. The policy implementation phase relates to the severity, in terms of incidence and coverage, of various types of policy instruments, as well as to the stringency of specific enforcement measures that regulating authorities decide to pursue. There is, however, considerable overlap between the policy formulation and implementation phases, since, in several cases, direct regulatory standards are embedded in legislation. For example, the United States Clean Air Act (CAA) amendments, issued in 1991, embedded specific requirements on tailpipe emissions from vehicles directly in the law (Hahn and Tetlock 2008). Similarly, Bolivia and other Latin American countries have legislated national ambient air-quality standards in air pollution (Green & Sánchez 2013). There is a large body of literature concerned with the effectiveness and efficiency impacts of introducing various environmental policy instruments or modifying their incidence and coverage. These may refer to environmental performance-based or technology-based standards, pollution taxes, tradable certificates, environmental subsidies, R&D support, or other regulatory and pricing mechanisms, particularly in the area of climate change mitigation. Environmental stringency measured through the use of environmental standards is discussed, for instance, in Rassier and Earnhart (2010) and Dechezleprêtre et al. (2012). The former focused on direct regulatory performance-based standards, in terms of discharged wastewater limits imposed on US chemical manufacturing firms for two pollutant indicators, biological oxygen demand and total suspended solids. The latter discussed maximum permissible levels of tailpipe emissions of key pollutants from new passenger car vehicles (i.e. the EURO emission standards) that are applied in developed and developing economies. The climate change economics literature also abounds in evaluating the stringency of mitigation policy instruments and their resulting impacts on the economy. Examples here may refer to renewable-energy portfolio standards and emission standards for the US electricity sector, as in Fischer and Newell (2008), and to changes in overall climate change mitigation targets and their resulting macroeconomic effects across the globe, as in Barker and Scrieciu (2010). As is the case noted above in the formulation of policy instruments, dummy variables are also often employed in the literature when measuring the stringency of environmental policy implementation. Examples include the use of dummies to capture regulatory action targeting NOX emissions from coal-fired electric power plants across the United States, as in Popp (2010), or the stringency of renewable energy policies that are heterogeneous across high-income countries 7
The World Economic Forum survey constitutes one of the most cited, longest running and most extensive high-quality databases. It currently covers almost 150 countries and captures the insights of more than 13,000 executives, including respondents’ opinions or perceptions about the stringency of environmental policies in a given country and the degree of enforcement. Respondents are asked to rate the level of environmental regulatory stringency or enforcement across countries from 1 (very lax) to 7 (among the world’s most stringent or best-perceived environmental legislation).
12
Measuring Environmental Action and Economic Performance in Developing Countries
(e.g. tax measures and voluntary programmes), as in Johnstone et al. (2010). The latter also employed continuous variables for capturing the stringency of more homogeneous types of measures, more specifically for R&D expenditures, feed-in tariffs for renewable energy-based power plants and renewable-energy certificates. Policy instruments may also be aggregated into single measurements to proxy for the stringency of environmental regulations. This helps bring together the array of single policy instruments operating within a given country. It also facilitates comparative analyses of stringency levels across countries. Such an approach has been adopted in Botta and Koźluk (2014), who construct a quantitative composite indicator of stringency based on selecting, weighing and aggregating relevant environmental policy instruments, for both the energy sector and the overall economy across OECD countries. Furthermore, environmental policy instruments are sometimes aggregated and included in studies quantitatively describing the enabling policy framework of countries wishing to promote sustainable investments. Examples include: the Climate Investment Readiness Index applied to clean-energy investments in South Asian countries (Mani 2012), and the comprehensive Climatescope index for assessing the environment for low-carbon investment in Latin America and the Caribbean (Bloomberg New Energy Finance 2013). However, like any aggregation approach, this approach tends to sideline the multi-dimensional realities of environmental policy stringency. Environmental policy implementation stringency is sometimes confined, in the literature, to the de facto severity of the enforcement of legislation. For this, qualitative and quantitative measures encapsulating the level or intensity of environmental policy monitoring and enforcement are constructed. Environmental enforcement indicators are typically developed for intra-country analysis, since detailed disaggregated institution-dependent data are often required. This limits to some extent the feasibility of such measures for cross-country comparisons. Measures of enforcement have been applied by several investigators to the United States due to the reliability and availability of its data across jurisdictions (Carraro et al. 2010). Examples of quantitative indicators in this respect include: The number of yearly air and water pollution-related inspections (e.g. as in Brunnermeier and Cohen 2003 for US manufacturing industries across time) Intermediate enforcement, such as a count of formal notices of non-compliance, letters sent and other enforcement actions (Gray and Shadbegian 1993 for US paper, oil and steel industries) Dummies and corresponding magnitude variables for fines and other direct economic sanctions reflecting traditional adversarial enforcement action (as in Shimshack and Ward’s 2005 study of the water-polluting behaviour of the US pulp and paper industry) Information on environmental policy enforcement is available for some developing economies, though substantial research efforts are needed to cover knowledge gaps in this area. An example is China, for which several measures of enforcement have been analysed at the national and subnational level, including the number of sanctions for environmental non-compliance, monetary penalties from enforcement actions, and the number of inspectors or results of inspection campaigns (OECD 2006). Likewise, a few studies have considered the annual frequency of plant inspections in enforcing Mexican environmental law in relation to pollution abatement in the food-processing industry (e.g. Husted and Logsdon 1997 and Alpay et al. 2002). One of the main difficulties faced when measuring enforcement is its complex and multidimensional nature, which makes it difficult to select a particular indicator or to aggregate 13
GGKP Working Paper 01|2015
across various measures. To overcome this heterogeneity challenge, the severity of enforcement is also sometimes portrayed in the literature through the use of perception-based indicators usually derived from responses to opinion surveys. These surveys typically ask relevant stakeholders to assess, rate and rank the enforcement of environmental regulations across countries (e.g. World Economic Forum 2013 and Madhoo 2013).
3.3 Policy impact: Indicators measuring the stringency of policy operation The third stylized policy-operation stage of the decision-making process encapsulates the responses of economic agents with respect to the requirements and incentives created by environmental policies. Environmental policy operation stringency indicators are largely captured through the use of de facto information on pollution-abatement expenditures, which can be deployed as indicators of “effective demand” for pollution control (Lanjouw and Mody 1996). Pollution abatement costs may include expenditures by both the public and the private sector. These could include, for example, public expenditures on research and development, as well as private investment expenditures on plant and equipment for pollution control. This is the case presented in Lanjouw and Mody (1996), who investigated the relationship between the severity of environmental regulations, as measured unidimensionally by total public and private pollutionabatement expenditures, and environmental innovation using panel data for Germany, Japan and the United States. Public and private abatement expenditures on environmental protection activities were also used as a proxy for regulatory stringency across nine years and 20 EU countries in Caporale et al. (2010). Other studies have focused principally on public abatement expenditures, such as expenditures on pollution abatement at publicly owned facilities (or carried out by public actors) or on government subsidies for abatement by private actors. Proxies used in the literature sometimes refer to public environmental R&D expenditures as a proportion of GDP (e.g. Damania et al. 2003). Most studies using private pollution control expenditures to measure the stringency of environmental regulations have focused on developed countries, such as Hamamoto (2006) for the case of capital abatement costs in Japan. Among these studies, a disproportionate have focused on the United States and make use of detailed data from the US Census Bureau’s Pollution Abatement and Control Expenditures (PACE) survey (see Box 1 for more details on the PACE survey). Such data reflect both capital pollution abatement expenditures and operating costs. For instance, Jaffe and Palmer (1997) used the capital costs component of the industry-level PACE data over time (scaled by industry value added to account for variation in industry size) to study the relationship between environmental regulatory stringency and innovation for US manufacturing firms. Likewise, the operating cost component is referred to in Gray and Shadbegian (1993), Ederington and Minier (2003), and Brunnermeier and Cohen (2003). It is argued that these are more stable over time than capital expenditures for a given plant (Gray and Shadbegian 1993).8 It has also been argued that several studies employing the US PACE data fail to adjust for industrial composition (which results in biased findings) or employ confidential plant-level data that are not easily accessible to researchers (Levinson 2000). An industry-adjust index of environmental compliance costs was proposed by Levinson (2000) to overcome these
8
More specifically, PACE operation and maintenance costs include salaries and wages, fuel and electricity, materials, contract work and services, depreciation of abatement capital, and payment to governmental units for sewage collection and solid-waste collection and disposal (Brunnermeier and Cohen 2003: 283).
14
Measuring Environmental Action and Economic Performance in Developing Countries
shortcomings, allowing for comparisons across states in a given year and within states over time.9 This was adopted, for instance, in Dincer and Fredriksson (2013), who investigated dynamic interactions between corruption, trust and the stringency of environmental policies for a panel of 48 US states. From a private pollution abatement perspective, the usual assumption is that the growth in private expenditures on tackling pollution and environmental degradation reflects an increase in the level of environmental policy stringency. This means that firms are expected to spend more on pollution abatement when they are subject to more stringent regulatory measures (de Vries and Withagen 2005). However, the actual impact of such expenditures on their economic performance and environmental outcomes would depend on how abatement efforts are implemented in practice and how effective enforcement measures are.
3.4 Policy impact: Indicators measuring the stringency in relation to policy outcomes The stringency of environmental policies is also captured in the literature by referring to the impacts of the policies on environmental outcomes and the economy. Stringency indicators in relation to policy outcomes constitute common proxies used in the literature, although they tend to rest on strict assumptions, such as associating better environmental performance with stricter regulations (OECD 1994, Van Beer and Van der Bergh 1997, OECD 2003). In other words, policyoutcome indicators of stringency reflect more the consequences of tightening policies and regulations, and as such may be regarded as representing an indirect measure of EPS.10 Stringency measures focusing on policy outcomes may emphasize environmental performance outcomes or may focus on socioeconomic impacts. The former category is captured through the use of either individual measures or composite indices (aggregates of environmental indicators). Environmental performance indicators, as proxies of policy stringency, typically assume that when existing laws are stringent and enforced, pollution intensity or environmental degradation is reduced, all else equal. Examples are available for both developed and developing economies. These may include: Production-based air and water pollution intensity indicators, such as sulfur dioxide emissions and, respectively, biochemical oxygen demand per unit of GDP (as in Cao and Prakash 2012 for 140 developed and developing countries) Emissions-based measures of stringency (as in Levinson and Brunel 2013) An effluent intensity-of-output index (as in Dessus et al. 1994 for the United States) The prevalence of landfilling in the case of solid-waste management and the extent to which wastewater is treated before release into water bodies (as in Sauvage, 2014) A combination of several specific environmental indicators related to energy intensity (as in Van Beers and Van den Bergh 1997 for OECD economies)
9
The proposed index would compare, for each state, the actual pollution-abatement expenditures, unadjusted for industrial composition, with the predicted abatement costs, with the latter being based on the operating cost component of nationwide abatement expenditures and each state’s industrial composition. 10
The starting assumption put forward in the literature using policy outcomes as indirect EPS stringency indicators is that the strictness of environmental policies is non-observable and latent, due to its complex and multi-dimensional nature.
15
GGKP Working Paper 01|2015
Composite indices emphasizing the consumption side, such as the widely referenced ecological footprint, which frames environmental problems as a function of resource overconsumption (e.g. Wackernagel and Rees 1996, Wackernagel et al. 2002) The widely cited composite index aggregating environmental policy outcomes (i.e. environmental indicator) known as the Environmental Performance Index (EPI). This is a successor to the Environmental Sustainability Index, ESI (discussed in more detail below) and focuses on current on-the-ground outcomes across a core set of environmental issues.11 A further measurement choice relates to the method of instrumental variables. This is used in econometric analysis and provides a way for consistent parameter estimation in causal empirical relationships affected by endogeneity problems. 12 The latter refers to an estimation bias often emerging in panel data regression analysis, whereby the explanatory variable (e.g. environmental stringency) is correlated with other unobserved factors that in turn are correlated with the explained variable (e.g. competitiveness). The presence of endogeneity leads to incorrect estimation of causal empirical relationships. In other words, panel data approaches, designed to remove unobserved (typically time invariant) heterogeneity, require that the stringency of environmental policies is exogenous. This is nonetheless difficult to meet in many regressionspecification models, due to several methodological empirical estimation challenges such as omitted variable bias, reverse causation, endogeneity problems or measurement errors (Millimet and Roy 2011). Some studies, though, relax the exogeneity assumption and use instead instrumental variables. A large proportion of these relate to location-specific attributes that are hypothesized to affect environmental policies, but not directly the dependent or explained variable (Millimet and Roy 2011). They may range from economic through to social and to political variables. Examples include: Changes in population density and infant mortality rates, which are argued to accompany strict environmental regulations (as in Xing and Kolstad 2002) Gross domestic product, the industry structure, the level of SO2 emissions and population density (as in de Vries and Withagen 2005, arguing that EPS is contingent on these) Estimated changes in regulatory-induced costs, such as increases in irrigation water prices due to stringent policies targeting water-resource scarcity (as in Larson et al. 2002 for Tunisian production and the export of fruits) Changing production and international trade patterns of environmentally sensitive goods (ESG)13 relative to non-ESG goods (as, for example, in Ratnayake 1998 for a panel data set of manufacturing industries in New Zealand) The principal advantage in using instrumental variables pertains to their ability to address, in principle, the empirical methodological problem of endogeneity. Studies using robust socioeconomic-related instrumental variables are, however, relatively scarce (Brunel and Levinson 11
The EPI is based on a proximity-to-target approach that measures country performance against an absolute target established by international agreements, national standards or scientific consensus (Esty et al. 2006, Emerson et al. 2012). EPI rankings have had an important influence on environmental decision-making and assessment in countries seeking to improve their ranking. For instance, it has determined some developing economies to further refine and adapt the EPI methodology, such as China, Malaysia or Tunisia (de Sherbinin et al. 2013). 12
A valid instrumental variable must fulfil two conditions in regression analysis: first, it has to be uncorrelated with the error term; and second, it has to be highly correlated with the variable (the regressor) it is supposed to “instrument” or represent. 13
Defined in these papers as industries with the highest levels of pollution abatement cost expressed as a percentage of the value of their output.
16
Measuring Environmental Action and Economic Performance in Developing Countries
2013). Although the use of instrumental variables may provide a creative solution to deal with empirical analytical situations, the debate remains as to which variables may be regarded as valid “instruments”, as finding an instrument is not usually easy.
3.5 General composite indices of policy response and impact stringency There are several composite EPS indices proposed in the literature that combine various aspects of the policy-making process, as well as policy impact dimensions. General composite indices are used in both intra- and cross-country studies and may cover de jure and de facto stringency aspects. They often include perception-based indicators that draw on questionnaires and surveys trying to bring together several aspects related to the perceived stringency of environmental policy-making. For example, in Isik (2004) the United State livestock sector was considered and an ENVSTR index was developed to represent the general stringency of the country’s environmental policies as an unweighted sum of the affirmative responses to 29 survey questions.14 A resulting composite index that varies between 1 (lowest stringency) and 21 (highest stringency) was then taken to represent the general stringency of each of the 48 US states considered. In Esty and Porter (2002) the authors propose a more comprehensive general composite index referred to as the Environmental Regulatory Regime Index (ERRI), which aggregates six measurement categories: stringency of environmental pollution standards, extent of subsidization of natural resources, strictness of enforcement, sophistication of regulatory standards, quality of the environmental information available, and quality of environmental institutions. Information on the six components draws on the World Economic Forum WEF Executive Opinion Survey and the Environmental Sustainability Index (ESI) referred to below. A further aggregate, perception-based index combining both policy formulation and implementation stringency aspects (e.g. laws on books, monitoring and enforcement) applied to a large set of developing countries was deployed in Fredriksson et al. (2013). The authors make use of the World Bank’s 2004 Country Policy and Institutional Assessment Index, which draws on the judgement of technical experts to show that environmental policy tends to be weaker in decentralized relative to centralized states. General composite indices measuring the stringency of environmental policies have been further expanded to include policy response and policy impact aspects. Earlier examples in this respect are provided in Walter and Ugelow (1979) and Tobey (1990), who used the information provided by a 1976 UNCTAD survey to extract information on environmental problems and associated domestic regulations in economies of various development levels. The authors compiled an environmental stringency index to rank and compare countries (ranging from one, tolerant, to seven, strict). Likewise, a production-based composite index was advanced in Dasgupta et al. (1995) under the label of Environmental Policy and Performance Indices (EPPI). The study provided an aggregate measure for comparing environmental policy and performance across countries (with a possible maximum value of 250) in four environmental dimensions: air, water, land and living resources.15 The EPPI approach was also adopted in Xu (2000), Eliste and
14
Isik (2004) sourced part of the data from the 1998 US National Survey of Animal Confinement Policies administered. This incorporated ‘yes’ or ‘no’ responses to 29 regulatory stringency survey questions, including issues about local enforcement. Examples of such questions include “whether there are requirements on the minimum set-back distance or confinement facility construction permits and approval of confined livestock facility locations […] or whether regulatory staff is required to make site visits” (Isik 2004: 956). 15
Dasgupta et al. (1995) assembled their indices from randomly surveying 31 national 1992 UNCED reports. They use 25 questions to categorize the state of environmental awareness, scope of policies adopted, scope of legislation enacted,
17
GGKP Working Paper 01|2015
Fredriksson (2002) and Pellegrini and Gerlagh (2006), who included a larger set of developed and developing countries. Another example of a composite index combining policy response with performance or impact measures, and suitable for comparing and ranking countries, is Cagatay and Mihci (2006). The authors constructed an Index of Environmental Sensitivity Performance (IESP) based on the OECD’s conceptual pressure-state-response indicator framework and thus incorporating both environmental policies and environmental outcomes.16 Finally, a commonly cited general composite index measuring overall progress towards environmental sustainability and permitting systematic quantitative international comparisons is the Environmental Sustainability Index (ESI). This includes aspects pertaining to environmental outcomes and environmental policy or governance.17 The ESI incorporates, into a single aggregated index, data sets pertaining to natural-resource endowments, past and present pollution levels, environmental management efforts, and the capacity of a society to improve its environmental performance (Esty et al. 2005).
4. An appraisal of stringency measures in relation to developing countries Overall, it may be inferred from the available literature that EPS measures typically relate to highincome economies, particularly with reference to the United States, although in several cases developing countries are included as well. Figure 2 maps out a set of 77 studies measuring environmental stringency and investigating its economic consequences (more precisely, a total of 67 separate studies, when accounting for double-counting). The mapping is based on a combination of three recent comprehensive reviews of the corresponding literature, i.e. Ambec et al. (2011), Brunel and Levinson (2013) and Millimet and Roy (2011). Studies have been grouped by country coverage and colour-coded, depending on which of the three main reviews they refer to.
control mechanisms in place and the degree of success in implementation (each category being described as high, medium and low with assigned values of 2, 1 and 0). 16
The IESP (Cagatay and Mihci 2006) is measured across four main environmental issues or sub-indices directly related to industrial activity: climate change (CO2 and CH4 emissions), acidification (SOx and NOx indicators), water resource depletion (intensity of water use measures) and waste-management issues (waste-generation indicators). Response indicators cover the corresponding four industrial-related environmental problems. They also include a mix of input and output-based measures: commercial energy efficiency, expenditures for pollution abatement as percent of GDP, the percent of population whose waste-water is treated and, respectively, treatment and disposal of hazardous waste as percentage of generated hazardous waste. 17
The ESI was developed by the Yale Center for Environmental Law and Policy and the Columbia University Center for International Earth Science Information Network, in partnership with the World Economic Forum and the European Commission’s Joint Research Centre, and is available for up to 146 countries for 2000, 2001, 2002 and 2005.
18
Measuring Environmental Action and Economic Performance in Developing Countries
Figure 2. Studies deploying measures of environmental policy stringency grouped by country coverage and drawing on three recent comprehensive literature reviews
Note: Some studies focusing or including other OECD or high-income countries include the United States; some studies incorporating non-OECD developing countries include a large set of economies combining both developed and developing countries. Source: Based on the reviews of 19 studies provided in Ambec et al. (2011); 43 studies in Brunel and Levinson (2013) and 15 studies in Millimet and Roy (2011).
Out of all the 67 studies presented in Figure 2, around half focus exclusively on the United States, a third include other developed economies as well, whereas only 12 studies (less than a fifth) cover only developing countries in their data sets and analysis. Studies providing stringency measures for developing nations mostly deploy implicit proxies, particularly relating to policyimpact indicators or general composite indices, including perception-based indicators. This finding is reflected as well in Table 3 in the Annex, which summarizes 30 studies that included developing countries in their analysis (some of these being also captured by the review studies displayed in Figure 2). Around half of these refer to general composite indices or policy-impact proxies of environmental stringency.
4.1 Advantages and disadvantages of types of stringency indicators Policy-outcome measures or general composite indices of environmental stringency in developing countries have the key advantage of being readily available from large international databases or already constructed by other researchers or institutions. Examples include: CO2 emissions (e.g. Constantini and Crespi 2008); energy-intensity measures (Cole and Elliott 2003); SO2 emissions 19
GGKP Working Paper 01|2015
(e.g. Xing and Kolstad 2002); lead content of petrol across countries (e.g. Cole and Fredriksson 2009, Damania et al. 2003); data for general composite indices, such as those based on UNCTAD and UNCED survey data (e.g. Tobey 1990, Dasgupta et al. 1995 or the journal version 2001, Cole and Elliott 2003); or data underpinning perception-based indicators drawing on the World Economic Forum Executive Opinion Survey (e.g. Kalamova and Johnstone 2011, Kellenberg 2009, Madhoo 2013). Such types of aggregate measures of environmental stringency facilitate comparisons across countries or jurisdictions, and are capable of synthesizing various aspects portraying environmental policy stringency. Even though EPS in developing economies has been largely captured through the use of policyimpact proxies and composite indices, two major shortcomings in relation to their future use need highlighting: Compiled indices are relatively subjective and ad hoc. Aggregates of environmental performance indicators may result in different rankings of countries depending on which index is used and how various environmental impacts are weighted (Ewers and Smith 2007). Composite indices tend to create the illusion of absolute and categorical interpretations (Morse and Fraser 2005). Despite panel data of composite indices becoming increasingly available, the statistical methods and construction approaches (e.g. normalization or weighting schemes) to developing aggregate indices are questionable and need more serious attention (de Sherbinin et al. 2013, Böhringer and Jochem 2007). Policy-impact measures of stringency, such as environmental outcomes or socioeconomic instrumental variables, tend to rest on several restrictive generalized assumptions linking environmental policy responses with observed performance outcomes. For example, high levels of pollution may either reflect lax environmental regulations or they may induce stringent policies, implying that accounting for lagged effects and simultaneity bias issues are important when using pollution outcomes as a proxy for stringency (Levinson 2008). Studies that instrument for environmental regulatory strictness using pollution levels risk mistaking one mechanism for the other, and can only be informative, at best, about environmental compliance or pollution-abatement costs (Brunel and Levinson 2013). Instrumental variables have nonetheless always been open to critique (Brunnermeier and Levinson 2004). Rigorous specification testing or robust discussions of why selected instrumental variables represent an appropriate choice for addressing endogeneity problems are, thus, necessary (Millimet and Roy 2011). Pollution-abatement expenditures The other set of policy-impact stringency indicators, pollution-abatement expenditures, arguably provide robust and comprehensive EPS proxies for cross-country comparisons, particularly when relating to industry efforts in controlling pollution. For developing countries, data on publicabatement expenditures are likely to be more readily available than those pertaining to privateabatement costs. However, governmental expenditures on the environment are less commonly used in the literature as a measure of stringency than are industry-abatement costs. Data on the two components tend to be bundled under a single aggregated expenditure heading (e.g. the environmental R&D expenditure as percent of GDP indicator, including both private and public, for which data are made available under the World Bank’s World Development Indicators). Aggregated data on overall abatement expenditures can be problematic since they may hide firm heterogeneity, and changes at the aggregate level may be wrongly interpreted as variations in the stringency of environmental policies (Levinson and Taylor 2008). On the industry side, pollution-abatement expenditures have been widely applied in the literature, particularly to the United States and other developed economies. Detailed data for
20
Measuring Environmental Action and Economic Performance in Developing Countries
middle and low-income economies are much less available, hampering research on the relationship between environmental policy stringency and economic dynamics. From all the studies surveyed in both Figure 2 and Table 3 in the Annex, only one study focuses explicitly on detailed disaggregated developing country data for abatement costs: that of Tsai (2002) for Taiwan manufacturing based on private pollution abatement cost data from public statistical sources. Significant efforts are needed to initiate systematic data collection in this respect. Some researchers have circumnavigated this data limitation and provided new theory-driven approaches to measuring cross-country regulatory differences. An example is Van Soest et al. (2006), who measured environmental stringency by the difference between a polluting input’s shadow price and its market price for nine European OECD countries. However, a major shortcoming to their approach relates to its theoretical underpinnings. These draw heavily on neoclassical theory and rely on restrictive assumptions that posit perfectly competitive general equilibrium and maximizing behaviour, which often do not match socioeconomic and institutional realities on the ground. Nonetheless, even if expenditure data on pollution-abatement and control were available for a larger set of countries, there would still be significant methodological problems. This may owe in part to the heterogeneity in the definitions and sampling strategies applied in various countries and their inadequacy for cross-country applications (Kalamova and Johnstone 2011). It may be also due to firm investment in pollution abatement being largely driven by firm choice with respect to the best technology available, rather than to regulatory stringency (Berman and Bui 2001). Also, abatement expenditures do not account for all the economic costs of compliance, such as the administrative costs of dealing with environmental regulations (Berman and Bui 2001, Carraro et al. 2010). Other factors might cause private pollution-abatement expenditures to increase when regulations are more severe. These may include external pressures from consumer groups or environmental NGOs (Brunnermeier and Cohen 2003). Moreover, in developing countries where enforcement may be less effective (e.g. polluters comply only when inspection visits are announced), high private abatement costs may not necessarily accurately reflect tightened stringency. Dummy variables Turning to policy response stringency measures, dummy variables have also been frequently used to capture cross-country differences, although data availability and comparability for developing countries are often an issue. These cover dimensions pertaining to the strictness of policy formulation and implementation. Several limitations are nonetheless associated with the use of dummies (Carraro et al. 2010). By their very nature (being binary discrete variables), regression coefficients on dummies are able to provide insights only with respect to the impacts the presence of an environmental legislation or policy instrument may have on the explained variable, and not in relation to their magnitudes or intensity. As such, dummy variables may capture the presence of environmental policies, but can provide only limited insights into the changing levels of environmental policy stringency. Also, the effect of omitted factors is easily attributed to the policy dummy when the respective effect happens to coincide with the change in policy regime (Jeppesen and Folmer 2001). A further methodological issue is that for cases in which several dummies are used to account for the presence of more than one policy instrument or type of regulation, the empirical regression is then troubled with multi-collinearity problems (Carraro et al. 2010). Nonetheless, dummy variables when combined with continuous indicators may provide more meaningful measures of environmental stringency (e.g. as performed in Hering and Poncet 2014). International environment cooperation 21
GGKP Working Paper 01|2015
Several limitations in relation to the use of international environmental cooperation as proxies for measuring policy formulation stringency have also been noted in the literature: Membership in multilateral environmental agreements does not necessarily translate into higher environmental stringency (Damania et al. 2003) Membership may be influenced by the political culture of the member state and not by its environmental protection ambitions (Damania et al. 2003) This type of measure could induce a potentially serious measurement error issue in regression analysis, since a simple summation of the number of active environmental treaties in which a country is participating can be a noisy indicator of its international environmental commitments (Rose and Spiegel 2009) Despite the limitations, data on international treaty commitment for developing economies can be relatively quickly extracted and assessed. In addition, measurements of environmental policy cooperation involving developing economies are useful in portraying recent trends in increased international cooperation to tackle transboundary environmental challenges, such as anthropogenic climate change, ozone depletion, acid rain and cross-border biodiversity loss. Environmental policy instruments Data availability for measuring the stringency of policy implementation in terms of the depth and coverage of various policy instruments is relatively good for most countries. However, using policy instruments as proxies for measuring environmental stringency per se is problematic. First, environmental policy instruments can be very diverse across countries, sectors and environmental issues, and as a result are difficult to compare (Carraro et al. 2010). Even for the same sector and environmental issue, there may be a mix of policy instruments being simultaneously applied to address a certain environmental issue. For instance, vehicle emission standards and fuel taxes to limit the energy consumption of, and the greenhouse gas emissions from, the transport sector. How would one then compare the stringency of emission standards with the stringency of tax rates? One alternative is to aggregate the stringency of policy instruments by using country-dependent weights (as in Botta and Koźluk 2014), although the subjectivity surrounding the choice of weighting necessitates care. This leads to a second crucial limitation of using policy instruments as proxies for environmental stringency: the form of policy intervention. This is taken to refer to the mix of policy instruments a jurisdiction chooses to implement in order to pursue its environmental strictness and ambitions. The choice of policy instruments implemented interacts strongly with their level of severity, in terms of magnitude and coverage. Environmental policy instruments may have different impacts on the economy and the environment depending on the type of energy or pollution source they tackle (e.g. Johnstone et al. 2010 for the potential penetration of renewable energy under different policy instruments). Moreover, policy instruments perform differently depending on the institutional setting in which they are implemented (Carraro et al. 2010). For example, Coria (2009) studied oil-to-gas fuel switching in Santiago, Chile, and showed that regulation directly impacting the prices of ‘‘dirty’’ inputs is more effective than environmental quality standards, especially where institutions are weak and have limited enforcement and monitoring capability. For some developing countries, it has been found that when formal regulation is weak, communities are often able to induce abatement via “informal regulation” and push for effective environmental regulations (Pargal and Wheeler 1996, and Afsah et al. 2013 for Indonesia, or Pargal and Mani 2000, and Greenstone and Hanna 2014 for India). As such, for the case of policy instruments, the form of intervention is inextricably linked to the stringency and effectiveness of
22
Measuring Environmental Action and Economic Performance in Developing Countries
intervention, and the two would need to be evaluated in combination in order to extract any meaningful insights. Country-specific environmental regulations Generalized or unidimensional cross-country measures of environmental stringency come at the cost of losing or sidelining significant contextualized, structural and country-specific detailed information. The development of EPS indicators providing more direct or explicit contextual measures of policy responses in developing countries are essential for understanding in-depth characteristics of particular environmental regulatory regimes. Nonetheless, EPS indicators reflecting the specificities of environmental legislations in developing countries often require the development of highly contextualized large data sets and greater within-country geographical resolution. These intensive disaggregated data requirements explain why most of the focus of environmental policy-formulation or implementation-stringency indicators has been on developed economies, for which data are more readily available. There have been some studies, albeit few, that have compiled their own detailed database from a mix of sources aiming to capture the stringency of country-specific environmental regulations. Examples include the recent studies of Greenstone and Hanna (2014) and Hering and Poncet (2014), both also listed in Table 3 in the Annex, who deploy city-level databases for India and, respectively, China. Measuring the stringency of specific environmental legislative issues could present the shortcoming of being insufficiently representative of a country or a jurisdiction’s environmental regulatory regime, if studied in isolation. A country could have strict air-pollution legislation but a lax waste-management policy. If the chosen stringency variable in an empirical investigation relates only to air, then this could result in a biased assessment of the rigorousness of a country’s regulatory regime (Chen 2010). Enforcement Enforcement is critical in understanding and measuring EPS levels, especially in developing economies, and any future work along these lines would need to deal with its complexity. Middleand low-income countries typically struggle with relatively weaker de facto policy implementation issues, even though stricter legislated environmental regulations or standards may exist on paper. Environmental legislative stringency is often eroded by weak enforceability and these interactions cannot be detected solely through the use of specific stringency measures emphasizing particular environmental regulations or standards (Chen 2010). The literature measuring the stringency of environmental enforcement in lower-income countries is, though, extremely sparse. For example, only the OECD (2006) study from the list of studies including developing countries presented in Table 3 in the annex deals explicitly with several qualitative and quantitative measures of environmental enforcement in China. Data-collection challenges are compounded by the multi-dimensional nature of monitoring and enforcement. Enforcement aspects are extremely heterogeneous, often difficult to quantify, and are highly institutional and context specific. Political-economy aspects, including the role of bribery and corruption add further to the complexity of monitoring and enforcing regulatory compliance in lower-income countries (Damania et al. 2004). An important caveat is that the relationship between enforcement, compliance and legislative (formulation) stringency needs to be closely evaluated, since this relationship is not necessarily straight-forward. Low enforcement could be correlated with high compliance if firms were already complying with environmental regulations, though this is unlikely to be the case in most lowerincome economies. In addition, environmental policies can perform differently in terms of environmental and social outcomes within the same “weak” governmental institutional setting of 23
GGKP Working Paper 01|2015
a developing country. For instance, Greenstone and Hanna (2014) found striking differences in the effectiveness of air pollution regulations compared with water-pollution regulations across India’s cities. The authors cautiously attribute this to greater demand for air quality improvements by India’s citizens and a more active role played by the Supreme Court in enforcing air-pollution regulations.
4.2 Lessons for the prioritization of future data collection and measurement efforts targeting developing countries All indicators measuring environmental policy stringency that have been deployed in the literature present advantages and disadvantages. There is no unique measure that would ideally represent policy stringency across countries, sectors, environmental issues or different aspects of the policy process. This is not surprising given the highly complex and multi-dimensional nature of stringency. However, based on the detailed review and assessment of the relevant literature presented above, one may prioritize future research needs with respect to measuring environmental policy stringency in developing countries (Table 2). Table 2. Describing and ranking EPS indicators with respect to their potential for future development and application in developing economies EPS indicator
Type of measure
1. Enforcement measures***
Policy response: implementation stringency
Enhanced multidimensional data collection efforts on varying enforcement aspects are needed, preferably complemented with measures of corruption, since these are essential for evaluating stringency in developing economies.
Policy response: formulation of stringency
Detailed data collection is needed for applications in developing economies. The development of environmental legislative inventories and the construction of qualitative and quantitative indicators targeting the policy formulation phase would help advance research with application to developing countries.
Policy impact: operation stringency
A common useful proxy measuring stringency employed in the literature, but mostly applied to the US and other developed countries. Significant data collection efforts in developing economies are required in this respect. Data for public abatement expenditures for developing countries is relatively more readily available, though this proxy provides a highly limited interpretation of environmental stringency. The assumption that private abatement costs increase with the stringency of policies needs to be treated with caution and explored in relation to the effectiveness of enforcement measures.
Policy response: formulation stringency
Appealing indicators for applications across developing countries, since data could be relatively easy extracted (e.g. membership of multilateral environmental agreements). However, these rest on several limiting assumptions noted in the literature.
2. Qualitative descriptors, dummies, counts or continuous variables measuring environmental legislative stringency***
3. Private abatement expenditures**
4. Measures of international environmental cooperation**
stringency
Data collection needs and potential for application in developing countries
24
Measuring Environmental Action and Economic Performance in Developing Countries
EPS indicator
5. Perception-based indicators of de jure policy formulation stringency**
6. The presence, incidence & coverage of environmental policy instruments**
7. Environmental performance indicators*
8. Other instrumental (particularly socioeconomic-related) impact variables*
9. Aggregate indices of policy response and impact measures*
Type of measure
stringency
Data collection needs and potential for application in developing countries
Policy response: formulation stringency
Data for developing countries are to some extent available (e.g. World Economic Forum surveys), though more disaggregated or refined surveys are required. The development of consistent time-series of perception measures would also benefit future research.
Policy response: implementation stringency
Data for developing economies is relatively readily available. Policy stringency is inextricably tied in with the form of policy intervention, and it is difficult to separate the effects of the two for this type of EPS proxy. The form of environmental policy intervention is at least as important as the extent or severity of intervention, and both aspects are key to understanding impacts on economic performance.
Policy impact: outcome stringency
A common proxy used in the literature with reasonably good data availability for countries of different development levels sourced from international databases and surveys, although it provides an indirect measure of stringency and rests on particular assumptions on the relationship between policy responses and their impacts.
Policy impact: outcome stringency
These are also fairly often used in the literature with reasonably good data availability for countries of different development levels (sourced from national or international statistics). They express an indirect measure relating to policy impacts rather than stringency per se giving rise to several methodological issues.
General indices
Data for developing countries are to some extent available, again mostly drawing on international databases and surveys. They are highly aggregated less explicit measures of stringency, and more data collection efforts are required to refine these indices for developing economies.
composite
Note: *** denotes highest priority; ** indicates middle level priority; and * is associated with the relatively lowest priority that should be given to future research applied in developing countries.
It is not necessarily the case that stringency measures applied to developing countries may differ from those used for the developed world. It is rather that the relevance and prioritization of the various stringency indicators may differ between high-income and middle to low-income economies. Table 2 ranks these indicators in terms of the relative level of priority that may be given to future research efforts targeting developing economies. This level of priority ranges from one star (lowest priority) to three stars (highest priority), indicating that all EPS measures ultimately require further development and in-depth studies. The respective ranking is determined based on three criteria: 1.
The extent to which data are already available for developing economies (and if this occurs to a significant extent, data-collection efforts should be geared towards measuring other policy stringency dimensions as well).
25
GGKP Working Paper 01|2015
2.
Whether de facto aspects are important or not in the construction of the corresponding EPS measure (and if this is the case, stringency-measurement efforts in developing countries should be given higher priority).
3.
The extent to which EPS indicators entail more direct measures (greater priority being given to more explicit primary measures of stringency).
Two types of EPS indicators emerge as needing most attention for a more in-depth future research agenda targeting developing countries. Given their importance in understanding environmental policy strictness in lower-income economies, these indicators, and the data required to construct them, should be given the highest priority:
de facto enforcement indicators;
de jure explicit stringency measures pertaining to specific environmental laws, rules, and regulations (including direct regulatory standards, if embedded in law)
The body of research developing stringency measures for lower-income economies with respect to other types of stringency measures relating to the three stages of the policy-making process is also sparsely populated. Despite their methodological and conceptual limitations, the next level of research and data collection priority could be attributed to: private abatement expenditures; measures of international environmental cooperation; perception-based indicators targeting de jure environmental stringency; and EPS measures relating to policy implementation, with respect to the presence, incidence and coverage of environmental policy instruments. When using private abatement expenditures, it is important to treat these carefully to avoid tautological results, particularly when trying to assess the impacts of environmental stringency on private-sector performance. The lowest level of priority (relative to other types of EPS indicators) should be given to developing indices of, and data for, environmental policy outcomes and composite indices that aggregate policy responses and impacts. These measurements appear to be more problematic in terms of capturing stringency. In particular, those measures focused on policy impact tend to rest on restrictive assumptions on the links between policy stringency and the impact the policies have on the economy and the environment. In contrast, general composite indices may be able to capture more direct and comprehensive measures of stringency in their aggregation. Significant efforts have been already undertaken to construct overall composite stringency measures, although more efforts are required to refine them for developing countries.
5. Conclusion and Recommendations Measuring the stringency of environmental policies is a complex task. There is no unique universal indicator to meaningfully integrate all aspects. Environmental policy stringency indicators are prone to measurement errors and challenged by the limited availability of reliable detailed data, particularly on developing countries. The corresponding body of literature is much richer in applications that focus on developed economies. This is not to say that the literature investigating the nexus between environmental policies and the economy in developed nations has arrived at conclusive evidence. Any future research efforts targeting the measurement of environmental stringency in developing economies would need to explicitly and comprehensively define from the start how stringency is conceptualized. A taxonomy for grouping various environmental policy stringency indicators has been advanced in this study, providing a reference base for future analyses or data-collection efforts. The study refers to the sequential stages typically characterizing policy-making processes:
26
Measuring Environmental Action and Economic Performance in Developing Countries
policy formulation, implementation and operation. It also makes the distinction between policy responses to environmental challenges and the impacts such responses may have on the environment, economy and society. This study does not recommend the development and application of a single environmental stringency measure. Rather, it favours the development of multi-dimensional environmental stringency indices or a multi-pronged approach to understanding this issue within the context of developing country dynamics. This is because it is important to deploy several different stringency indicators in order to check for the robustness of empirical results or findings. However, based on the review undertaken, the study does provide an indicative prioritization of these various types of indicators that future research and data collection efforts may wish to focus on. A first-order task is to collect data on regulations, policies and enforcement in developing countries in order to better understand the stringency of such policies. Such studies are currently lacking and should be given higher priority. A better understanding of the strictness of de facto enforcement given the importance enforcement plays in the effectiveness and efficiency of environmental policies in many developing economies. The improvement and deployment of explicit stringency measures, particularly those focused on enforcement, may come at the cost of limited comparability across studies, sectors or countries. Future studies would need to consider how international comparisons could be facilitated, even when using more explicit contextdependent stringency measures. In addition, comprehensive, preferably panel, data inventories could be developed to systematically record policy formulation, implementation and operation stringency in developing countries. Data on domestic environmental legislation and types of policy instruments could be collected, for instance, along the lines of the ENVIPOLCON database for EU countries. Data collection could also target the economic sectors, industries or plants that are classified as heavy emitters of pollutants by current legislation in developing countries and by levels of abatement costs. Such detailed data, including by type of pollution (e.g. point source versus non-point source), sector (e.g. agriculture, main manufacturing branches, etc.) and country (e.g. low income versus middle income) would then underpin the construction of several stringency measures, in terms of dummies, counts or other quantitative measures. Micro-level data sets (e.g. enforcement and private pollution-abatement by plant or disaggregated industry) could be developed in conjunction with efforts targeting the construction of macro-level legislative, and policy implementation and operation inventories. The choice of stringency indicator is dependent on the type of environmental problem being assessed, the nature of the relationship to be examined and on the geographical scope of the problem to be investigated. If cross-country assessments are targeted, then broader stringency measures (e.g. perception-based indicators, membership of multilateral environmental agreements or even general composite indices) may be needed to complement more specific or explicit stringency measures. Furthermore, ex-post and ex-ante evaluations may require the development of different types of stringency measures. For countries that have little experience with environmental policy-making and limited availability of historical records, ex-ante simulation models may be more suitable, rather than ex-post data-intensive empirical studies. In this case, policy instrument design issues, combining the form with the extent of intervention could be more helpful. The following are some examples of specific research projects that could provide useful insights into evaluating interactions between environmental policy stringency and economic dynamics in developing countries:
27
GGKP Working Paper 01|2015
A multipronged assessment of the strictness of environmental policies, covering both de jure and de facto aspects. This would help improve understanding of the evolution of environmental stringency — not only over time, but also across space within the national boundaries of a country (of particular relevance to geographically large developing nations, such as China, India or Brazil). It would involve a sustained periodic effort in data collecting, including taking stock of changes to environmental policies and laws, before meaningful studies exploring the relationship between stringency and social, environmental, and economic outcomes could be undertaken. The conceptualization and measurement of stringency pertaining to environmental policies tackling non-point source or diffused pollution (e.g. agricultural runoff or sewage control problems). These tend to be of prevailing economic and environmental importance for many lower-income economies, albeit very difficult to quantify and monitor. The conceptualization and measurement of stringency targeting global value chains as the main unit of analysis. This could spatially delink regulation and economic impacts and investigate instead the effects that national stringency may have on globally active firms. The study of power relations, governance regimes and their interactions with environmental policy stringency across different developing country decision-making models. Power relations (e.g. interactions between local environmental authorities and other public bodies or actors) or institutional arrangements (e.g. land ownership and land-use or property-rights issues) could be examined more in-depth, at the sub-national level, in relation to the degree of de facto stringency and environmental policy enforcement aspects. Interactions between the form and severity of environmental policy interventions, and their implications for innovation, economic growth and labour market dynamics. This could deal with the linkages between the form or design of environmental policy interventions and their stringency levels. It would go beyond measuring and quantifying stringency, and evaluate mixes in policy instruments, as well as the role of broader green-growth strategies in affecting economic dynamics. Both detailed case studies and cross-country assessments for lower income economies could be developed. Two parallel research efforts need promoting in order to increase the evidence base of potential interactions between the level of environmental policy stringency and economic dynamics in developing countries. On one hand, there are large data requirements to populate the multidimensional matrix pertaining to conceptualizing and measuring the severity of environmental policies and regulations in lower-income countries. On the other hand, significant methodological challenges remain with regard to empirically estimating the causal relationship between environmental policy strictness and economic performance. Advancing on both fronts may be supported through targeted case studies that combine data collection aspects with methodological dimensions. The developing country context specificity grounded in empirics may bring fresh insights to the green growth debate.
28
Measuring Environmental Action and Economic Performance in Developing Countries
Annex Box 1. Examples of data sources underpinning stringency measures in the US There has been a strong tradition in the United States in extracting disaggregated and good quality data measuring different dimensions of environmental policy stringency. Federal involvement in environmental regulation started earlier compared to most other countries, in 1970 with the creation of the Environment Protection Agency (EPA). Data sources for measuring environmental policy stringency in the US may vary, from individual researchers’ efforts to collect and construct their own data sets (usually targeting specific sectors or regions) to systematic public regulatory initiatives creating detailed and comprehensive countrywide databases. Some studies collected their own data or developed their own measures of environmental legislative stringency. This may be performed at the local level, for example through the construction of unique plant-level panel data sets, as in the case of Berman and Bui (2001) examining variations in local environmental regulations enacted under the South Coast Air Quality Management District of California and their impact on petroleum refineries in the region. Other studies developed their own data sets by targeting a specific sector, such as in the case of Ollinger et al. (1998), who described environmental regulatory changes with respect to the use of pesticides across the country over the period from 1972 to 1989 period. Reliable measures of strictness of enforcement are also typically more readily available for US jurisdictions relative to other countries. These may range from specific local enforcement measures (e.g. number of inspection visits, levels of monetary fines) to overall macro-level measures, such as EPA data on compliance rates or enforcement budgets. A comprehensive nationwide database commonly referenced and used in the corresponding literature is the Pollution Abatement Costs and Expenditure (PACE) Survey. This was undertaken by the United States Census Bureau and sponsored by the Environmental Protection Agency. PACE survey data were made available annually from 1973 to 1994, after which it was discontinued due to lack of budgetary resources. It was reinstated later under a revised format and infrequent publication in 1999 and afterwards in 2005. Since then, it has not been conducted and no further releases are foreseen as yet. The survey gathered data at the plant level, covering the manufacturing, mining and electric utility industries, and provided statistics on capital expenditures and operating costs associated with compliance to local, state and federal regulations, and voluntary or market-driven pollution abatement activities. The data extracted concerned pollution prevention and pollution treatment by type of media, air, water or solid waste, and type of activity, treatment, recycling, disposal and prevention, including expenditures for site cleanup, permits, fees and product redesign. As such, the PACE survey constituted a reliable, historical source for constructing various environmental stringency proxies targeting the operationalization of environmental legislation and policies from the industry side.
Based on: Berman and Bui (2001), Ollinger et al. (1998), Duffy (1996), Gray and Shimshack (2011), U.S. Census Bureau (2013), and U.S. Environmental Protection Agency (2014).
29
GGKP Working Paper 01|2015
Table 3. Studies measuring environmental policy stringency that include developing countries in their analysis (The rows in gray highlight the only studies that provide detailed within country explicit assessment of environmental stringency) Non-OECD developing country included
Data source
Stringency proxy employed
Type of environmental stringency indicator
Dasgupta et al. (1995) or the 2001 journal version
31 developed and developing countries for the year 1990
1992 UNCED reports & survey questions
Aggregates of policy responses and impacts: Environmental Policy and Performance Index (EPPI)
General composite index
Eliste & Fredriksson (2002)
62 developed and developing countries for the year 1990
1992 UNCED reports & survey questions
Based on the Dasgupta et al. (1995) EPPI index
General composite index
1992 UNCED reports & survey questions
Based on the Dasgupta et al. (1995) EPPI index
General composite index
1992 UNCED reports & survey questions 1992 UNCED reports & survey questions
Based on the Dasgupta et al. (1995) EPPI index Based on the Dasgupta et al. (1995) EPPI index Based on the Dasgupta et al. (1995) EPPI index Aggregates of policy responses and impacts Aggregates of policy responses and impacts: Index of Environmental Sensitivity Performance (IESP)
Study
Cole & Elliott (2003) Damania et al. (2003) Pellegrini & Gerlagh (2006) Xu (2000) Tobey (1990) Cagatay & Mihci (2006)
Esty et al. (2005)
Fredriksson et al. (2006) Emerson et al. (2012)
Up to 62 developed and developing countries for the year 1990 30 developed and developing countries, 1982-1992 62 developed and developing countries for the year 1990 20 developed and developing countries for the year 1990 23 developed and developing countries for the year 1976 31 developed and developing countries for the year 2000
146 developed and developing countries, for the years 2000, 2001, 2002 and 2005
Cross sectional data including 90 developing countries 132 developed and developing
World Bank and UNCED data 1976 UNCTAD Survey (Walter and Ugelow 1979) Based on various sources and databases Created by Yale Center for Environmental Law and Policy, the Columbia University Center for International Earth Science Information Network, the World Economic Forum and European Commission’s Joint Research Centre World Bank’s 2004 Country Policy and Institutional Assessment index Same institutions as in Esty et al.
Aggregates of policy responses and impacts: Environmental Sustainability Index (ESI)
Aggregate of policy formulation & implementation Environmental Performance
General composite index General composite index General composite index General composite index
General composite index
General composite index
General composite (perception-based) index Aggregate of environmental
Policy impact
30
Measuring Environmental Action and Economic Performance in Developing Countries
countries, for the years 2006, 2008, 2010, 2012 22 developed and developing countries, 1985-1990 148 developed and developing countries, 1996-2005
(2005) for the ESI index were involved in collecting and creating the database United Nations Environment Programme World Bank World Development Indicators
outcome indicators
indicator
Individual environmental outcome indicators Individual environmental outcome indicators
Policy impact indicator Policy impact indicator
Cao & Prakash (2012)
140 developed and developing countries, 1980-2003
World Bank World Development Indicators and data from Stern (2005)
Emissions of sulfur dioxide and biological oxygen demand
Individual environmental outcome indicators
Policy impact indicator
Larson et al. (2002)
Tunisia, Jordan, Morocco, Syria, Cyprus and Turkey
Government sources and direct discussion with industry leaders
Estimates of regulatory-induced cost changes
Socioeconomic-related instrumental variable
Policy impact indicator
Tsai (2002)
Taiwan (manufacturing industries), 1982-1997
Industrial Statistical Surveys & Industrial Census Report, Statistics Division, Taiwan Ministry of Economic Affairs
Abatement capital expenditures
Private abatement expenditures / de facto policy operation stringency indicator
Policy impact indicator
WEF (2013)
Around 150 developed and developing countries, various years
World Economic Forum’s Executive Opinion Survey
WEF perception index (enforcement of environmental regulation)
Perception-based indicator of de facto enforcement (policy implementation) stringency
Policy response indicator
OECD (2006)
China, 2000-2005
Data from Chinese State Environmental Protection Agency and Environmental Protection Bureaus
Qualitative & quantitative measures of enforcement strictness (e.g. number of sanctions, level of monetary penalties, no. of inspectors)
Enforcement measures / de facto policy implementation stringency indicator
Policy response indicator
WEF (2013)
Over 140 developed and developing countries, various years
World Economic Forum’s Executive Opinion Survey
Small Island Developing States for the year 2008
Based on World Economic Forum’s Executive Opinion Survey
Kalamova & Johnstone (2011)
100 developed and developing countries, 2001-2007
World Economic Forum’s Executive Opinion Survey
Based on the WEF index
Kellenberg (2009)
50 developed and developing countries, 1999-2003
World Economic Forum’s Executive Opinion Survey
Based on the WEF index
Perception-based indicator of de jure (policy formulation) environmental stringency Perception-based indicator of de jure (policy formulation) environmental stringency Perception-based indicator of de jure (policy formulation) environmental stringency Perception-based indicator of de jure (policy formulation) environmental stringency
Policy response indicator Policy response indicator Policy response indicator Policy response indicator
Xing & Kolstad (2002) Contantini & Crespi (2008)
Madhoo (2013)
Index (EPI) Emissions of sulfur dioxide Emissions of carbon dioxide
WEF perception index (stringency of environmental regulation) WEF perception index (stringency of environmental regulation)
31
GGKP Working Paper 01|2015 Assemble their own database capturing changes in environmental laws over two decades based on national governmental sources and secondary sources from international organizations
Variations in water pollution and air pollution regulations through the use of dummies and continuous variables (e.g. number of cities with air and water pollution readings)
De jure policy formulation and/or implementation stringency (direct regulatory standards)
Policy response indicator
City-level sulfur dioxide emissions regulations (Two-Control Zones policy) for China, 1997-2003
Compile a database based on a mix of governmental and other secondary sources
Dummy variables capturing the application (or not) of the Two Control Zones Policies across 265 Chinese cities, as well as continuous variables reflecting the extent of sectoral exposure to stricter environmental regulations
De jure policy formulation and/or implementation stringency (direct regulatory standards)
Policy response indicator
Damania et al. (2003)
33 developed and developing countries, 1982-1992
Octel’s Worldwide Gasoline Survey (various years)
Variations in lead content of gasoline standards
Cole & Fredriksson (2009) and Cole et al. (2006)
33 developed and developing countries, 1982-1992
Octel’s Worldwide Gasoline Survey (various years)
Variations in lead content of gasoline standards
De jure policy formulation or implementation stringency (direct regulatory standards) De jure policy formulation or implementation stringency (direct regulatory standards)
Policy response indicator Policy response indicator
Broner et al. (2012)
101 developed and developing countries for the year 1996
World Bank Technical Report of Lowei (1998)
Variations in lead content of gasoline standards
De jure policy formulation or implementation stringency (direct regulatory standards)
Policy response indicator
Dechezleprêtre et al. (2012)
Around 50 developed and developing countries (automobile sector), 1992-2007
Based on data originally constructed by Perkins & Neumayer (2012)
Changes in EURO emissions standards
De jure policy formulation or implementation stringency (direct regulatory standards)
Policy response indicator
Around 130 developed and developing countries
Constructs their own data sets of dummies and based on MEA websites, World Resource Institute indicators, and WEF data
Signing of multilateral environmental agreements; membership of environmental international organizations
Measures of international environmental cooperation / de jure policy formulation stringency indicator
Policy response indicator
Greenstone & Hanna (2014)
Hering & Poncet (2014)
Neumayer (2002)
City-level air and water pollution regulations for India, 1986-2007
32
Measuring Environmental Action and Economic Performance in Developing Countries
References Afsah S, Blackman A, Garcia JH and T Sterner (2013) “Environmental Regulation and Public Disclosure: The case of PROPER in Indonesia”, RFF Press, Routledge. Alberini A (2001) “Environmental regulation and substitution between sources of pollution: an empirical analysis of Florida’s storage tanks”, Journal of Regulatory Economics 19(1): 55-79. Albrizio S and T Koźluk (2014) “Does Environmental Policy Stringency Affect Industry Productivity Growth?”, OECD Working Paper, Paper No. 1176. Alpay E, Buccola S and J Kerkvliet (2002) “Productivity growth and environmental regulation in Mexican and U.S. Food Manufacturing”, American J. of Agricultural Economics 84(4): 887-901. Ambec S, Cohen MA, Elgie S and P Lanoie (2011) “The Porter Hypothesis at 20: Can Environmental Regulation Enhance Innovation and Competitiveness?”, RF Discussion Paper 11-01, Washington DC: Resources for the Future. Barker T and S Scrieciu (2010) “Modelling Low Stabilization with E3MG: Towards a ‘New Economics’ Approach to Simulating Energy-Environment-Economy System Dynamics”, The Energy Journal 31(special issue 1 “The Economics of Low Stabilization”): 137-164. Berman E and LTM Bui (2001) “Environmental Regulation and Productivity: Evidence from Oil Refineries”, Review of Economics and Statistics 83(3): 498–510. Bloomsberg New Energy Finance (2013) “Climatescope 2013: New Frontiers for Low-Carbon Energy Investment in Latin America and the Caribbean”, Multilateral Investment Fund and Bloomsberg New Energy Finance. Botta, E. and T. Koźluk (2014), "Measuring Environmental Policy Stringency in OECD Countries: A Composite Index Approach", OECD Economics Department Working Papers, No. 1177, OECD Publishing, Paris. Böhringer C and PEP Jochem (2007) “Measuring the immeasurable - A survey of sustainability indices”, Ecological Economics 63(1): 1-8. Broner F, Bustos P and VM Carvalho (2012) “Sources of comparative advantage in polluting industries”, NBER Working Paper No. 18337, National Bureau of Economic Research, Massachusetts, MA, United States. Brunel C and A Levinson (2013) “Measuring Environmental Regulatory Stringency”, OECD Trade and Environment Working Papers, 2013/05, Organisation for Economic Co-operation and Development, Paris: OECD Publishing, Brunnermeier SB and MA Cohen (2003) “Determinants of environmental innovation of U.S. manufacturing industries”, Journal of Environmental Economics and Management 45: 278-293. Brunnermeier SB and A Levinson (2004) “Examining the Evidence on Environmental Regulations and Industry Location”, Journal of the Environment and Development 13(1): 6-41. Busse M and M Silberberger (2013) “Trade in pollutive industries and the stringency of environmental regulations”, Applied Economics Letters 20(4): 320-323. Cagatay S and H Mihci (2006) “Degree of environmental stringency and the impact on trade 33
GGKP Working Paper 01|2015
patterns”, Journal of Economic Studies 33(1): 30-51, Cao X and A Prakash (2012) “Trade Competition and Environmental Regulations: Domestic Political Constraints and Issue Visibility”, The Journal of Politics 74(1): 66-82. Caporale GM, Rault C, Sova R and A Sova (2010) “Environmental Regulation and Competitiveness: Evidence from Romania”, IZA Discussion Paper No.5029, Institute for the Study of Labor, Bonn, Germany. Carraro C, De Cian E, Nicita L, Massetti E and E Verdolini (2010) “Environmental Policy and Technical Change: A Survey”, International Review of Environmental and Resource Economics 4: 163–219. Chen M (2010) “Rule of Law and Environmental Policy Stringency”, ISIAC Working Paper 10-3, Institute for the Study of International Aspects of Competition, The University of Rhode Island, Kingston RI, USA. Cole MA and R Elliot (2003) “Do environmental regulations influence trade patterns? Testing old and new trade theories”, The World Economy 26(8): 1163-1186. Cole MA and PG Fredriksson (2009) “Institutionalized pollution havens”, Ecological Economics 68(4): 925-1274. Cole MA, Elliott RJR and PG Fredriksson (2006) “Endogenous pollution havens: Does FDI influence environmental regulations?” Scandinavian Journal of Economics 108(1): 157-178. Constantini V and F Crespi (2009) “Environmental regulation and the export dynamics of energy technologies”, Ecological Economics 66: 447-460. Copeland BR and MS Taylor (1995) “Trade and environment: a partial synthesis”, American Journal of Agricultural Economics 11: 765-71. Coria J (2009) “Environmental policies, fuel prices and the switching to natural gas in Santiago, Chile”, Ecological Economics 68: 2877-2884. Damania R, Fredriksson PG and JA List (2003) “Trade liberalization, corruption, and environmental policy formation: theory and evidence”, Journal of Environ Econ & Manag 46: 490–512. Damania R, Fredriksson PG and M Mani (2004) “The persistence of corruption and regulatory compliance failures: Theory and evidence” Public Choice 121: 363-390. Dasgupta S, Mody A, Roy S and D Wheeler (1995) “Environmental Regulation and Development: A Cross-Country Empirical Analysis”, World Bank Policy Research working paper No. 1448: 1–24. Dasgupta S, Wheeler D, Roy S and A Mody (2001) “Environmental Regulation and Development: A Cross-Country Empirical Analysis”, Oxford Development Studies 29(2): 173-87. de Santis R (2011) “Impact of environmental regulations on trade in the main EU countries: Conflict or Synergy?” ENEPRI Working Paper No. 56, European Network of Econ Policy Research Institutes. de Sherbinin A, Reuben A, Levy MA and L Johnson (2013) “Indicators in practice: how environmental indicators are being used in policy and management contexts”, New Haven & New York: Yale and Columbia Universities.
34
Measuring Environmental Action and Economic Performance in Developing Countries
de Vries FP and C Withagen (2005) “Innovation and Environmental Stringency: The Case of Sulfur Dioxide Abatement”, CentER Discussion Paper Series No. 2005-18, Tilburg University, Tilburg, The Netherlands. Dean JM (1992) “Trade and the Environment: A Survey of the Literature”, Background Paper for the World Development Report 1992, Policy Research Working Paper WPS 966, Washington DC: The World Bank. Dechezleprêtre A, Perkins R and E Neumayer (2012) "Regulatory distance and the transfer of new environmentally sound technologies: evidence from the automobile sector," Grantham Research Institute on Climate Change and the Environment Working Papers 73, Grantham Research Institute on Climate Change and the Environment. Dessus S, Roland-Hoist D and D van der Mensbrugghe (1994) "Input-based Estimates for Environmental Assessment in Developing Countries", OECD Development Centre Technical Papers No 87, Paris. Dincer OC and PG Fredriksson (2013) “Does trust matter? Corruption and environmental regulatory policy in the United States”, Edmond J. Safra Working Papers 28, Edmond J. Safra Center for Ethics, Harvard University, Cambridge MA. Ederington J and J Minier (2003) “Is environmental policy a secondary trade barrier? An empirical analysis”, Canadian Journal of Economics 36(1): 137-154. Eliste P and PG Fredriksson (2002) “Environmental regulations, transfers, and trade: Theory and evidence”, Journal of Environmental Economics and Management 43: 234-250. Emerson JW, Hsu A, Levy MA, de Sherbinin A, Mara V, Esty DC and M Jaiteh (2012) 2012 Environmental Performance Index and Pilot Trend Environmental Performance Index. New Haven: Yale Center for Environmental Law and Policy. ERG (2001) “Introduction to Stationary Point Source Emission Inventory Development”, Volume II, Chapter 1, Prepared for the U.S. Environmental Protection Agency, Eastern Research Group, Inc., Morisville, North Carolina. Escobar J and J Muñoz (1997) “Marco regulatorio e instrumentos de mercado de la política ambiental en Bolivia”, Working Paper 55/97, Unidad de Análisis de Politicas Sociales – UDAPSO, La Paz, Bolivia. Eskeland GS and AE Harrison (2003) "Moving to greener pastures? Multinationals and the pollution haven hypothesis", Journal of Development Economics 70: 1-23. Esty DC and ME Porter (2002) “Ranking national environmental regulation and performance: A leading indicator of future competitiveness?”, Chapter 2.1 in WEF (K Schwab, ME Porter and J Sachs) (2002) The Global Competitiveness Report 2001-2002, World Economic Forum, New York: Oxford University Press, pp 78-100. Esty DC, Levy M, Srebotnjak T, and A de Sherbinin (2005) 2005 Environmental Sustainability Index: Benchmarking National Environmental Stewardship. New Haven: Yale Center for Environmental Law & Policy. Esty DC, Levy MA, Srebotnjak T, de Sherbinin A, Kim CH and B Anderson (2006) Pilot 2006 Environmental Performance Index, New Haven: Yale Center for Environmental Law & Policy.
35
GGKP Working Paper 01|2015
Ewers RM, and RJ Smith (2007) “Choice of index determines the relationship between corruption and environmental sustainability”, Ecology and Society 12(1): r2. [online] URL: http://www.ecologyandsociety.org/vol12/iss1/resp2. Fischer C and RG Newell (2008) “Environmental and technology policies for climate mitigation”, Journal of Environmental Economics and Management 55: 142-162. Fredriksson PG, Mani M and JR Wollscheid (2006) “Environmental Federalism: A Panacea or Pandora’s Box for Developing Countries?” World Bank Policy Research Working Paper 3847, Washington DC: World Bank. Gray WB and RJ Shadbegian (1993) “Environmental regulation and manufacture productivity at the plant level”, NBER Working Paper Series No.4321, National Bureau of Economic Research, Massachusetts, MA, United States. Gray WB and JP Shimshack (2011) “The Effectiveness of environmental monitoring and enforcement: a review of the empirical evidence”, Review of Environmental Economics and Policy 5(1): 3-24. Green J and S Sánchez (2013) “Air Quality in Latin America: An Overview”, Washington DC: The Clean Air Institute. Greenstone M and R Hanna (2014) “Environmental Regulations, Air and Water Pollution, and Infant Mortality in India”, American Economic Review 104(10): 3038-3072. Greenstone M, List JA and C Syverson (2012) “The effects of environmental regulation on the competitiveness of U.S. manufacturing”, CEEPR WP 2012-013, MIT Center for Energy and Environmental Policy Research, A Joint Center of the Department of Economics, MIT Energy Initiative and MIT Sloan School of Management, Cambridge MA. Guidotti TL (2011) “Developing Countries and Pollution”, in A Yassi and T Kjellström (Eds) Chapter 53: Environmental Health Hazards, part of JM Stellman (Editor-in-Chief) Encyclopedia of Occupational Health and Safety, Geneva: International Labour Organization. Hascic I, de Vries F, Johnstone N and N Medhi (2009) “Effects of Environmental Policy on the Type of Innovation: The Case of Automotive Emissions Control Technologies”, OECD Journal of Economic Studies 1: 41-58. Hahn R W and PC Tetlock. (2008) “Has Economic Analysis Improved Regulatory Decisions?” Journal of Economic Perspectives 22: 67-84. Hamamoto M (2006) “Environmental regulation and the productivity of Japanese manufacturing industries”, Resource and Energy Economics 28: 299-312. Harris M, Konya L and L Matyas (2003) “Modelling the impact of environmental regulations on bilateral trade flows: OECD, 1990- 1996” World Economy 25(3): 387-405. Hering L and S Poncet (2014) “Environmental policy and exports: Evidence from Chinese cities”, Journal of Environmental Economics and Management 68(2): 296-318. Horbach J (2008) “Determinants of environmental innovation: New evidence from German panel data sources”, Research Policy 37: 163-173.
36
Measuring Environmental Action and Economic Performance in Developing Countries
Hranova R (Ed.) (2006) Diffuse pollution of water resources: principles and case studies in the Southern African region, London: Taylor & Francis Group plc. Husted BW and JM Logsdon (1997) "The Impact of NAFTA on Mexico's Environmental Policy", Growth and Change 28: 24-48. ILO (2012) “Working towards sustainable development: Opportunities for decent work and social inclusion in a green economy”, International Labour Office: Geneva. Isik M (2004) “Environmental regulation and the spatial structure of the U.S. dairy sector”, Amer. J. Agr. Econ. 86(4): 949-962. Jaffe AB and K Palmer (1997) “Environmental regulation and innovation: a panel data study”, The Review of Economics and Statistics 79(4): 611-619. Jeppesen T and H Folmer (2001) “The Confusing Relationship between Environmental Policy and Location Behavior of Firms: A Methodological Review of Selected Case Studies”. Annals of Regional Science 35: 523–546. Jeppesen T, List JA and H Folmer (2002) “Environmental regulations and new plant location decisions: evidence from a meta-analysis”, Journal of Regional Science 42(1): 19-49. Johnstone N, Hascic I and D Popp (2010) “Renewable energy policies and technological innovation: evidence based on patent counts”, Environ Resource Econ 45: 135-155. Kalamova M and N Johnstone (2011) “Environmental Policy Stringency and Foreign Direct Investment”, OECD Environment Working Papers, No. 33, OECD Publishing. Kellenberg D (2009) “An empirical investigation of the pollution haven effect with strategic environment and trade policy”, Journal of International Economics 78(2): 242-255. Koźluk T and V Zipperer (2014) “Environmental Policies and Productivity Growth: A Critical Review of Empirical Findings”, OECD Journal Economic Studies, OECD Publishing, vol 2014(1): 1-32. Krutilla K (1999) “Environmental Policy and Transactions Costs”, in CJM Jeroen and Van den Bergh (Eds.) Handbook of Environmental and Resource Economics, Cheltenham, U.K.: Edgar Elgar. Krutilla K and R Krause (2011) “Transaction costs and environmental policy: an assessment framework and literature review”, International Review of Environmental and Resource Economics 4(3-4): 261-354. Kunce M, Gerking S and W Morgan (2002) “Effects of environmental and land use regulation in the oil and gas industry using the Wyoming Checkerboard as an experimental design”, The American Economic Review 92(5): 1588-1593. Lanjouw JO and A Mody (1996) “Innovation and the international diffusion of environmentally responsive technology”, Research Policy 25(4): 549-571. Larson BE, Nicolaides E, al Zu’bi B, Sukkar N, Laraki K, Matoussi MS, Zaim K and C Choucani (2002) “The Impact of Environmental Regulations on Exports: Case Study Results from Cyprus, Jordan, Morocco, Syria, Tunisia, and Turkey”, World Development 30(6): 1057-1072. Levinson A (2000) “An industry-adjusted index of state environmental compliance costs”, Chapter 4 in C Carraro and GE Metcalf (Eds.) Behavioral and Distributional Effects of Environmental Policy, 37
GGKP Working Paper 01|2015
National Bureau of Economic Research Conference Report, Chicago: University of Chicago Press, 31-158. Levinson A (2008) “Pollution Haven Hypothesis”, entry in SN Durlauf and LE Blume (Eds.) New Palgrave Dictionary of Economics, 2nd edition, Palgrave Macmillan. Levinson A and MS Taylor (2008) “Unmasking the Pollution Haven Effect”, International Economic Review 49(1): 223–254. Madhoo YN (2013) “Political economy of environmental regulation and performance: Some empirical results from SIDS”, Procedia Economics and Finance 5: 532-541. Mani M (2012) “Assessing the Investment Climate for Climate Investments: A Comparative Framework for Clean Energy Investments in South Asia in a Global Context”, Policy Research Working Paper 6211, The World Bank, Washington D.C. Millimet DL and J Roy (2011) “Three New Empirical Tests of the Pollution Haven Hypothesis When Environmental Regulation is Endogenous”, IZA Discussion Paper No. 5911, Institute for the Study of Labor, Bonn, Germany. Morse S and EDG Fraser (2005) “Making ‘dirty’ nations look clean? The nation state and the problem of selecting and weighting indices as tools for measuring progress towards sustainability”, Geoforum 36: 625-640. Mulatu A, Florax RJGM and CAAM Withaagen (2001) “Environmental regulation and competitiveness”, TI Discussion Paper 2001-039/3, Amsterdam & Rotterdam: The Netherlands: Tinbergen Institute. Neumayer E (2002) “Do democracies exhibit stronger international environmental commitment? A cross-country analysis”, Journal of Peace Research 39(2): 139-164. OECD (1994) Environmental Indicators, Paris: Organisation for Economic Co-operation and Development. OECD (2003) OECD Environmental Indicators: Development, Measurement and Use, Paris: Organisation for Economic Co-operation and Development. OECD (2006) “Environmental Compliance and Enforcement in China: An Assessment of Current Practices and Ways Forward”, Paris: Organisation for Economic Co-operation and Development. OECD (2012) Greening Development: Enhancing Capacity for Environmental Management and Governance, Paris: Organisation for Economic Co-operation and Development. OECD (2013) Putting Green Growth at the Heart of Development, Organisation for Economic Cooperation and Development, Paris: OECD Publishing. Ollinger M, Aspelin A and M Shields (1998) “US Regulation and New Pesticide Registrations and Sales”, Agribusiness 14(3): 199-212. Pargal S and D Wheeler (1996) “Informal Regulation of Industrial Pollution in Developing Countries: Evidence from Indonesia”, Journal of Political Economy 104(6): 1314-1327.
38
Measuring Environmental Action and Economic Performance in Developing Countries
Pargal S and M Mani (2000) “Citizen Activism, Environmental Regulation, and the Location of Industrial Plants: Evidence from India”, Economic Development and Cultural Change 48(4): 829846. Pellegrini L and R Gerlagh (2006) “Corruption, Democracy, and Environmental Policy: An Empirical Contribution to the Debate”, The Journal of Environment & Development 15(3): 332-354. Popp D (2006) “International innovation and diffusion of air pollution control technologies: the effects of NOx and SO2 regulation in the US, Japan, and Germany”, Journal of Environmental Economics & Management 51:46-71. Popp D (2010) “Exploring the Link between Innovation and Diffusion: Adoption of NOx Control Technologies and U.S. Coal fired Power Plants”, Environmental and Resource Economics 45: 319352. Porter, ME and C van der Linde (1995) "Toward a New Conception of the EnvironmentCompetitiveness Relationship," Journal of Economic Perspectives 9(4): 97–118. Rassier DG and D Earnhart (2010) “Does the Porter hypothesis explain expected future financial performance? The effect of clean water regulation on chemical manufacturing firms”, Environ Resource Econ 45: 353-377. Ratnayake R (1998) “Do Stringent Environmental Regulations Reduce International Competitiveness? Evidence from an Interindustry Analysis”, International Journal of the Economics of Business 5(1): 77-96. Rose AK and MM Spiegel (2009) “Noneconomic engagement and international exchange: the case of environmental treaties”, Journal of Money, Credit, and Banking 41(2-3): 337-363. Sánchez-Triana E, Vásquez CU and A Mejía (2006) “Environmental Degradation”, Chapter 19 in Fretes-Cibils V, Giugale M and C Luff (Eds.) Bolivia: Public Policy Options for the Wellbeing of All, The International Bank for Reconstruction & The World Bank, Washington D.C., p. 421. Sauvage J (2014), “The Stringency of Environmental Regulations and Trade in Environmental Goods”, OECD Trade and Environment Working Papers, No. 2014/03, OECD Publishing, Paris. Shimshack JP and MB Ward (2005) “Regulator reputation, enforcement, and environmental compliance”, Journal of Environmental Economics & Management 50: 519-540. Stavins RN (2003) “Experience with Market-Based Environmental Policy Instruments”, Handbook of Environmental Economics 1 (Environmental Degradation and Institutional Responses): 355-435. Stewart LA (2010) The Impact of Regulation on Innovation in the United States: A Cross-Industry Literature Review, Paper commissioned by the Institute of Medicine Committee on Patient Safety and Health IT, Washington DC. Tan X, Zhao Y, Polycarp C and J Bai (2013) “China’s Overseas Investments in the Solar and Wind Industries: Trends and Drivers”, WRI Working Paper, World Resources Institute, Washington D.C. Taylor MR, Rubin ES and DA Hounshell (2003) “Effect of Government Actions on Technological Innovation for SO2 Control”, Environmental Science & Technology 37(20): 4527-4534. Tarlock AD (2010) “Environmental Law: Then and Now”, Washington University Journal of Law and Policy 32(1):1-31. 39
GGKP Working Paper 01|2015
Tobey JA (1990) “The effects of domestic environmental policies on patterns of world trade: an empirical test”, Kyklos 43(2): 191-209. Tsai DH (2002) “Environmental policy and technological innovation: evidence from Taiwan manufacturing industries”, National Sun Yat-Sen University. U.S. Census Bureau (2013) “Pollution Abatement Costs & Expenditures Survey”, United States Census Bureau, U.S. Department of Commerce; [url: https://www.census.gov/econ/overview/mu1100.html] accessed 14 July 2014. U.S. Environmental Protection Agency (2014) “Pollution Abatement Costs and Expenditures: 2005 Survey”, National Center for Environmental Economics, United States Environmental Protection Agency [url: http://yosemite.epa.gov/EE%5Cepa%5Ceed.nsf/webpages/pace2005.html]; accessed 14 July 2014. Van Beers C and JCDJ van den Bergh (1997) “An empirical multi-country analysis of the impact of environmental regulations on foreign trade flows”, KYKLOS 50(1): 29-46. Van Soest DP, List JA and T Jeppesen (2006) “Shadow prices, environmental stringency, and international competitiveness”, European Economic Review 50(5): 1151-1167. Wackernagel M and W Rees (1996) Our Ecological Footprint: Reducing Human Impact on the Earth, Gabriola Island, BC: New Society Publishers. Wackernagel M, Schulz NB, Deumling D, Linares AC, Jenkins M, Kapos V, Monfreda C, Loh J, Myers N, Norgaard R and J Randers (2002) “Tracking the ecological overshoot of the human economy”, Proc. Natl. Acad. Sci. U.S.A. 99(14): 9266-71. Wagner M (2003) “The Porter hypothesis revisited: a literature review of theoretical models and empirical tests”, Centre for Sustainability Management, Universität Lüneburg, Lüneburg, Germany. Walter I and J Ugelow (1979) “Environmental policies in developing countries”, Ambio 8: 102-109. WEF (2001) “2001 Environmental Sustainability Index 2001”, An Initiative of the Global Leaders for Tomorrow Environment Task Force, 2001, Word Economic Forum in collaboration with Yale Center for Environmental Law and Policy, Yale University and Center for International Earth Science Information Network, Columbia University, Geneva, Switzerland. WEF (2013) “The Travel & Tourism Competitiveness Report 2013: Reducing Barriers to Economic Growth and Job Creation”, J Blanke and T Chiesa (Eds.), World Economic Forum, Geneva, Switzerland. Welsch H (2004) “Corruption, growth, and the environment: a cross-country analysis”, Environment and Development Economics 9(5): 663-693. World Bank (1999) Greening industry - new roles for communities, markets, and governments, Volume 1, World Bank 1999/10/31, Washington, D.C. World Bank (2008) “International Trade and Climate Change: Economic, Legal, and Institutional Perspectives”, The International Bank for Reconstruction and Development / The World Bank, Washington, D.C. Xing Y and CD Kolstad (2002) “Do lax environmental regulations attract foreign investment?”
40
Measuring Environmental Action and Economic Performance in Developing Countries
Environmental and Resource Economics 21: 1-22. Xu X (2000) “International Trade and Environmental Regulation: Time Series Evidence and Cross Section Test”, Environmental and Resource Economics 17: 233-257.
41
Green Growth Knowledge Platform International Environment House 11-13 chemin des Anémones 1219 Châtelaine/Geneva , Switzerland Email:
[email protected] Website:www.greengrowthknowledge.org Connect with the GGKP through: twitter.com/GGKPlatform bit.ly/linkedinGGKP youtube.com/user/GGKPlatform flickr.com/photos/ggkp Subscribe to the GGKP Knowledge Update: bit.ly/KnowledgeUpdate