has 1 ps resolution and can acquire a complete loading (impact) event in as little as 4 ms. The f terms or values annoted by "*" refer to parameters of the foam, ...
1
J
SAND97-8490 UC-404 Unlimited Release Printed March 1997
Mechanical Properties and Energy Absorption Characteristics of a Polyurethane Foam
S. H. Goods, C. L. Neuschwanger, C. Henderson, D. M. Skala
DISCLAIMER This report was prepared as a n account of work sponsored by a n agenq of the United States Government. Neither the United States Government nor any agency thereof, nor any of their employees, make any warrantyyexpress or impIied, or assumes any legal liability or responsibility for the accuracy, completeness, or usefulness of any information, apparatus, product, or process disdased, or represents that its use would not infringe privately owned rights. Reference herein to any specific commercial product, process, or service by trade name, trademark, manufacturer, or otherwise does not necrsariiy constitute or impIy its endorsement, recommendation, or favoring by the United States Government or any agency thereof. The views and opinions of authors expressed herein do not necessarily state or reflect those of the United States Government or any agency thereof.
DISCLAIMER
Portions of this document may be illegible in dectmnic image products. Images are produced from the best av8iI8bje original
document.
SAND 97-8490 Unlimited Release Printed March 1997
UC-404
MECHANICAL PROPERTIES AND ENERGY ABSORPTION CHARACTERISTICS OF A POLYURETHANE FOAM
S. H. Goods Materials Reliability Department C. L. Neuschwanger, C. Henderson, and D. M. Skala Polymer and Electrochemical Technologies Department Sandia National Laboratories/California
ABSTRACT Tension, compression and impact properties of a polyurethane encapsulant foam have been measured as a function of foam density. Significant differences in the behavior of the foam were observed depending on the mode of testing. Over the range of densities examined, both the modulus and the elastic collapse stress of the foam exhibited power-law dependencies with respect to density. The power-law relationship for the modulus was the same for both tension and compression testing and is explained in terms of the elastic compliance of the cellular structure of the foam using a simple geometric model. Euler buckling is used to rationalize the density dependence of the collapse stress.
0
Neither tension nor compression testing yielded realistic measurements of energy absorption (toughness). In the former case, the energy absorption characteristics of the foam were severely limited due to the inherent lack of tensile ductility. In the latter case, the absence of a failure mechanism led to arbitrary measures of energy absorption that were not indicative of true material properties. Only impact testing revealed an intrinsic limitation in the toughness characteristics of the material with respect to foam density. The results suggest that dynamic testing should be used when assessing the shock mitigating qualities of a foam.
3
ACKNOWLEDGMENT The authors wish to acknowledge the efforts of numerous colleagues for their support during the course of this study. In particular, we thank John Tan (8230) for the fabrication of much of the sample material, and Rafael Davalos (2254) and John Krafcik (8240) for their assistance in generating the schematic representations of the cell structures
4
,
,
..
..
CONTENTS Paee
I. Introduction ........................................................................................................................
7
I1. Experimental.......................................................................................................................
9
Formulation of CRETE Foam System .......................................................................
9
Processing CRETE Foam System..............................................................................
10
Mechanical Testing......................................................................................................
10
I11. Results and Discussion .......................................................................................................
13
Tension........................................................................................................................
13
Compression ...............................................................................................................
14
Impact Testing.............................................................................................................
20
IV . Relationship Between the Structure of Foams and Mechanics of Deflection ......................
25
Modulus......................................................................................................................
25
Elastic Collapse ...........................................................................................................
30
Energy Absorption ......................................................................................................
31
V . Conclusions ........................................................................................................................
21
Energy Absorption Characteristics of the Foam System ............................................
33
Structure Dependence of Modulus and Collapse Stress ..............................................
33
VI. References ...........................................................................................................................
34
DISTRIBUTION ........................................................................................................................
35
5
ILLUSTRATIONS Pape
No,
1. Specimen Geometries.........................................................................................................
11
2. Energy Absorption or Toughness from Stress-Strain Curves ............................................
12
3. Comparison of Tensile Behavior Comparison for Five Tests.............................................
13
4. Modulus vs. Density (from Tension Testing).....................................................................
14
5. Energy Absorption (from Tension Testing) .......................................................................
15
6. Compression Behavior of Foam Specimen........................................................................
16
7. Comparison of Tensile and Compression Behavior ...........................................................
17
8. Compression Behavior .......................................................................................................
18
9. Modulus vs.Density (from Tension and Compression Testing)........................................
18
10. Elastic Collapse Stress vs. Density .....................................................................................
19
11. Energy Absorption for Tension and Compression Tests......................................... 12. 13. 14. 15.
16. 17. 18. 19.
20.
.......... 20 21 Strain Rate Effects on Compression Behavior.................................................................... 22 Stress and Energy Absorption from Impact Testing .......................................................... 23 Strength vs. Density ............................................................................................................ Energy Absorption vs .Density (from Impact Testing) ...................................................... 24 Simplified Unit Cell for an Open Cell Foam ...................................................................... 26 27 Unit Cell After Deflection ................................................................................................... Unit Cell for a Closed Cell Foam........................................................................................ 29 Measured Moduli vs .Equation 9........................................................................................ 30 Elastic Collapse Stress vs .Equation 13 .............................................................................. 32 TABLES
No.
PaFe
I. Selected Formulations for Foam Specimens ......................................................................
10
I1. Effect of Strain Rate on Properties of Crete Foam..............................................................
21
6
. .
..
.
\
.. ..
.
. . . . .
.
. .
MECHANICAL PROPERTIES AND ENERGY ABSORPTION CHARACTERISTICS OF A POLYURETHANE FOAM I. Introduction Polyurethane foams are used as encapsulants for electronic components to mitigate harsh thermal and mechanical shock environments and to provide electrical isolation. Historically, a principal constituent of these foam systems ( e g , BKC 44402) has been toluene diisocyanate (TDI), a suspect human carcinogen. DOE has directed that attempts be made to replace materials containing such suspect human carcinogens. To that end, the CRETE foam system was developed, based on the work done by Peter Rand of SNL/NM (Org. 1811) on a non-TDI encapsulation foam (BKC 44320) and on a non-TDI structural foam system adapted for encapsulation use by Tom Neet of AS/FM&T (BKC 44307).( 1) It is this new foam system that is the subject of this report. The SNL/NM system, BKC 44320, uses the polyester polyol component found in the older TDI systems and a quasi-prepolymer made from polymeric methylene diisocyanate (PMDI). PMDI has a vapor pressure that is more than a thousand-fold lower than TDI, making it easier to keep airborne levels of isocyanate below 0.005 ppm, the Threshold Limit Value for methylene diisocyanate (MDI), the major component of PMDI. The AS/FM&T foam, BKC 44307, is also based on PMDI but uses a polyether polyol. The PMDI and polyether constituents of the BKC 44307 have a higher functionality than the constituents of either BKC 44402 or BKC 44320. The higher functionality of the BKC 44307 components results in a higher degree of cross-linking, yielding a stiffer, but more brittle foam than is the case for either the original BKC 44402 series or the BKC 44320 system. Both the TDI and PMDI systems use added water as a chemical blowing agent. Reaction of the water with isocyanate produces carbon dioxide that expands the foam. No physical blowing agents are used. A major processing requirement for any high density encapsulation foam (0.1 - 0.5 g/cm3) is that the rising foam system remain liquid-like for a long enough time to fill the entire mold volume and to wet out all of the components of the electronic assembly completely. Foam systems that gel considerably before reaching full expansion are clearly less desirable for encapsulation uses. For foams with a short “time to gel” (the curing reaction time) to “time to full rise” (the blowing reaction time) ratio, the amount of expansion that can occur after gelling depends on the temperature of the reaction mix and thus on the size of the pour. For example, it is often the case for small pours (often encountered in encapsulation applications), that the reaction temperature remains low. In such instances, the gel-to-rise time ratio is found to be considerably less than one and the foam is unable to expand completely after gelling to fill the mold. Experience has shown that foams with gel-to-rise ratios closer to unity are desired for small encapsulation applications. Catalysts are usually added to balance the gelling and blowing reactions and give gel-to-rise ratios slightly less than one, often at the expense of reduced processing time or pot life. Both PMDI
7
systems, BKC 44307 and BKC 44320, therefore, employ tertiary amine catalysts, which were unnecessary in the TDI system, BKC 44402. In actual use, however, the BKC 44320 and BKC 44307 systems have been found to be fast rising foams with relatively low gel-to-rise ratios. The formulation challenge for the CRETE program was to develop a foam system with processing times and mechancial and physical properties comparable to the original TDI system, BKC 44402. To delay the gel reaction and provide a more favorable gel-to-rise ratio, the functionality of the isocyanate components was lowered to 2.1 by the use of modified-MDI (MMDI) instead of the higher functionality PMDI components (2.3 to 2.7). The use of MMDI in CRETE foam also eliminated the need for a quasi-prepolymer employed in the 44320 and 44307 systems. Small amounts of tertiary amine catalyst, Polycat 17, were used to tailor the gel-to-rise ratio further and to optimize the processing of CRETE foam for encapsulation of electronic components. A detailed report describing the formulation and processing of CRETE is to be issued.(2) Characterization of the tension, compression, and impact properties of the CRETE foam system was necessary before the foam could be used for weapon system application. The purpose of this work was three-fold. Our first goal was to measure the conventional “quasi-static” tensile and compressive mechanical properties of CRETE. Our second goal was to compare the energy absorption characteristics that can be derived from those measurements to a direct measure of energy absorption under high rate, impact conditions which may be more realistic of service environments. Lastly, the quasi-static measurements of elastic modulus and elastic collapse stress are reported and are related to the mechanics of cellular deformation. The results and conclusions from the experiments described here are being used as a basis for improving the physical and mechanical properties of non-TDI polyurethane foams and for comparison to existing foams that are used for encapsulation purposes.
8
11. Experimental
Formulation of CRETE Foam System The components of CRETE rigid polyurethane foam are:
- Voranol490:
A polyether polyol, made from polypropylene oxide and a sucrose/glycerin base, available from Dow Chemical. The manufacturer specifies the following properties: Density (25 "C) Typical hydroxyl number Functionality Average Molecular Weight Viscosity (25 "C)
0.1 1 kg/cm3 490 mg KOH equiv/g of resin 4.3 (calculated) 460 g/mole 5572 cps
- DC193:
A silicone glycol copolymer surfactant from Air Products with an average hydroxyl number of 75.
- Polycat 17:
A tertiary amine catalyst (trimethyl-N-hydroxyethyl propylene diamine) available from Air Products with an average hydroxyl number of 400.
- Distilled water:
Added in various amounts as a chemical blowing agent producing carbon dioxide.
- Isonate 143L
A modified methylene diisocyanate (MMDI) available from Dow Chemical. manufacturer specifies the following properties for Isonate 143L Isocyanate Equivalent Weight NCO Content by Weight Functionality Viscosity (25 "C)
The
144.5 g 29.2 % 2.1 33 cps
The density of the CRETE foam system is varied by changing the amount of added water, thereby controlling the amount of rise in the foam. The amount of catalyst and surfactant are also varied slightly to optimize processing and foam properties. A semi-empirical model has been developed to determine the near-optimum amounts of catalyst and surfactant as a function of density and will be described in a subsequent SAND report on the formulation of non-TDI encapsulant foam systems.(2) A spreadsheet program that uses these semi-empirical relations to derive a CRETE formula based on a desired part density and size was used to determine the specific sample CRETE formulas tested in this study. Examples of some, but not all, of the actual formulations used in the present work on the following page. 9
... .
TABLE I: SELECTED FORMULATIONS FOR FOAM SPECIMENS
I Isonate 143L
* parts per hundred resin
I
152.2 D h r I 146.0 D h r I
142.6 D h r I
140.5 Dhr I
138.0 Dhr I
The above formulas assume a packing factor of 1.75 (packed density/free rise density) and an isocyanate index of 105 (5% excess of isocyanate groups). The free rise density is measured for a 100 gram sample poured from a 200 gram batch of CRETE foam expanding in a 500 ml polyethylene cup. The free rise density depends on the temperature of the reaction and thus will vary slightly depending on the size of the batch.
Processing CRETE Foam System . CRETE foam samples were generated by the addition of the isocyanate component (Isonate 143L) to the polyol component premixed with DC193, Polycat 17, and water. The resulting reaction mixtures were stirred at 1500 rpm for 60 seconds using a Conn mixing blade (51 mm diameter). The mixed products were then poured into cylindrical molds at room temperature. The molds were lightly waxed with a non-silicone mold release. The molds were then closed, and the foam was allowed to expand to fill the closed molds at a packed density approximately 1.75 times the expected free rise density. The reaction times for the CRETE system are generally less than eight minutes from the time of complete mixing. The samples were post-cured in an oven for a minimum of eight hours at 66 "C. Right circular samples of foam were cored from the molded samples with the cylinder axis parallel to the direction of the foam rise. None of the core samples included the foam skin or any material less than 3 mm below the surface. The density of each foam core was measured and was usually slightly less than the density of the entire sample including the foam skin. These cored samples were used in the mechanical testing reported below. Mechanical Testing Room temperature uniaxial tension and compression mechanical properties were evaluated as a function of foam density using a conventional Instron mechanical test frame. Most tests were conducted at an initial strain rate of 1.7 x lo4 6'. Some tests were run at rates between 1.7 x and 1.7 x lo'*s-' in order to examine strain rate affects. All specimens were instrumented with a mechanically attached extensometer for displacement measurement. Tension and compression specimens are shown in Figure 1. The tension specimens had a gage length of 25.4 mm and a reduced gage diameter of 19.0 mm and were bonded to steel pull studs. The reduced gage section insured that failure occurred within the specimen between the attachment points of the extensometer and not at the bondline between the foam and the pull studs. The compression specimens were simple, right circular cylinders 50.8 mm long and 28.7 mm in diameter. 10
Figure 1. Specimen geometries used in this study. (a) Tension specimen had a 25.4 mm gage length with a 19.0 mm reduced gage diameter. Steel pull studs were bonded to the specimen ends for mounting in the test frame. (b) Compression and impact specimens were simple free standing right cylinders 50.8 mm long and 28.7 mm in diameter. Mechanical properties were measured for foam densities between 0.12 g/cm3and 0.61 g/cm3. For tension testing, modulus (E*)f,ultimate tensile strength (UTS) and energy absorptionhit volume (toughness) were measured. The latter parameter was calculated as the area under the tensile stress-strain curve (see Figure 2). For compression testing where macroscopic fracture did not occur, tests were run to engineering strains of approximately 0.3 (30%). Strength and energy absorption at 0.1 (10%) strain were recorded for comparison. An additional parameter for compression testing, the elastic collapse stress, O*el, a broad plateau region subsequent to linear loading, was also measured. Specimens for impact testing had the same geometry as the compression specimens. These tests were conducted on a DynatupB Model 8250 drop weight impact tester coupled to a digital data acquisition and analysis system. The test frame can be operated in either gravity mode or with pneumatic assist. In the former case up to 300 J of energy can be delivered to a test specimen while in the latter case up to 840 J can be delivered with impact velocities of up to 13.4 d s . The high speed data acquisition system, which records the output of an instrumented tup (load cell), has 1 ps resolution and can acquire a complete loading (impact) event in as little as 4 ms. The terms or values annoted by "*" refer to parameters of the foam, other terms annotated by parameters related to the solid polymer.
f
11
"s'7
refer to
software analyses the deceleration of the crosshead between successive data points from which it determines the instantaneous velocity. Energy absorption of a test specimen is then determined by knowing the instantaneous force (from the tup) and the integration of the time rate of change of the velocity of the crosshead as the specimen is compressed.
ENERGY ABSORPTION
or
TOUGHNESS
Strain Figure 2. Schematic illustration of the calculation of toughness or energy absorption from elLllera tension or compression stress-strain curve. The energy absorption is the area under the curve either to the point of failure or to some pre-determined strain value.
111. Results and Discussion Tension Figure 3 shows a series of tensile tests for foam specimens having a density of 0.24 g/cm'. For any given material condition (density), test results are quite reproducible. The modulus (defined as the slope of the linear loading portion of the stress strain curve) for the five tests shown in Figure 3 is 159.0 k10.5 MPa. The ultimate tensile strength of the foam is 3.76 f 0.07 MPa while the fracture strain is 0.039 k 0.003. The energy absorption of this density foam was derived from the area under the stress-strain curves as described above and found to be 0.095 f 0.012 J/cm3. This general reproducibility was typical of all tension and compression testing.
5 -' ~ " " " r ~ ~ ' l ' ' ' TENSILE BEHAVIOR p* = 0.24 g/cm3 Strain rate = 1.7 x 4 --
s-' -
-
-
-
-
-
Comparison of 5 tests 0
0
0.02
,
I
0.04
0.06
,
,
,
l
0.08
,
,
,
0.1
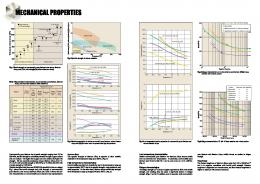
Strain Figure 3. Comparison of five tensile curves for foam specimens, p* = 0.24 g/cm3. The modulus as a function of foam density is shown in Figure 4. Modulus of the foam exhibits a power-law dependence with respect to the density of the form :
E* = (p *)n
(1) where E* is the modulus of the foam, p* is the foam density and n is the density exponent. It will be shown later that there are sound theoretical reasons to not consider the density exponent as a constant over all possible foam densities. However, over the range of density shown in Figure 4, the data are well fit for a density exponent of n = 1.6. 13
500
400
300 200 100
o"""""l""l""l""l""' 0
0.1
0.3
0.2
0.4
0.5
0.6
Density (g/cm3) Figure 4. Foam modulus exhibits a power-law dependence with respect to density. Energy absorption of the material is determined as the area traced out by the stress-strain curves as described in the Experimental Section. Figure 5 shows the results for the tension testing over the entire range of foam densities examined. The results indicate that energy absorption of the material increases linearly with increasing foam density. Values range from a low of 0.04 J/cm3 for foam with a density of 0.104 g/cm3 to 0.16 J/cm3 for foam having a density of 0.39 g/cm3. It will be shown that the energy absorption values are quite low compared to other methods of testing. The energy absorption values obtained via tensile testing are controlled entirely by the brittle nature of the material in tension and therefore ought not be used to characterize the intrinsic crush capabilities of the material. However, it should be noted that energy absorption values derived from tension data may have validity in certain unique environments where tensile loading is important.
Compression Figure 3 reveals that the foam is quite brittle in tension - there is little or no macroscopic yielding in tension prior to fracture. Because of the inherent lack of tensile ductility, it is clear that tension testing is not the most appropriate method for evaluating the mechanical properties of a material whose primary mechanical requirement is compressive shock mitigation and energy absorption.
14 . . r
.
-
0.3
l
*€
l
~
l
l
l
l
~
l
l
l
l
~
l
l
i
l
~
l
l
l
,
~
i
i
,
1 ENERGY ABSORPTION
Q)
0.2 -
*
0.1
P
l
- vs - DENSITY
n
J W
l
-
Q)
S
W
0
0
0.1
0.3
0.2
0.4
0.5
0.6
Density (g/cm3) Figure 5. Energy absorption as a function of density for tensile tests. The results indicate that energy absorption of the material increases linearly with increasing foam density. A companion series of compression tests were performed on the material to determine the energy absorption characteristics under somewhat more realistic conditions. A typical compression test is shown in Figure 6 for a foam having a density of 0.15 g/cm3. In compression, the foam specimens show relatively abrupt yielding followed by a sustained plateau region. At the lower densities, such as that shown in Figure 6, the stress after the plateau actually drops, giving rise to a yield point-like behavior. The broad plateau region results from the elastic collapse or cell wall buckling of the foam.(3) The stress begins to increase subsequent to this plateau region as the foam begins to densify. Unlike the tests performed in tension, fracture is inhibited by the absence of tensile stresses and as a result, engineering strains in excess of 50% have been measured with little observable indication of fracture. In order to expedite testing, compression strains were limited to 0.3 which was sufficient to characterize the modulus and plateau stress values for each specimen. Mechanical properties during the early stages of compression are essentially identical to those observed in tension. Figure 7 compares the tension and compression behavior for a foam having a density of 0.24 g/cm3. Both tests were conducted at the same strain rate. The curves overlay up until the point of tensile failure, suggesting that the microstructural processes governing elastic deformation and low strain response in both tension and compression are identical.
15
l
2.5
,
1
1
4
,
I
,
,
,
I
,
,
0
1
,
1
1
1
1
,
l
,
i
,
,
I
,
-- COMPRESSION BEHAVIOR - p* = 0.15 g/cm3
0.5
0 0
0.05
0.1
0.15
0.2
0.25
0.3
0.35
Strain Figure 6. Typical compression test results for a foam having a density of 0.15 g/cm3. A relatively abrupt yield point is followed by a sustained plateau region. The stress begins to increase subsequent to this plateau region as the foam begins to densify. For a given foam density, tests performed in compression were found to have the same general reproducibility as that found for tests performed in tension. As an example, Figure 8 shows the results for duplicate tests on a foam having a density of 0.26 g/cm3. Note that for all compression testing, absorption energy is calculated at a constant reference strain equal to 0.10 (10%). Because of this, the energy absorption values for compression testing do not reflect intrinsic material properties. Rather, they are useful only as a means to compare toughness characteristics as a function of density. Moduli, derived from the compression tests, as a function of foam density are shown in Figure 9. In this figure, the compression moduli are superimposed on the data shown in Figure 4. It is clear that compression testing yields the same moduli as tensile testing. When all of the data are fit to a power-law relationship, the density exponent, n, is still equal to 1.6, as it was for the tension only moduli in Figure 4.
16
COMPARISON OF TENSILE & COMPRESSION BEHAVIOR
0
0.02
0.04
0.06
0.08
0.1
Strain Figure7. Tension and compression behavior for foam specimens of the same density (0.24 g/cm3). Compression trace overlays a companion tension test up to the point of tensile failure. Figure 10 shows the plateau stress for the foam specimens as function of density. This plateau stress, also called the elastic collapse stress, O*e,, is important in the design of cushions for shock or impact mitigation as it represents the onset of the mechanical instability of the foam microstructure(3). It too, exhibits a power-law dependence with respect to foam density although somewhat higher than the density exponent for the modulus.
The energy absorption of the foam vs. density up to the reference strain of 0.1 is shown in Figure 11 along with the data from Figure 5 for tension testing. Values range from a low of 0.10 J/cm3 for foam with a density of 0.12 g/cm3to 1.20 J/cm3 for foam having a density of 0.495 g/cm3. It is clear that total energy absorption capacity of the foam in compression far exceeds that in tension for the entire range of density examined. The comparison would be even more striking for energy absorption values computed at higher reference strains. The difference between the tension and compression derived energy values results directly from the inherent brittleness of the material under tensile loading which limits ductility to less than about 0.05 (5%). The relationship between foam density and absorption energy (in compression) arises directly from the power-law relationship between compressive strength and density as shown in the previous figure.
17
Strain
Figure 8. Reproducibility of compression tests for a foam having a density of 0.26 g/cm3. 700 600
500
400 300 200 100
0
0.1
0.2
0.3
0.4
Density (g/cm3)
0.5
0.6
0.7
Figure 9. Density dependence of the foam modulus in tension and compression.
18
20 - ELASTIC COLLAPSE STRESS VS - DENSITY
15
10
5
0
0
Figure 10.
0.1
0.3
0.2
0.4
Density (g/cm3)
0.5
0.6
Elastic collapse stress for the foam specimens as function of density. A power-law dependence with respect to foam density is evident.
Although quasi-static compression testing represents a more realistic test condition than tensile testing, it is still of only limited value with respect to characterizing the shock mitigating (i.e., high rate) qualities of a foam encapsulant. The limitations stem from the strain rate sensitive nature of the viscoelastic polyurethane. The rate sensitivity of the mechanical properties of the foam is illustrated in Figure 12. This figure compares a series of compression tests for specimens tested at strain rates that varied over three orders of magnitude (p* = 0.24 g/cm3). Over the range of strain rates examined, there is little change in the modulus of the foam (within the precision of the measurement). However, the plateau stress is found to increase monotonically with strain rate and as a result, the energy absorption values (again for reference strains of 0.10) also increased with increasing strain rate. The influence of strain rate on these properties is summarized in Table 11. Because of the rate sensitivity of the strength of the foam, the use of quasi-static testing to assess the energy absorption capabilities of a material will result in measured values that are not indicative of dynamic material properties. Rather, the results will depend entirely on the specific test conditions.
19
1.4 1.2
L
- ENERGY ABSORPTION -
FOR TENSION & COMPRESSION TESTS
-
1 :Strain rate = 1.7 x 10’~sec” 0.8 -
-
-
-
0.6 0.4 0.2
-
-
-
Tension Compression
-o-
-
-
1
0 0
0.1
0.2
0.3
0.4
,
,
,
,
1
,
0.5
,
,
,
0.6
Density (g/cm3)
The energy absorption of the foam vs. density along with the data from Figure 5 for tension testing. Energy absorption capacity of the foam in compression far exceeds that in tension for the entire range of density examined.
Impact Testing The rate sensitivity of the mechanical properties of the foam as illustrated in Figure 12 and Table I1 indicates that quasi-static testing cannot be used to quantitatively assess the energy absorption characteristics of polyurethane foams under shock loading. Under such conditions, where strain rates are many orders of magnitude greater than those that can be achieved using conventional mechanical test capabilities. For service environments that involve shock mitigation, what is needed is a high rate test method that can capture the dynamic response of the foam under loading rates that more closely correspond to impact conditions. The method chosen for the present studies involves the use of an instrumented drop weight impact tester. Depending on the sample geometry and test configuration, the apparatus can be used to simulate a wide range of testing requirements. For example, the fracture toughness of a material may be studied by examining the response of notched specimens to an impact load. Alternatively, the resistance of a material to penetration can be examine with the use of specimen plaques and either blunt or sharp impact tips. For the present study, a series of drop weight impact tests were conducted on free standing, right circular cylinders having the same dimensions as the compression specimens. This specimen geometry was chosen because it most closely simulated the loading conditions expected in the service environment and because it afforded a direct comparison to the compression testing 20
described above. The effective strain rates generated in these tests were = 70 6' or nearly 4 x times higher than the baseline strain rate used in the tension and compression testing.
1 STRAIN RATE EFFECTS
:ON 6 - COMPRESSION BEHAVIOR
-
.
_ _ _ _ _ _ _- -- - - - - - _
- - _ _ _ _ _ _-_- ----- _-------* -
5 :
lo5
e c -
-
-
1 . 7 ~0-2 1 sed' -1 - - - - - 1 . 7 ~ 0-3 1 sed' I - - - I . 7 ~ 1 Osec-' -~ -I 1 . 7 ~0-5 1 sec'' 1 !
0
Figure 12.
0.02
0.04
0.06
,
0.08
,
0.1
Strain
Effect of strain rate on compression behavior of foam having a density of p* = 0.24g/cm3.
TABLE 11: EFFECT OF STRAIN RATE ON PROPERTIES OF CRETE FOAM Strain Rate (8')
Modulus (MW
Plateau Stress (MW
Energy Absorption (J/cm3)
1.7 x l o 2 1.7 x 10⁻³ 1.7 x lo4 1.7x 10⁻⁵
149 149 157 138
5.5 5.0 4.6 4.4
0.45 0.43 0.39 0.37
An important characteristic of the impact tests performed here was that the test specimens all failed catastrophically. Thus, unlike the compression tests, where energy absorption was determined for some arbitrary strain, impact testing yielded intrinsic energy absorption values for the material. We qualify this statement by noting that the values measured are still dependent on
21
the specimen geometry and the manner in which the specimens are supported and impacted. Testing specimens of entirely different geometries (for example, unsupported plaques) would undoubtedly yield different, although self-consistent results. Figure 13 shows the results for a series of tests performed on foam specimens having a density of 0.27 g/cm3. The figure shows both the stress (solid lines) and energy absorption (broken lines) as a function of time. Note that the entire impact events span less than 4 ms. The loading (stress) ramps are quite reproducible up to the maximum load. Peak stresses are reached at = 1 ms. Oscillations in the stress traces can be seen and are the result of mechanical ringing induced in the load cell. However, these oscillations are small and have little influence on the determination of energy absorption. After about 1 ms, the stress begins to fall off as the specimens begin to fail. In each case, failure is catastrophic, with the specimens shattering into many small irregularly shaped fragments. Variations in the rate of unloading is commonly observed due to differences in the way the specimens shatter. Identifying the precise point (in time, stress or strain) of specimen failure is problematic. We define failure to have occurred when the load drops to 60% of the peak load. This generally corresponds to the point at which the energy absorption traces begin to diverge. In Figure 13, the 60% of peak load point is identified by the arrow. The traces shown in Figure 13 are typical of the impact response of the foam at all densities. 10
1
1
1
1
"
1
1
'
1
~
"
'
1
~
1
'
1
1
~
1
1
1
1
~
1
1
1
1
~
1
1
1
'
STRESS & ENERGY ABSORPTION -
2
1.5
1
0.5
0 Figure 13.
1
2
Time (ms)
3
0 4
Dynamic response of foam having a density of 0.27 g/cm3. The figure shows both the change in stress (solid lines) and the energy absorption (broken lines) as a function of time.
22
Figure 14 shows the maximum stresses developed in the foam specimens for all three test techniques. The ultimate tensile strength (tension) is low over the entire range of foam densities reflectingthe inherent brittle nature of the material. The compression data represent the plateau or collapse stress shown in Figure 10 which is fit to the power-law relationship previously defined. The stresses generated in the impact testing are greater than those in either of the quasi-static test types and unlike the compression testing represent true limiting values for the material under a specific set of dynamic conditions.
24 20
16 12 8
4 0 0
0.1
0.3
0.2
0.4
0.5
0.6
Density (g/cm3) Figure 14. Maximum stresses developed in the foam specimens for all three test techniques. The tensile strength is low over the entire range of foam densities reflecting the inherent brittle nature of the material. The compression data represent the elastic collapse stress shown in Figure 10. The stresses generated in the impact testing are greater than those in either of the quasi-static test types. Figure 15 shows the dynamic energy absorption of the foam vs. density. The figure reveals that energy increases monotonically with density up to a maximum of = 1.4 J/cm3 at a density of 0.35 g/cm3. Beyond this point, the energy absorption falls with increasing density. This behavior is unlike that observed for the quasi-static compression testing. In that case, energy increased monotonically with density over the entire range of foam densities examined (see Figure 11) with no maximum, such as that shown in Figure 15, observed. The impact data therefore identifies an
23
intrinsic limitation of the material that is not evident in conventional compression testing and suggests that there is an optimum foam density above which energy absorption is degraded. These differences emphasize the importance of performing tests under conditions that simulate, as closely as possible, the actual loading conditions that are likely to be experienced by encapsulants in their intended service environments. 1
1.6
1
1
1
)
1
1
1
1
~
1
1
1
1
~
1
1
1
1
(
1
1
1
,
~
,
1
- ENERGY ABSORPTION
-
-
-
0.4 -
-
I
0 0
,
,
,
,
I
,
0.2
0.1
,
,
,
,
-
FROM - IMPACT TESTING -
1.2 -
0.8
1
I
,
0.3
,
,
,
I
,
,
,
,
I
,
0.5
0.4
,
,
,
0.6
Density (g/cm3) Figure 15.
Energy absorption of CRETE vs. density for impact testing. Unlike quasi-static testing, energy absorption peaks at an intermediate value of density.
24
L
-
1’
e
.