International Journal of Biological and Medical Sciences 2:2 2007
Medical Image Registration by Minimizing Divergence Measure Based on Tsallis Entropy Shaoyan Sun, Liwei Zhang, and Chonghui Guo
tasks. In contrast, intensity-based image registration techniques are free from this limitation because they do not deal with the identification of geometrical landmarks. Recently there has been an active research into the use of intensity-based image registration techniques [3, 4]. The key step of intensity-based image registration is to find a spatial transformation such that a similarity metric (or distance metric) between two or more images taken at different times, from different sensors or from different viewpoints, achieves its maximum (or minimum). The use of image similarity measures, especially those derived from information theory, have been shown to allow fully automated registration in a number of important clinical applications. The Shannon mutual information (Shannon-MI) which is based on the Kullback-Leibler divergence (KLD) has recently received substantial attention [5] for it is a robust and accurate registration method. In addition to the widely-used Shannon-MI, generalized information-theoretic similarity metrics, such as Rényi entropy [6, 7] and Tsallis mutual information (Tsallis-MI) [8, 9, 10], have properties that make them conductive to medical image registration. On the other hand, as the use of co-registration packages spreads, the number of the aligned images pairs in image databases (either by the manual or automatic methods) increases dramatically. These image pairs can serve as a set of training data, in which the statistical joint intensity properties can be observed and learned in order to acquire useful a priori knowledge for future registration tasks. Chung et al. [11] and Gan et al. [12] proposed to make use of the a priori knowledge of the joint intensity distribution expected to obtain as a reference distribution. This expected joint distribution can be estimated from aligned training images. Any two images of the same or different acquisitions are aligned when the distance from their observed joint distribution to the corresponding expected distribution is minimized. In this paper, we propose to measure the distance using the Tsallis divergence measure (denoted as TDM). Unlike KLD, TDM is non-logarithmic and has an adaptive parameter. The performance of the proposed method has been investigated by applying it to 3D brain image registration problems both on simulated and clinical images. Experimental results show that the proposed TDM registration algorithm can provide an accurate and rapid registration.
Abstract—As the use of registration packages spreads, the number of the aligned image pairs in image databases (either by manual or automatic methods) increases dramatically. These image pairs can serve as a set of training data. Correspondingly, the images that are to be registered serve as testing data. In this paper, a novel medical image registration method is proposed which is based on the a priori knowledge of the expected joint intensity distribution estimated from pre-aligned training images. The goal of the registration is to find the optimal transformation such that the distance between the observed joint intensity distribution obtained from the testing image pair and the expected joint intensity distribution obtained from the corresponding training image pair is minimized. The distance is measured using the divergence measure based on Tsallis entropy. Experimental results show that, compared with the widely-used Shannon mutual information as well as Tsallis mutual information, the proposed method is computationally more efficient without sacrificing registration accuracy.
Keywords—Multimodality images, image registration, Shannon entropy, Tsallis entropy, mutual information, Powell optimization. I. INTRODUCTION
T
HE geometric alignment or registration of images is a fundamental task in numerous applications in three-dimensional medical image processing. Medical images from different modalities can provide complementary information about anatomy or functional in a synergistic manner. Since images may be acquired in different poses, considerable effort has been placed on developing methods for image registration. Existing image registration techniques can be broadly classified into two categories: feature-based and intensity-based methods [1,2]. A feature-based method requires the exaction of features common in both images. Obviously, a feature-based method is data dependent. Since different image data may have different features, the feature exaction algorithms adopted in a feature-based image registration algorithm are expected to be different for different registration Manuscript received January 23, 2007. This research is supported by Natural Science Foundation of China (Grant No. 10571018). Shaoyan Sun is with the Department of Applied Mathematics, Dalian University of Technology, Dalian, 116024, People’s Republic of China (corresponding author, e-mail:
[email protected]). She is doing research on image registration. Liwei Zhang is with the Department of Applied Mathematics, Dalian University of Technology, Dalian, 116024, People’s Republic of China (e-mail:
[email protected]). Chonghui Guo is with the Department of Applied Mathematics, Dalian University of Technology, Dalian, 116024, People’s Republic of China (e-mail:
[email protected]).
75
International Journal of Biological and Medical Sciences 2:2 2007
B. The Observed and Expected Joint Intensity Distributions
II. REGISTRATION ALGORITHM
Assuming I f and I r are the intensity values of two testing
A. The Spatial Coordinate and Transformation Each image is associated an image coordinate frame with origin positioned in a corner of the image, with x axis along the row direction, the y axis along the column direction, and the z axis along the plane direction [13]. One of the images is selected to be the floating image, f , from which samples s are taken and transformed by the transformation Tθ into the reference image,
images of the same or different acquisitions, where f and r respectively represent the floating and the reference images that are to be registered. Given a hypothesized transformation Tθ defined by the registration parameter θ , then we can obtain their joint intensity distribution denoted as observed joint intensity
r . In general,
T
Tθ s will not coincide with a grid point of image r and
function of the transformation Tθ .
interpolation of the reference image is needed to obtain the image intensity value r (Tθ s ) . Nearest neighbor interpolation
*
The corresponding expected joint distribution P ( I f * , I r* ) used as the reference distribution can be estimated from aligned
of r is generally insufficient to guarantee subvoxel accuracy, as it is insensitive to translations up to one voxel. Other interpolation methods, such as trilinear interpolation, may introduce new intensity values which are originally not present in the reference image, leading to unpredictable changes in the marginal distribution of the reference image foe small variations of θ . To avoid this problem, F. Maes proposed a partial volume interpolation (PVI) to update the joint histogram for each voxel pairs ( s, Tθ s ) . Instead of interpolating new
training images f
transformation. The rigid-body transformation is a superposition of a 3-D rotation and a 3-D translation and the registration parameter θ is a six-component vector consisting
piα 1 DTDM ( P || Q) = (1 − ∑ α −1 ) 1−α i qi
f to image r is given by Vr ⋅ (Ρ r − Cr ) = Rx (φx ) ⋅ Ry (φ y ) ⋅ Rz (φz ) ⋅ V f ⋅ (Ρ f − C f )
distributions associated with the distributions P and Q . Here distributions
f and r , respectively (in
joint
millimeters), C f and Cr the image coordinates of the centers of the images,
P and Q represent the observed and expected
distributions
PTθ ( I f , I r )
and
P* ( I f * , I r * )
respectively. The TDM value, DTDM , tends to zero when the two
R = Rx ⋅ Ry ⋅ Rz the 3×3 rotation matrix, with
the matrixes Rx , Ry , and Rz representing rotations around the x , y , and z axis, respectively, and vector [13].
(2)
with α ∈ ℜ − {1} , where pi and qi denote the probability
(1)
with V f and Vr being 3×3 diagonal matrixes representing the voxel sizes of images
f should
which is proposed by Tsallis [9]:
Ρ f to Ρ r from the
+t (t x , t y .t z )
and
In this paper, the distance between two distributions P and Q is measured by the Tsallis divergence measure (TDM),
three translation distances t x , t y , t z (measured in
image
*
C. The Distance Measured by the Tsallis Divergence Measure
(measured in degrees) and
millimeters). Transformation of image coordinates
*
and r . Here images f *
for trilinear interpolation [12]. In this paper we restrict the transformation Tθ to rigid-body
φx , φ y , φz
*
be the same acquisition, so should images r and r . The joint probability distribution of two images is estimated by calculating a normalized joint histogram of the grey values. The marginal distributions are obtained by summing over the rows, resp. the columns, of the joint histogram. We use partial volume interpolation (PVI) to construct the joint histogram since it provides subvoxel accuracy (as opposed to nearest neighbor interpolation) and avoids the introduction of spurious grey values (in contrast to trilinear interpolation). The histogram size we use here is 256×256 which indicates that the images have been pre-rescaled into 256 grey levels. The goal is to align two testing images of the same or different acquisitions such that the expected distribution and the observed joint intensity distribution are well matched. In other words, the registration algorithm aligns two different images based on the expected outcomes.
intensity values in image r , the contribution of the image intensity f ( s ) of the sample s of f to the joint histogram distributed over the intensity values of all eight nearest neighbor’s of Tθ s on the grid of r , using the same weights as
of three rotation angles
T
distribution P θ ( I f , I r ) [11, 12]. Note that P θ ( I f , I r ) is a
distributions become equal. So the registration goal is to search the optimal transformation Tθ * which minimizes the distance
t the translation
from the observed distribution to the expected joint distribution,
76
International Journal of Biological and Medical Sciences 2:2 2007
2
i.e. DTDM . The registration procedure is an iterative process,
3%noise 5%noise 7%noise
and is terminated when DTDM becomes sufficiently small.
1.8
1.6
D. Mutual Information Based Registration Measures To investigate the performance of the proposed TDM method, we compare it with other two registration method. The first is Shannon mutual information (Shannon-MI) method, which was proposed independently by Collignon et al. [14] and Viola et al. [15] in 1995. It is a very general and powerful criterion, and has been accepted by most researchers. So we would compare the new method with this classical method. The second method we considere here is Tsallis mutual information (Tsallis-MI), which is based on Tsallis entropy. It was applied into solving registration problems recently. Shannon mutual information is defined as follows:
Shannon − MI = H ( I f ) + H ( I r ) − H ( I f , I r ) ,
Shannon−MI
1.4
1.2
1
0.8
0.6
0.4 −20
−15
−10
−5
0 translation,mm
5
10
15
20
−4.5 3%noise 5%noise 7%noise
(3)
−5
where −5.5
H ( I f ) = −∑ p(i f ) log p (i f )
(4) Tsallis−MI
if
is the Shannon entropy. The expression of Tsallis-MI is as follows:
Tsallis − MI = H α ( I f ) + H α ( I r ) − (1 − α ) × H α ( I f ) H α ( I r ) − H α ( I f , I r )
−6
−6.5
−7
, (5)
−7.5
where
−8 −20
H α ( I f ) = (1 − α ) −1 (∑ p(i f )α − 1) , α ∈ℜ − {1} (6)
−15
−10
−5
0 translation,mm
5
10
15
20
6.5
if
6
is the Tsallis entropy. The mutual information based methods state that, for two images that are to be registered, the value of their mutual information will be maximal if the images are geometrically aligned.
TDM
5.5
E. Optimization Method The images are initially positioned such that their centers coincide and that the corresponding scan axes of both images are aligned and have the same orientation. Powell’s method is used to minimize DTDM [16]. This method is a reasonable
5
4.5
4 3%noise 5%noise 7%noise
method between robustness and speed. Powell optimization requires no derivative information of the objective function. It involves a series of one-dimensional maximizations for each dimension; these maximizations are carried out by Brent's method. Having found an optimum in
3.5 −20
−15
−10
−5
0 translation,mm
5
10
15
20
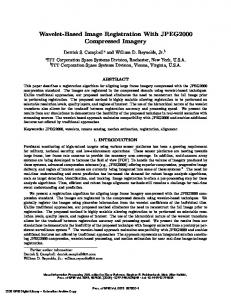
Fig. 1 Examples of three different registration measures as functions of translations along the slice direction (in millimeters) for three testing image pairs
one direction, the maximization is continued in the next direction, starting from the current position. Once all six parameters have been optimized, the loop is repeated until the
77
International Journal of Biological and Medical Sciences 2:2 2007
TABLE II SIMULATED REGISTRATION RESULTS OF THE IMAGE PAIR WITH 5% NOISE LEVEL
TABLE I SIMULATED REGISTRATION RESULTS OF THE IMAGE PAIR WITH 3% NOISE LEVEL Methods
α
Results
Shannon-M I
None
10-3 ×[-0.1087, -0.1035, 0.0798, -0.0564, -0.1401, 0.0266]
Tsallis-MI
0.9 0.8
Tsallis-MI
Methods
α
704
Shannon-M I
None
10-3 ×[0.0966, 0.1908, 0.0744, -0.0598, 0.2922, 0.0586]
705
10+6 ×[-0.0125, 0.0171, 0.0001, 0.0027, -0.0022, 5.2893]
200 (failed)
Tsallis-MI
0.9
10+6 ×[7.4277, -0.0253, 0.0036, 0.0151, 0.0000, 0.0250]
317 (failed)
10+4×[0.0768, -4.6148, 0.0005, -0.0000, 0.0001, 0.0768]
194 (failed)
Tsallis-MI
10+3×[2.7646, -4.4706, -1.6623, -0.0016, -0.0014, 0.0016]
265 (failed)
Function Evaluations
0.8
Results
Function Evaluations
TDM
0.9
10-3 ×[0.2429, 0.2267, 0.0424, -0.0981, -0.0079, 0.0226]
640
TDM
0.9
10-4 ×[-0.2680, -0.6750, -0.1251, 0.7588, 0.5101, -0.0908]
498
TDM
0.8
[0.0002, -0.0012, 0.0000, 0.0002, 0.0001, -0.0000]
593
TDM
0.8
[-0.0058, 0.0060, 0.0037, 0.0000, 0.0000, 0.0000]
487
TDM
0.7
[-0.0027, -0.0240, -0.0003, 0.0046, -0.0021, 0.0030]
504
TDM
0.7
[-0.0148, -0.0851, 0.0098, -0.0026, 0.0012, 0.0007]
486
TDM
0.6
[0.0234, -0.0769, 0.0090, 0.0095, 0.0177, 0.0103]
417
TDM
0.6
[-0.0228, 0.0702, 0.0192, 0.0442, -0.1451, 0.0698]
415
TDM
0.5
[0.0833, 0.1380, -0.0165, -0.0187, 0.0371, -0.0003]
417
TDM
0.5
[0.0271, 0.2358, 0.0116, 0.0369, -0.1695, 0.1034]
429
TDM
0.4
[0.0882, 0.2215, 0.0394, -0.0256, 0.0927, 0.0206]
427
TDM
0.4
[-0.0054, 0.0462, -0.2152, 0.1597, -0.3532, 0.3608]
500
TDM
0.3
[-0.2349, 0.2134, 0.0576, -0.0140, -0.0372, -0.0277]
665
TDM
0.3
[0.3640, 0.3407, -0.0679, 0.0613, -0.0100, 0.2758]
496
TDM
0.2
[0.2306, -0.3270, -0.0397, 0.1032, 0.1053, 0.1179]
573
TDM
0.2
[0.5475, 0.3337, 0.0715, 0.0537, 0.8598, 0.3013]
732
TDM
0.1
[21.0586, -14.1472, 6.3378 -5.7688, 5.0797, 19.8442]
237 (failed)
TDM
0.1
19.7359, -9.2095, 5.1806, -4.9970, 6.2699, 19.2690
297 (failed)
improvement achieved in the most recent iteration is within predefined boundaries. The direction matrix is initialized with unit vectors in each of the parameter directions. An appropriate choice for the order in which the parameters are optimized needs to be specified, as this may influence optimization robustness. For instance, when matching images of the brain, the horizontal translation and the rotation around the vertical axis are more constrained by the shape of the head than the pitching rotation around the left-to-right horizontal axis. Therefore, first aligning the images in the horizontal plane by first optimizing the in-plane parameters (t x , t y .t z ) may facilitate the optimization parameters (φx , φ y , φz ) [13].
of
the
III. EXPERIMENTS AND RESULTS ANALYSIS A. Simulated Registration Function Four pairs of T1 and T2 image volumes are obtained from the Brain Web Simulated Brain Database [17, 18] (181×217 ×60 voxels, 1 mm ×1 mm ×3 mm and noise levels were 0%, 3%, 5% and 7%, respectively), in which all the images have already been perfectly aligned and can be used as a testing platform for studying the performance of different objective functions. The image pair with 0% noise level is used as the training data in our experiments, from which the expected joint intensity distribution is estimated; other image pairs are used as the testing data to test the proposed TDM registration algorithm. It should be noted that, to improve the registration speed, these images have been subsampled by a factor of two in each dimension, and image T2 was taken as the floating image in each image registration task.
out-of-plane
In this work, the convergence parameters for the Brent and Powell optimization algorithms are set to 10-3 and 10-4 respectively.
78
International Journal of Biological and Medical Sciences 2:2 2007
TABLE III SIMULATED REGISTRATION RESULTS OF THE IMAGE PAIR WITH 7% NOISE LEVEL Methods
α
Shannon-M I
None
10-3 ×[-0.1123, 0.1957, 0.0657, 0.0933, -0.0257, 0.0690]
653
Tsallis-MI
0.9
10-3 ×[-0.0170, 0.2962, 0.0731, 0.1543, -0.1109, 0.0243]
803
10+4×[2.7646, -4.4706, -1.6623, -0.0016, -0.0014, 0.0016]
308 (failed)
0.8 Tsallis-MI
Results
starting the optimization process. Since all the images have already been perfectly aligned, complete registration is obtained when the transformation parameter θ was optimized to θ = [0, 0, 0, 0, 0, 0]. The simulated registration results we obtained are shown in Table I, Table II and Table III, respectively including the transformation parameters we obtained and the number of the registration function evaluations during each registration task. From tables we find that Shannon-MI succeeds registering three image pairs with higher precision, and the proposed TDM method can provide a more accurate registration with faster convergence if the value of α is chosen as 0.9. However, the performance of Tsallis-MI is poor and it is only successful in the registration of the testing image pair with 7% noise level. From three tables, we also can find that the convergence speed of the TDM method becomes faster as the value of α decreases with the exception of Tsallis entropy with α