MEMBRANE FILTRATION OF BIOLOGICAL SOLIDS: A UNIFIED FRAMEWORK AND ITS APPLICATIONS TO MEMBRANE BIOREACTORS Slawomir W. Hermanowicz Department of Civil and Environmental Engineering University of California, Berkeley, CA 94720-1710 (E-mail:
[email protected]) Abstract We propose a unified theoretical framework to describe different aspect of solids separation in MBR, their interactions and the effects on process performance. The core of the proposed framework consists of mass balance on biological solids near the membrane and formation of a solid cake when forward solids flux exceeds backward flux. Percolation theory is used to predict critical flux and properties of solid cake (porosity, permeability and elasticity). A mathematical model, developed from basic principles, yields realistic results of pressure changes. Keywords membrane bioreactors, membrane filtration, permeability, percolation theory
Framework Development The development and wider applications of membrane bioreactors (MBR) for wastewater treatment and water reclamation require a fundamental understanding of membrane fouling that is critical for economically feasible process design and operation. While membrane processes have been used for solid-liquid separation in numerous industrial applications for many years (including water treatment and sludge dewatering), membrane bioreactors pose a set of new and significant challenges. Unlike inert mineral particles or organic molecules encountered in many membrane filtration processes, biomass in MBR is a living complex system consisting of many components ranging from macromolecules (nanometer scale) to large biological aggregates (millimeter scale). The composition of the biomass and its physical, chemical and microbial characteristics may change in response to changing environmental conditions. Membrane filtration, an essential part of the MBR process, is affected by biomass concentration and composition and, in turn, affects biomass composition by retaining all reactor components above an actual membrane cutoff. The complete retention may lead to proliferation of filamentous microorganisms, unflocculated (dispersed) microbial cells and other colloidal components. While achieving high effluent quality from an MBR usually does not pose challenges for operators, membrane performance must be continually evaluated and maintained. Although individual elements of membrane bioreactors have been studied, a comprehensive framework of the MBR process would enhance its understanding and facilitate design and operation. This work attempts to create such a framework and to put it in mathematical terms as far as possible. At the same time, we point at the areas where current knowledge is inadequate and should be a focus of further research. This paper is not intended to be a comprehensive review and it includes only selected references to previous research. Belfort and co-workers (1994) presented a detailed review of crossflow microfiltration and many aspects of the latter applies also to membrane bioreactors. Solid flux balance is a critical element of the developed framework. At the lowest spatial scale in the vicinity of membrane surface the flux of solids J is controlled by two phenomena: forward flux towards the membrane with the velocity u equal to the permeate flux and the backward flux away from the membrane. Several mechanisms have been postulated for the backward flux including diffusion (Brownian and shear induced) and inertial lift. For crossflow filtration other mechanisms of solids transport such as flow or rolling along the membrane have been analyzed (e.g., Chang et al., 1995 and references therein). In a submerged MBR, the action of air bubbles may be a dominant factor controlling solids backward flux. Cui et al. (2003) discussed possible mechanisms of backward flux (“cake
depolarization” in their terminology) including eddies in bubble wakes, liquid and membrane lateral displacement. While the exact nature of physical phenomena responsible for solids flux away from the membrane is not fully understood, a simplified approach involving an overall mass transfer coefficient kB is useful in framing the flux equation
J = u Xb − kB ( X S − Xb )
(1)
where Xb is the bulk biomass concentration (corresponding to MLSS in activated sludge) and XS is a similar concentration at the membrane surface. In this approach, we assume that the biomass concentration gradient is a driving force behind the backward flux. At steady state, J = 0 and
u X S = Xb 1 + kB
(2)
As the forward flux increases due to increasing u or Xb, the concentration XS also increases. Such an increase can be also caused by a decrease of the backward flux coefficient kB in response to changes of suspension viscosity, aeration intensity or crossflow velocity. At a critical value XS*, solid particles in the suspension come into contact one with another and form a cake. Chen et al. (1997) described this transition from a “dynamic, labile polarization layer” into an “irreversible cake or foulant” as responsible for the existence of a “critical flux” defined earlier by Field et al. (1995). At solids concentrations below XS* hydrodynamic forces control interactions between particles, and the suspension behaves like a fluid although with different rheological properties. At solids concentrations above XS*, mechanical stress (solids pressure) pS is transmitted through the solids. The value of XS (as mass concentration) can be related to solids volumetric fraction (solidosity) !S or critical porosity "S, and solids density #S (3) X S = ρ S φ = ρ S (1 − ε ) Percolation theory (Stauffer and Aharony, 1994; Sahimi, 1994; Berkowitz and Ewing, 1998) can be used to study various aspects of such transitions including estimation of !S (called a “percolation threshold”). For solid particles in the form of overlapping spheres, percolation threshold !S has been theoretically estimated at 0.28 (Scher and Zallen, 1970). For other shapes, the value of !S is typically lower and depends on “pointedness” of solid particles (Alon et al., 1991) with commonly reported values of 0.15 to 0.19 (Sahimi, 1994). On the other hand, Leighton and Acrivos (1986) considered suspensions with solids fraction ! up to 0.58 as fluids with increasing viscosity and not solids. In biological systems, formation of a solid network was postulated for bulking activated sludge (Hermanowicz, 1993). The critical concentration of filamentous bacteria was derived theoretically from the percolation theory and matched experimental results. A similar network of filaments may be formed in MBR biomass with its abundant filamentous populations. It is possible that an initial solids network is formed by the filaments and a more dense cake only at higher solids fractions. In practice, the critical value of !S may also depend on the “stickiness” of solid particles (e.g., caused by exocellular polymeric substances - EPS) and the shear rate to which they are exposed. At lower “stickiness” and higher shear, bonds initially formed between particles may be broken thus resulting in higher !S values. Better characterization of the critical transition point is very important and still lacking. Solids Layer Permeability As solid particles accumulate at the membrane surface, they affect the permeate flow. The flow of permeate through a porous cake is described by Darcy’s equation linking flow velocity u and the gradient of liquid phase pressure pL. In one dimension, this equation can be written as
u= −
k dp L µ dz
(4)
where k is the permeability, $ - dynamic viscosity of permeate and z - spatial coordinate perpendicular to the membrane surface. The analysis of permeability is facilitated by scaling k by the Stokes permeability kS. For porous material composed of spherical particles, kS = (2/9) R2(1 - ")-1 and for particles of irregular shape, kS can be defined as kS = 2 (1 - ") s-2 where s is the ratio of pore surface area to the volume of porous material. Permeability k is usually considered as a function of cake porosity " and can be described by several different equations. For flow through granular beds, Carman-Kozeny equation is often used yielding permeability kCK
k CK 3 ε3 = kS 25 (1 − ε )
(5)
While well-applicable at moderate porosities, Carmen-Kozeny equation fails at very low porosities especially below the connectivity threshold "C. The connectivity threshold is equal to the minimum porosity at which the void space is connected through the medium providing a path for flow. In a mirror image of solids connectivity, the pore space threshold is 0.28 for random spherical pores and smaller for other shapes. An extension of the work of Alon et al. (1991) suggests that for randomly spaced (uncorrelated) cylindrical pores with length-to-radius of 10, the connectivity threshold can be as low as 0.015. Analytical and numerical results obtained using percolation theory show that the permeability around the connectivity threshold is a power function of (" - "C) with the exponent equal to 2 (Normand and Herrmann, 1996). Further away from "C, permeability may be estimated using the effective medium approximation technique (Sahimi, 1994) yielding the overall equation for permeability kperc
k perc kS
= ε C (ε − ε C )
2
1 − εC 1− ε
(6)
Yet another relationship between permeability and porosity was proposed by Martys et al. (1994) from numerical simulations of random porous media. According to their work, permeability kM can be described as
k M 1 − ε + εC f ε − εC ) = ( kS 1− ε
(7)
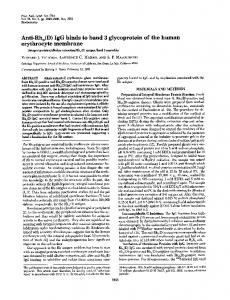
with f = 4.2 Equations 5 through 7 present three alternative formulations for k(") and are shown in Figure 1. For larger porosities, all equations coincide but they deviate significantly at smaller ". These differences may be significant especially if a thin compact “skin” layer is formed next to the membrane. Hwang and Hsueh (2003) reported that such “skin” may be responsible for a dominant fraction of hydraulic resistance. Accurate description of permeability at low porosities remains a challenging task and needs to be studied further. Regardless which form is considered for k("), the permeate is assumed to flow through the connected voids. However, such conceptual model may be misleading as the “voids” may be (partially) filled with semi-permeable polymers. Yang et al. (2002) developed a model for the flow of water through channels filled with deformable gels and found that the gel intrinsic properties (gel reference permeability and
1.E+02
k/k S
1.E+00
1.E-02
C arman-Kozeny Eq. 5 1.E-04
Martys et al. Eq. 7
percolation E q. 6 1.E-06 0.01
0.1
porosity
1
ε
Figure 1 Scaled permeability as a function of porosity elastic index) control the flow. These theoretical findings support well-established experimental results showing the effects of EPS on membrane performance ( e.g., Lee et al., 2003; Bouhabila et al., 2001; Defrance et al., 2000; Hodgson et al., 1993 but see Rosenberger and Kraume, 2003 for a contrary view) or sludge dewatering (see review by Liu and Fang, 2003). Porosity changes can also occur due to filtration or adsorption of small, colloidal or sub-colloidal material carried with the permeate through the cake. Retention of these fine components can affect significantly cake permeability as suggested by Tien et al. (1997). MBR biomass can contain a substantial fraction of colloidal matter that play an important role in membrane performance (Defrance et al., 2000; Bouhabila et al., 2001). Cake Compressibility and Consolidation Biological solids accumulating at the membrane if J>0 are compressed under stress caused by the hydrodynamic forces of the permeate flow. The effects of solids deformation in membrane filtration have been recognized and extensively studied. A review by Lee and Wang (2000) describes several theories of cake consolidation. Among them empirical constitutive equations of the power-law type are most popular. They relate either ! or solids resistance to solid compressive pressure pS. While these equations, originating from Tiller and co-workers (see many references in Lee and Wang, 2000), have been applied successfully to compressible solids (e.g., Hwang and Hsueh, 2003) they are not universal nor fundamentally derived. For example, Tiller et al. (1999) list the values of the exponent linking ! and pS between 0.09 and 0.47 for different solids. In similarity with elastic solids, Young modulus E can be used to describe solids deformation under stress. It should be noted that unlike purely elastic solids, E for biological solids is not constant but depends (among others) on solids concentration. Hermanowicz (1993) estimated the values of E for bulking activated sludge and related them to solids concentrations. For solids concentration of 10 g/L, the estimated value of E was approximately 2.2 Pa. Such a low value is comparable with those estimated for suspensions of polymers (polyacrylamide) near the critical gelation point (Otsubo, 1996). In accordance with the predictions of the percolation theory, elastic modulus E should vary as a universal power law with exponent g and prefactor KE
E = K E (φ − φS ) = K E (ε S − ε ) g
g
(8)
The value of exponent g for polymer and filament networks is estimated at 3.6 to 4 (Otsubo, 1996), in agreement with theoretical predictions of 3.75 for networks dominated by bending forces. In contrast, for solids clusters, deformation of which is influenced by compaction and stretching, the predicted exponent is lower, at about 2.1. While complete understanding of solids compressibility and supporting experimental results are quite scant, it is possible that deformation of biological solids during membrane filtration may be governed initially, at high porosities, by filamentous networks and later, at lower porosities, by more compact solid particles or flocs. Although, elastic (Young) modulus can be used to characterize deformation of biological solids forming a cake, their behavior is not completely elastic in the classical sense. When stress is applied to the biosolids, they will deform, presumably according to the elastic behavior but when the stress is released they will not, in general, return to their original shape or volume. This phenomenon of consolidation and cohesive behavior has been demonstrated for membrane filtration (Jonsson, 1993; Chen et at., 1997) as hysteresis of flux vs. pressure or flux vs. shear. The cohesive forces depend on biochemical and physical properties of solids but, at present, are not understood. Mathematical Model The proposed framework can be implemented in a form of a mathematical model. The central part of the model is based on Eq. 1 describing solids flux. If solids concentration at the membrane surface XS is smaller than the critical value XS* (! < !S or " > "S), the net flux J = 0 and continuous filtration is achieved without a concomitant pressure increase (or permeate flux decline). This situation corresponds to operating below the “critical flux” as defined by Field et al. (1995). In this analysis, membrane fouling due to adsorption of material on its surface or in the pores is not considered. If the forward flux exceeds the backward flux, J > 0 and solids accumulate at the membrane surface forming a cake. Since solids fraction at the outer edge of the cake is !S (and correspondingly its mass concentration is XS* ), the mass of solids per membrane surface area m in the form of a cake accumulates according to the following equation
dm = J = u X b − k B ( X S* − X b ) dt
(9)
At the same time, permeate flow is described by Eq. 4 with permeability described by one of the Eqs. 5 to 7. Since the cake undergoes compression, permeability k(") changes along its depth following the changes of porosity ". As liquid pressure pL decreases inside the cake, the solid pressure pS increases according to the condition (Lee and Wang, 2000)
dp L dpS + =0 dz dz
(10)
Finally, cake compression and strain % are described by
p S = σ E (ε )
(11)
which combined with solids continuity yields
pS =
1 − εS E (ε ) 1− ε
(12)
with pS and " changing with z, and E described by a suitable form of Eq. 8. Differentiation of Eq. 12, combined with Eq. 10 and substitution in Eq. 4 results in a differential equation
dε = F (ε ) dz
(13)
exact form of which depends on the choice of k(") (from Eqs. 5 to 7) and the details of Eq. 8. Integration of Eq. 13 is facilitated by substitution & = L - z where L in the (unknown) thickness of the cake at time t. Initial conditions "(z = L) = "S allows for calculation of porosity backwards in z (forwards in &) from the cake surface at & = L - z = 0. Mass m can be calculated from Eq. 9 as a function of time m(t) and concurrently from the solution of Eq. 13 as
∫ ρ (1 − ε (ζ )) dζ L
m=
(14)
S
0
yielding m(L). Matching m(t) = m(L) allows for calculations of cake thickness L as a function of time t while integrating Eq. 4 with now known function "(z) yields 'pL across the cake. An example of such calculations was performed using the following values of the parameters that represent typical MBR conditions: u = 8.5 $m/s = 18 gfd = 30.5 L m-2 h-1, "S = 0.6, "c = 0.18, #S = 1.03 g/cm3, d = .2 $m, initial Xb = 15 g/L. The exponent g was assumed 2.1 as postulated by the percolation theory. The value of KE was adjusted to match E = 2.2 Pa at solids concentration of 10 g/L as found by Hermanowicz (1993). Permeability k(") was calculated either from Eq. 6 or Eq. 7. The results are shown in Figures 2 and 3. Fig. 2 shows porosity profiles and liquid pressure changes across the depth of evolving cake.
60
0.7 Eq. 7
Eq. 6
0.6 0.5
40
0.4 30 0.3 20
0.2
10
porosity ε
∆ p (kPa)
50
0.1
0
0 0
0.05
0.1
0.15
ζ (mm) Figure 2 Porosity profiles and liquid pressure changes across cakes For both expressions, porosity decreases from the threshold value "S = 0.6 at the suspension/cake interface (& = 0) toward the membrane but the decrease is much more rapid when Eq. 7 (Martys et al.,
1994) used to express permeability. This relationship predicts much smaller permeabilities for the same value of porosity, especially for low ". Hence the required pressure gradient to achieve the same permeate flux u is much higher and cake solids compress more. When the cake porosity at the membrane surface reaches its lowest value "C (0.18 in this case), the cake becomes impermeable and pressure change approaches its terminal value before increasing to infinity. Although the final pressure change across the cake is very close for both cases (approximately 50 kPa or 15 in Hg), the resulting cake thickness in very different (30 $m for Eq. 7 and 112 $m for Eq. 6). In both cases, however, a very small part of the cake next to the membrane exerts the most of hydraulic resistance in accordance with qualitative observations of Hwang and Hsueh (2003). Figure 3 displays overall pressure changes in time. The trends for both permeability models are similar but shifted in time. Since the final cake thickness with Eq. 7 is smaller than with Eq. 6, the accumulated solids mass is also smaller. Hence, according to Eq. 9, similar pressure changes occur much faster.
60 Eq. 7
Eq. 6
p (kPa)
50 40 30 20 10 0 0
500
1000
1500
t (sec) Figure 3 Overall pressure drop across the cake as a function of time Conclusions Although the two versions of the models show significant differences, they both yield porosity and pressure profiles that are plausible for MBR operation. They show realistic pressure changes in time and produce cake structure in agreement with qualitative observations. The purpose of this exercise was not to fit a particular model to any specific set of experimental data but rather to show a possibility of building a theoretical framework based on known fundamental principles and develop a specific model that can predict evolution of solid cake in a plausible way. The results also point to important knowledge gaps in our understanding of the process. Permeability of low-porosity media (including cakes formed from biological solids) is poorly known and yet has a very important impact on the results.
Solids compressibility can be modeled based on theoretical grounds but little is known about its actual behavior. The effects of EPS and colloidal material on permeability have been observed experimentally (Ng and Hermanowicz, in press) but, at present, have not been incorporated into the model because of the lack of quantitative information. Similarly, EPS is likely to have significant effects on solids compressibility and cake consolidation (“stickiness”) but cannot be quantitatively described. In addition, changes of suspension rheology and concomitant changes of mass transfer require a much better description. However, we believe that the value of the proposed framework can be only enhanced with new knowledge and details. References Alon, U., Balberg, I., Drory, A. (1991). New, heuristic, percolation criterion for continuum systems. Phys. Rev. Lett. 66, 2879-2882 Belfort, G., Davis, R.H., Zydney, A.L. (1994). The behaviour of suspensions and macromolecular solutions in crossflow microfiltration. J. Membr. Sci., 96, 1-58 Berkowitz, B., Ewing, R.P. (1998). Percolation theory and network modeling: Applications in soil physics. Surveys in Geophysics, 19, 23-72 Bouhabila E., Ben Aim R., Buisson H. (2001). Fouling characterisation in membrane bioreactors. Separation & Purification Technology. 22-3,123-132 Chang, D.J., Hsu, F.C., Hwang, S. J. (1995). Steady-state permeate flux of cross-flow microfiltration. J. Membr. Sci., 98, 97-106 Cui, Z. F., S. Chang and A. G. Fane, (2003). The use of gas bubbling to enhance membrane processes, J. Membr. Sci., 221, 1-35 Defrance, L., Jaffrin, M.Y., Gupta B., Paullier P., Geaugey, V. (2000). Contribution of various constituents of activated sludge to membrane bioreactor fouling. Bioresource Technol., 73, 105-112 Field, R.W., Wu, D., Howell, J.A., Gupta, B.B. (1995). Critical flux concept for microfiltration fouling. J. Membr. Sci., 100, 259-272 Hermanowicz, S.W. (1993). Theoretical aspects of bulking in activated sludge. Water Environ. Res., 65, 245249 Hodgson, P.H., Leslie, G.L., Schneider, R.P., Fane, A.G., Fell, C.J.D., Marshall, K.C. (1993). Cake resistance and solute rejection in bacterial microfiltration: the role of cellular matrix. J. Membr. Sci., 79, 35-39 Hwang, K.J., Hsueh, C.L. (2003). Dynamic analysis of cake properties in microfiltration of soft colloids. J. Membr. Sci., 214, 259-273 Jönsson, A-S. (1993). Influence of shear rate on the flux during ultrafiltration of colloidal substances, J. Membr. Sci., 79, 93-99 Lee, D. J., Wang, C. H. (2000). Theories of cake filtration and consolidation and implications to sludge dewatering, Water Res., 34, 1-20 Lee, W., Kang, S., Shin, H. (2003). Sludge characteristics and their contribution to microfiltration in submerged membrane bioreactors. J. Membr. Sci., 216, 217-227 Leighton, D.T., Acrivos, A. (1986). Viscous resuspension. Chem. Eng. Sci., 41, 1377-1384 Liu, Y., Fang, H.H.P. (2003). Influences of extracellular polymeric substances (EPS) on flocculation, settling, and dewatering of activated sludge, Crit. Rev. Environ. Sci. Technol., 33, 237-273 Martys, N. S., Torquato, S., Bentz, D. P. (1994). Universal scaling of fluid permeability for sphere packings. Phys. Rev. E, 50, 403-402 Ng, H.Y., Hermanowicz, S.W. (in press). Specific resistance to filtration of biomass from membrane bioreactor reactor and activated sludge: Effects of exocellular polymeric substances and colloidal material. Accepted for Water Environmental Research Normand, J.M., Herrmann, H.J. (1995). Precise determination of the conductivity exponent of 3d percolation using "Percola". Int. J. Modern Physics C - Physics & Computers. 6, 813-817 Otsubo, Y. (1996). Flocculation of colloids by soluble polymers and its effect on rheology. Heterogeneous Chem. Rev., 3, 327-349 Rosenberger, S., Kraume, M. (2003). Parameters influencing filterability of activated sludge in membrane bioreactors. Proc. AWWA Membrane Technol. Conf. March 2 - 5, 2003, Atlanta, GA
Sahimi, M. (1994). Applications of Percolation Theory. Taylor & Francis, London Scher, H., Zallen, R. (1970). Critical density in percolation processes. J. Chem. Phys., 53, 3759-3761 Stauffer, D., Aharony A. (1994). Introduction to Percolation Theory. Taylor & Francis, London Tiller, F.M., Lu, R., Kwon, J.H., Lee, D.J. (1999). Variable flow rate incompactible filter cakes. Water Res., 33, 15-22