included 2 island-generated eddies in the lee of the archipelago and an upwelling fllament from the .... the grid point; C,,, = concentration of chlorophyll at grid ... Light in each bottle was measured with a quantum scalar irra- diance meter QSL-100 (Biospherical Co.) ... (P,,,) were obtained by double integration over day-.
MARINE ECOLOGY PROGRESS SERIES Mar Ecol Prog Ser
1
Published May 12
Mesoscale variability in phytoplankton biomass distribution and photosynthetic parameters in the Canary-NW African coastal transition zone Gotzon Basterretxea*, Javier Aristegui Facultad de Ciencias del Mar, Universidad de Las Palmas de Gran Canaria. 35017 Las Palmas de Gran Canaria, Spain
ABSTRACT: Pigment distribution and photosynthesis versus irradiance (P-E) responses in the mixed layer (ML) and in the chlorophyll maximum (CM) were examined in the coastal transition zone (CTZ) between the NW African coastal upwelling and the Canary Islands during August 1993. The sampling included 2 island-generated eddies in the lee of the archipelago and an upwelling fllament from the African continental shelf, entrained around a cyclonic eddy about 100 km width. Chlorophyll a and P-E parameters (a, P,) showed regional differences reflecting changes in the water column structure and phytoplankton species composition. The deep CM shoaled from -100 to -10 m as the African shelf was approached, and there was a d e a r offshore-onshore transition in the vertically integrated chlorophyll distribution and P-E responses related to the upwelling front. CM oceanic samples presented high a (0.020 to 0.042 mg C mg-' chl h-' [ p 0 1 m-' S-']-') and photoinhibition, indicating adaptation to low irradiance. Differences between CM and ML in P-E responses decreased in the vicinity of the upwelling until they eventually became indistinguishable in a well-mixed station on the continental shelf. Island-generated e d d e s affected mainly the productivity and chlorophyll bstributions at the deep CM. Nutrient input in the eddy center resulted in an increase of a in the CM to the level of the upwelling samples (-0.053 mg C mg-' chl h-' [pmol m-' S-']-'). On the basis of the mesoscale variability in the physical structure of the water column and the vertical distribution of chlorophyll, the CTZ was divided into 4 subregions with characteristic photosynthetic parameters. Average integrated production in these areas varied from -100 mg C m-' d-' in the most oligotrophic subregion to more than 5000 mg C m" d-' in the upwelling zone. The range of variation in the photosynthetic parameters in this CTZ was of the same magnitude as ranges observed in bas~n-scalestudies of the Atlantic. Integrated production estimates are also in the lower and higher extremes of the observed values in the ocean. Our results highlight the importance of addressing the variability of the photosynthetic parameters in coastal upwelling-open ocean transition zones in order to model primary production at regional scales.
KEY WORDS: Phytoplankton . Chlorophyll. Primary production - Coastal transition zone . Filaments. Eddies
INTRODUCTION
Within the context of global climate change and the role of the ocean as a carbon dioxide sink, one of the main goals of biological oceanography has been the description and understanding of algal carbon fixation at regional and global scales. From the efforts of Koblents-Mishke (1983),based on ecosystem classifi-
O Inter-Research 2000 Resale of full article not permitted
cations and ship-based primary production measurements, to the present models based on biogeographical divisions and satellite-obtained ocean color data (e.g. Platt et al. 1988, Longhurst 1995, Sathyendranath et al. 1995), the technique for monitoring phytoplankton photosynthesis has significantly improved. Nevertheless, in global production models, 2 components have changed little: (1)the necessity for in situ observations and (2) the division of the ocean into compartments dependent on a variety of criteria.
Mar Ecol Prog Ser 197: 27-40, 2000
Satellites provide information about sea-surface color fields from which near-surface chlorophyll fields are derived (Gordon et al. 1980).But most complex bio-optical models also require knowledge about depth-resolved optical properties of the water column, and some chlorophyll-specific parameters defining the photoadaptative response of phytoplankton: P,, a, P (Platt et al. 1991, Sathyendranath et al. 1995),the absorption cross section (a') and quantum yield of phytoplankton (Kiefer & Mitchell1983, Bidigare et al. 1987, 1992),or the optimal assimilation efficiency (P,,,) (Behrenfeld & Falkowski 1997a) for the biomass-to-production conversion. An alternative approach is the use of relationships between sea surface temperature (SST) and nitrate concentration and the utilization of nitrate uptake to calculate the f-ratio (allochthonous nitrate-based production to total production ratio) as in Eppley & Peterson (1979) and Sathyendranath et al. (1991).However, this relationship is not useful for most warm oligotrophic water masses where surface concentrations of nitrate are undetectable (Balch & Byrne 1994). The complexity of eco-physiological responses in marine systems renders difficult the computation of universally valid relationships between environmental and primary production changes. Consequently, the ocean has generallv been divided into relatively homogeneous ecological domains (oceanic-coastal waters, polar-temperate-subtropical-tropical waters, etc.)where a general parameterization can be accomplished. Behrenfeld & Falkowski (1997b), in a review of primary production models, concluded that differences in estimates of global annual primary production are due to differences in biomass fields and in the selection of the photoadaptative variables but not to the model itself. Hence, a good estimation of primary production requires appropriate selection of the parameters for each region. Moreover, at smaller scales, the presence of different growth and loss characteristics in phytoplankton populations which are spatially heterogeneous means that the approach used at large scales can here lead to ambiguities (Marra 1980). Specific algonthms that account for local peculiarities (i.e. north-south, east-west gradients) or heterogeneities (recurrent or permanent mesoscale structures) should therefore be developed. Finally, links with contiguous regions to avoid excessively fragmented production maps would be desirable. Coastal transition zones (CTZ) are boundary regions between subtropical gyres and coastal upwelling regions where intense mesoscale variability takes place (Kosro et al. 1991, Strub et al. 1991, Haynes et al. 1993, Barton et al. 1998). The productivity of these areas is uncertain since their intense variability has frequently not been considered. The development of satellite imagery in the last decades has provided evidence that
the boundary between coastal upwelling and open ocean systems is highly irregular. Cold filaments have often been reported in the Canary Current (La Violette 1974, Van Camp et al. 1991, Hernindez-Guerra et al. 1993) and other eastern boundary currents (Davis 1985, Flarnent et al. 1985, Kelly 1985, Shannon et al. 1985, Huyer & Kosro 1987, Strub et al. 1991, Swenson et al. 1992). These structures transport cold upwelled water from the shelf into the ocean, and their return flow introduces warm offshore waters to the nearshore zone (Mooers & Robinson 1984).Nutrient distributions and plankton biomass and production are also affected (Traganza et al. 1980, Abbott & Zion 1985, Abbott et al. 1990, Hood et al. 1991). Most observations have led to speculation that filaments act as vehicles to link rich shelf waters with open ocean oligotrophic waters (Mooers & Robinson 1984, Rienecker et al. 1985).Nevertheless, uncertainties remain about the origin of filaments and their contribution to seaward transport of coastal water. Because filaments are relatively persistent and recurrent (e.g. Haynes et al. 1993), they may be especially important to the nutrient and carbon fluxes of coastal transition zones. The horizontal exchange of organic material and nutrients between filament and surrounding offshore waters could sustain high production rates outside the upwelling zone, or, alternatively, nutrient upwelling generated by the filament dynamics could significantly contribute to the offshore productivity (Jones et al. 1991). In the present paper we examine the spatial and vertical distribution of phytoplankton biomass and photosynthesis versus irradiance (P-E) parameters, in a region including the Canary Islands and the nearby NW African Upwelling (NWAU). The transition from the rich coastal upwelling waters to the offshore oligotrophic system covers a region with distinct but closely linked physical and biological characteristics. Vertical stability promoted by thermal stratification, and consequently vertical transport of nutrients, varies from offshore to shelf waters but also varies in relation to mesoscale structures. Recent work has provided evidence of the importance of local mesoscale processes in phytoplankton biomass distribution and production m the Canary Islands (e.g. Aristegui et al. 1997). Knowledge of the effects of these mesoscale forcing functions on biomass accumulation and production is of critical importance when estimating regional and global carbon fixation rates.
METHODS
Field sampling. The observations reported in this paper were carried out during 4 to 27 August 1993 on
Basterretxea & Aristegui: Variability In phytoplankton dlstnbutlon
board B 1 0 'Hesperides'. The area under study covered the transition zone between the NWAU and offshore waters of the Canarian Archipelago. A transect across the islands to the African shelf was followed by a mesoscale survey of a coastal filament entrained around a cyclonic eddy and an adjacent island-generated eddy (Fig. 1). The eddy position was traced with lagrangian drifters (Barton et al. 1998) and sampled twice (C and D, Fig. 1) over an interval of 5 d. At the center of the eddy (Stn 174) a 24 h sampling was carried out. CTD data were obtained at each station using a Sea Bird SBE-911 plus probe mounted on a 24 bottle rosette equipped with 12 1 Niskin bottles. A Sea Tech fluorometer was attached to the system. Data from the CTD sensors were calibrated against reversible thermometer readings and salinity analyses (Autosal 2000) of discrete samples. The in situ fluorometer was calibrated with samples collected at 6 to 8 depths withn the upper 100 m of the water column. For this, 500 m1 samples were filtered through Whatman GF/F fiberglass filters and extracted overnight in 10 m1 of 90% acetone at 4°C in the dark. For size fractionation, the same volume was filtered through 2 pm Millipore polycarbonate filters. Fluorescence before and after acidification was measured with a Turner Designs bench fluorometer (Holm-Hansen et al. 1965),calibrated with pure chlorophyll a (Sigma Chemical Corp.). Underwater scalar photosynthetically available radiation (PAR) profiles were measured using a QSP-200 sensor (Biospherical) and a QSR-240 sensor for on deck referencing.
29
Chlorophyll transport was calculated from ADCP records (see Barton et al. 1998) as in Jones et al. (1991). To calculate the transport J, the flux over an area centered on the grid point i,j, was integrated: J
=
CJ,,, i,j
J.. l,]
-
vf .C.',I.LXL l,]
2
c,,
where = velocity perpendicular to a transect plane at the grid point; C,,,= concentration of chlorophyll at grid point i,j;L,,L, = length of the box around grid point i,j in the horizontal and vertical directions, respectively. Primary production. Samples for primary production experiments were taken at 2 depths generally corresponding to the mixed layer (ML) and to the chlorophyll maximum (CM). All production stations were sampled around local noon to avoid die1 variations of photosynthetic parameters (MacCaull & Platt 1977). P-E curves were performed in incubators containing 23 culture flasks (80 ml), where a light gradient up to -1900 pm01 m-' S-' was created using a halogen lamp as a light source. Neutral density filters were used to attenuate the light intensity in the incubator. Light in each bottle was measured with a quantum scalar irradiance meter QSL-100 (Biospherical Co.), and 7 to 14 pCi of I4C-labeled sodium bicarbonate solution was added to each bottle. In situ temperatures were reproduced inside the incubator with a cooling bath to within + O.l°C. The added activity was estimated at the beginning of the incubation by counting 1 m1 of solution in a vial with Protosol (NEN) and scintillation
CANARY ISLANDS
Fuerteventura
. .
. .
26 ) -19
.
m
/
I
I
I
I
l
I
-1 8
-17
-1 6
-1 5
-1 4
-13
-12
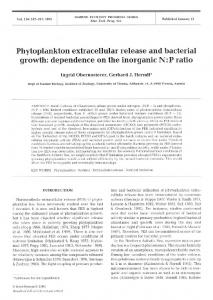
Longitude ( W ) Fig. 1. Map of stations. C and D mark the position of an island-generated eddy in 2 surveys. A to B marks the position of the transect represented in Fig. 3. T1, T2 and T3 are the transects for which chlorophyll transport was calculated (Table 1).The region was divided into zones G1,G2.G3 and G4 for primary production estimations
Mar Ecol Prog Ser 197: 27-40, 2000
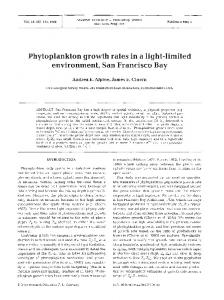
cocktail. After 3 h of incubation, samples were filtered using low vacuum pressure (50 m uplift) and exaggerated by the steep isothermal decline on its western side. This isoline deepening is caused by an adjacent anticyclonic structure observed in AVHRR images in the vicinity of Tenerife (Barton et al. 1998). West of La Palma (Stn 3) a third dome affecting the upper 80 m is also observed. The deep CM shoals in a west-east direction from 90 to 110 m at the westernmost stations to 10 m over the continental shelf. Intense doming due to eddies produces the elevation of the deep CM, as seen in the periphery of the eddy of Gran Canaria. This effect has been extensively discussed by Anstegui et al. (1997).
Fueneverura
m W >
W
1
A
2
3
4
6
6
7
8
9
137 144
A
152 99
91
83
72
65
51
56
B
.50 E
.l00
5
a
a,
-200
Fig. 3. Contour plots of temperature ("C;middle panel, a) and chlorophyll (mgm-3;loscrerpanels, b) along Transect A-B (dashed l ~ n e sindlcate the location and depth of P-E experiments; grey line marks the depth of 1 surface irradiance). . k e s for P-E curves are P (mg C mg chl a h , ' ) and E [pmol m-' s l ) . The position of the ~slandshas been sketched as a reference (upper panel)
Basterretxea & Aristegui: Variat~ h t yin phytoplankton distribution
3:
0
200
400
600
Distance ( K m )
Fig. 4. Percentage of chlorophyll a > 2 pm in a W-E transect in the mixed layer (a) and in the chlorophyll maximum (m)
Although the upwelling filament and its terminal eddy extend 100 km offshore to Stn 99, high surface chlorophyll values (> 1 mg m-') are restricted to the stations in the upwelling area. Stn 65 is placed in the boundary between high-pigment-content upwelled waters and waters in the filament where values higher than those offshore are encountered only in the deep CM. A shift in the community structure also occurs at this point. Size fractionation of chlorophyll reveals picoplankton as the dominant size fraction outside the upwelling, accounting for 75 to 88% of the total biomass (Fig. 4). This percentage dramatically changes in upwelled waters and particularly in the front between both water masses (Stn 65) where large cells ( > 2 pm) dominate (80%). At this station a shallow thermocline (23 m depth) is already visible.
Primary production P-E response curves along Transect A-B (Fig. 3b, Table 2) display a clear offshore-onshore transition. Two trends in the phytoplankton light response are particularly clear across the CTZ: (1) there is an increase in the magnitude of the P-E parameters as the nutrient-rich upwelling waters are approached and (2) the photosynthetic responses in the ML and CM become progressively alike as mixing increases towards the coastal upwelling. ML and CM parameters for the station on the continental shelf (Stn 56), where nutrient concentrations are high (almost 4 pM at 10 m), are similar and do not present significant photoinhibition. Both parameters are amongst the hghest measured (average P, and a, 12.11 + 0.9 mg C mg-' chl h-' and 0.052 mg C mg-' chl h-' [pmol m-2 S-']-', respectively). By contrast, in open ocean waters differences between ML and CM parameters increase. Most CM samples exhibit higher a values and photoinhibition, indicating enhanced photosynthetic efficiency and adaptation to low irradiances in deep phytoplankton assemblages. The Light adaptation parameter Ek (P,/a) averages 267 + 72 and 93 + 49 pm01 m-2 S-' in the ML
33
and CM, respectively. Of particular interest are the parameters at Stns 76 and 166 (Table 2). The former is located in the southern boundary of the filament. A high assimilation number (11.4 mg C mg-' chl h-') was measured in the ML at this station, while at the deep CM, P, is closer to the values observed in the rest of the filament structure. Conversely Stn 166, located in the island-generated eddy, shows anomalous h g h photosynthetic values in the CM sample (P, = 6.94 mg C mg-' chl h-' and a = 0.52 mg C mg-' chl h-' [pmol m-2 S-']-'). Similar a values in CM samples were measured only in the cyclonic eddy southwest of La Gomera (Stn 6) and over the African shelf (Stn 56). Nitrate concentrations at the subsurface sampling depth at these 3 stations were above detectable levels (>OS PM), an indication of nutrient-nch water upwelling or nutricline uplifting. P-E parameters estimated for the ML at the 24 h station in the center of the eddy (Stn 174) displayed similar midday values (a = 0.008 mg C mg-' chl h-' [pmol m-' S-']-' and P, = 2.88 mg C mg-' chl h-') to the nearby Stn 166, placed in a more marginal zone. There was a significant diurnal variation in light-saturated and Light-limited photosynthesis (CV = 0.54 and 0.31), with maximum rates close to midday, but a presented Table 2. P-E curve parameters a (mg C mg-' chl h" (pm01m-2 S-']-'), P, (mg C rng-' chl h-'), p (mg C mg-' chl h-' (pmol m-' S-']-'). P,,, (mg C mg-' chl h-') and sampling depth (m) Stn
Depth
a
PS
P
1 6 18 41 56 65 76 83 91 99 132 144 166
20 15 15 10 3 20 10 10 10 10 10 10 10
0.003 0.005 0.008 0.015 0.053 0.075 0.012 0.01 1 0.016 0.014 0.009 0.003 0.007
2.61
0.0017
1 6 18 41 56 65 76 83 91 99 132 144 166
80 80 80 30 20 40 40 50 70 70 60 75 60
0.023 0.055 0.020 0.027 0.052 0.035 0.034 0.042 0.035 0.020 0.023 0.032 0.052
pm
1.62 1.75 4.16 13.02 9.08 11.42
0.0071 3.05 2.89 3.53
5.30
0.0025 0.68 2.81
1.93 3.11 2.27 5.81
0.0020 0.0053 0.0025 0.0047
8.72 5.51 5.87 5.87 0.60 3.85 2.82 6.94
0.0105 0.0047 0.0106 0.0109 0.0012 0.0013 0.0026 0.0106
11.21
Mar Ecol Prog Ser 197: 27-40,2000
-
Time (h) Fig. 5. Plots of P, (e)and a Stn 174. A sine curve
P,(t) (MacCaull &
(0) over
time for a die1 cycle at
b, + b,2-"[l+ cos(21r/24)(t- b,)]" Platt 1977) for n = 1 has been overlaid as a reference =
some random oscillations (Fig. 5). Nevertheless, these variations should be carefully interpreted since there is evidence that prolonged ( > l h) incubations may be biased by photoadaptative responses occurring on time scales of the same order or shorter than the incubation time that result in P-E variability (Lewis & Smith 1983).
With the aim of attaining general parameters to be used in a regional production model, we have grouped the stations where P-E experiments were carried out into 4 groups, according to the thermal structure of the water column and to the vertical distribution of phytoplankton biomass (Fig. 6). G1 includes the stations representative of offshore conditions with a deep CM around 100 m depth. This distribution is typical of warm offshore regions (Venrick et al. 1973, Herbland & Voituriez 1979, Cullen & Eppley 1981). Stations in the offshore extension of the filament or in the islandgenerated eddies (Stns 6 and 166) are included in G2. The latter present a thermocline structure similar to the waters of the filament although surface temperatures (>22"C) are in the range of offshore waters. G3 and G4 include stations in the upwelling front and on the continental shelf. Stn 76 shares characteristics with G2 and G3. Although it is far from the shelf, the structure of the water column, the vertical pigment distribution and the temperature-salinity characteristics at this location (Fig. 7) make it conform most to G3. Nevertheless, some other characteristics like the percentage of cells >2 pm (13% at Stn 76 and 49% at Stn 41) or the relation between the 1% light depth, deep CM
-
I emperature
Fig. 6. Temperature ("C)and chlorophyll profiles (mg m-3)for Uferent groups of stations (see 'Results, Primary production' for
group descriptions)
Basterrebtea & Anstegui: Variabihty in phytoplankton distribution
l4
1, ; .,
,
, ,
Q$
, ,
(?
,
,
.;.
,l
z%'>
35
Fig. 8. Plot of grouped z,, (depth of the chlorophyll maximum), z,, (depth of 1% PAR) and thermocline depth
12
35.5
36.0
36.5
37.0
37.5
Salinity Fig. 7. Temperature-salinity characteristics (0 to 200 m) of P-E stations
and thermocline depths (Fig. 8) indicate similarities with the stations in the offshore filament. Temperature-salinity plots (Fig. 7) reveal that along the CTZ gradient the upwelled water is mixed to varying degrees with offshore waters. The progressive transition in thermo-haline properties is disrupted by the gap between the stations placed farther offshore in the filament (Stns 91 and 99) and Stn 18 located only a few kilometers north. This gap separates upwellinginfluenced waters from offshore and eddy waters. Tables 3 & 4 synthesize some characteristics of each of the groups (Stn 76 has been excluded from averages). Chlorophyll profile parameters show clear differences between groups as result of the progressively and the sinking chlorophyll maximum depth (2), increase of the 1% light depth (2,") towards oceanic
waters. In fact, there is a constant relation between these 2 parameters averaged by groups (Fig. 8). This is not the case with photosynthetic parameters. Stations affected by island-generated eddies do not fit well in G2 (Table 4 ) and have been treated as a separate group. Surface parameters in the eddies are in the range of G1, but values in the CM are clearly enhanced. The value of a is similar to that in the coastal upwelling and P, is in the range of G3. We calculated daily production rates per unit surface (P,,,) for each of the areas indicated in Fig. 1 ( G l , G2, G3 and G4) and for the cyclonic eddies based on ML parameters. Calculations were performed by 4 different methods: (1) averaging estimates of the stations in each region, (2) calculating an average P-E curve for each region and using the measured chlorophyll distribution for each station, (3) averaging the non-uniform biomass curve parameters for each region and applying the measured P-E curve for each station, and (4) using an average P-E curve and an average biomass profile for each region. Results from all 4 methods were very similar and maximum deviations (CV
150) ratios in the surface layers between 25 and 35 degrees of latitude. An alternative, but not excluding, explanation is a zooplankton control over the newly produced biomass. A coupled phytoplankton-herbivore system in which grazing limits the standing crop has been suggested as an explanation for open ocean high-nutrient low-chlorophyll situations (Walsh 1976, Minas et al. 1986, Cullen et al. 1992a),but could also be applicable for most subtropical areas. In these regions mesoscale and smaller scale physical processes would control productivity. In conclusion, our results show that transition zones between highly productive upwelling systems and oligotrophic open ocean waters present a large variability in photosynthetic parameters. Unless this variability is considered in productivity models, regional production estimations can be greatly biased. Acknowledgements. We wish to thank Dr E. D. Barton for his helpful comments and corrections, and the crew and technical staff of the B10 'Hesperides' for their invaluable help during the Cruise. This work was supported by project FR&ES [CICYT,A M B 95-0731), and through MAST I Program 0031 and the CANIGO program of the European Commission.
LITERATURE CITED Abbott MR, l i o n PM (1985) Satellite o~servafionsof P ~ Y M plankton variability durinq- a n upwell~nqevent. Contin Shelf Res 43661-680
Basterretxea & Anstegui: Variability in phytoplankton distribution
Abbott MR, Brink KH, Booth CR, Blasco D, Codispoti LA, Niiler PP, Ramp SR (1990) Observations of phytoplankton and nutrients from a Lagrangian drifter off northern California. J Geophys Res 95(C6):9393-9409 M s t e g u i J , Sangra P, Hernandez-Leon S, Canton M, Hernandez-Guerra A. Kerling JL (1994) Island-induced eddies in the Canary Islands. Deep-Sea Res 41: 1509-1525 Aristegui J , Tett P, Hernandez-Guerra A, Basterretxea G, ~MonteroMF, Wlld K, Sangra P, Hernandez-Leon S, Canton M, Garcia-Braun JA. Pacheco IM, Barton ED (1997) The influence of island-generated eddies on chlorophyll distribution: a study of mesoscale variation around Gran Canaria. Deep-Sea Res 44(1):71-96 Austin RW (1974) The remote sensing of spectral radlance from below the ocean surface. In: Jerlov NG, Nielsen ES (eds) Optical aspects of oceanography. Academic Press, San Diego, CA, p 317-344 Balch WM, Byrne CF (1994) Factors affecting the estimate of primary production from space. J Geophys Res 99(C4): 7555-7570 Balch WM, Bowler BC, Byrne CF (1997) Sea surface temperature grahents, baroclinicity, and vegetation gradients in the sea. J Plankton Res 19(12):1829-1858 Barber RT, Smith RL (1981)Coastal upwelling ecosystems. In: Longhurst AR (ed) Analysis of marine ecosystems. Academic Press, London, p 3 1-68 Barton ED (1994a) Frontal structures downwind and downstream of Gran Canaria. Ann Geophysicae 12(II),C267 Barton ED (1994b) European Coastal Transihon Zone: Islas Canarias. Final Report, MAST Project 0031, European Commission, Bangor Barton ED, Anstegui J , Tett P, Canton M, Garcia-Braun J , Hernandez-Leon S, Nykjaer L, Almeida C, Almunia J , Ballesteros S, Basterretxea G, Escanez J, Garcia-Weill L, Hernandez-Guerra A, L6pez-Laatzen F. Molina R, Montero MP, Navarro-Perez E, Rodriguez-PPrez JM, van Lenning K, VClez H, Wild K (1998) The transition zone of the Canary Current upwelllng region. Prog Oceanogr 41(4):455-504 Behrenfeld MJ, Falkowski PG (1997a) Photosynthetic rates derived from satellite-based chlorophyll concentration. Limnol Oceanogr 42(1):1-20 Behrenfeld MJ. Falkowski PG (1997b) A consumer's guide to phytoplankton primary productivity models. Limnol Oceanogr 42(7):1479-1491 Bidigare RR, Smith RC, Baker KS, Marra J (1987) Oceanic primary production estimates from measurements of spectral irradiance and pigment concentrations. Global Biogeochem Cycles 1:171-186 Bidigare RR, Prezelin BB, Smlth RC (1992) Bio-optical models and the ~ r o b l e m sof scalina. * In: Falkowski PG. Woodhead AD (eds) Primary productivity and biogeochemical cycles in the sea. Environmental Science Research. Vol 143. Plenum Press, New York, p 175-212 Brink KH, Beardsley RC, Niiler PP, Abott M, Huyer A, Ramp S, Stanton T,Stuart D (1991) Statistical properties of nearsurface flow in the Cahfornia coastal transition zone. J Geophys Res 96(C8):14693-14706 Cullen JJ, Eppley RW (1981) Chlorophyll maximum layers off the southern California bight and possible mechanisms of their formation and maintenance. Ocean01 Acta 4:23-32 Cullen JJ, Lewis MR (1988) The kinetics of algal photoadaptation in the context of vertical mixing. J Plankton Res 10(5):1039-1063 Cullen J J , Lewis MR, Davis CO, Barber RT (1992a)Photosynthetic characteristics and estimated growth rates ind~cate grazing is the proximate control of primary production in the Equatorial Pacific. J Geophys Res 97539-654
39
Cullen JJ, Yang X, MacIntyre HL (1992b) Nutrient limitation of marine photosynthesis. In: Falkowski PG, Woodhead AD (eds) Primary productivity and biogeochemical cycles In the sea. Plenum Press, New York, p 69-88 Davis RE (1985) Drifter observations of coastal surface currents during CODE: the method and descriptive view. J Geophys Res 90:4741-4755 Dugdale RC, Wilkerson FP (1989) New production in the upwelling center of Point Conception. Cahfornia: temporal and spatial patterns. Deep-Sea Res 36.985-1007 Eppley RW, Peterson BJ (1979)Particulate organic matter flux and the planktonic new production in the deep ocean. Nature 282:677-680 Eppley RW, Renger EH, Harnson WG (1979) Nitrate and phytoplankton production in southern California coastal waters. Lirnnol Oceanogr 24:291-301 Eppley RW, Stewart E, Abbott MR, Heyman U (1985) Estimated ocean primary production from satellite chlorophyll. Introduction to regional differences and statistics from Southern California Bight. J Plankton Res 7:57-70 Falkowski PG, Dubinsky 2, Wyman K (1985) Growth-irradiance relationships in phytoplankton. Lirnnol Oceanogr 30: 311-321 Falkowski PG, Ziemann D, Kolber Z, Bienfang PK (1991) Role of eddy pumping in enhancing primary production in the ocean. Nature 35255-58 Flament P, Armi L, Washburn L (1985)The evolving structure of an upwelling filament. J Geophys Res 90:11?65-11778 Geider RJ, Osborne BA (1992)Algal photosynthesis: the measurement of algal gas exchange. Chapman and Hall, New York Gordon HR, Clark DK, Mueller JL, Hovis WA (1980) Phytoplankton pigments from the Nimbus-7 Coastal Zone Color Scanner: comparisons wlth surface measurements. Science 210:63-66 Haynes R, Barton ED, Pilling I (1993) Development, persistence, and variability of upwelling filaments off the Atlantic coast of the Iberian Peninsula. J Geophys Res 98(C12):22681-22692 Herbland A, Voitunez B (1979) Hydroloqcal structure analysis for estimating the primary production in the Tropical Atlantic Ocean. J Mar Res 37:87-101 Hernandez-Guerra A, Aristegui J , Canton M, Nykjaer L (1993) Phytoplankton plgment patterns in the Canary Islands area as determined using Coastal Zone Colour Scanner data. Int J Remote Sensing 14(7):1431-1437 Herzig R, Falkowski PG (1989)Nitrogen limitation in Isochrysis galbana (Haptoficeae). I. Photosynthetic energy conversion and growth efficiencies. J Phycol 25:462-471 Holm-Hansen 0, Lorenzen CJ, Holmes RW, Strickland JDH (1965) Fluorometric determination of chlorophyll. J Cons Int Explor Mer 30:3-15 Hood RR, Abbott MR, Huyer A (1991) Phytoplankton and photosynthetic light response in the coastal transition zone off northern California in June 1987. J Geophys Res 96(C8):14?69-l4780 Huyer A, Kosro PM (1987) Mesoscale surveys over the shelf and slope in the upwelling region near Point Arena, California. J Geophys Res 92:1655-1681 Jones BH, Mooers CNK, kenecker MM, Stanton T, Washburn L (1991) Chemical and biological structure and transport of a cool filament associated with a jet-eddy system off northern California in July 1986 (OPTOMA21).J Geophys Res 96(C12):2220?-22225 Kelly KA (1985) The influence of winds and topography on the sea surface temperature patterns over the northern California slope. J Geophys Res 90:11783-11798
40
Mar Ecol Prog Ser 197: 27-40, 2000
Kennaway GM, Tett P (1994)A scanning electron microscope Osborne BA, Geider RJ (1986) Effects of nitrate limitation on study of flagellate assemblies from the Hesperides Cruise photosynthesis in the diatom Phaeodactilum tricornutum Bohlin (Bacillariophyceae). Plant Cell Environ 9:61?-625 9308. Data Report 0031-17, School of Ocean Sciences, Platt T, Gallegos CL, Harrison WG (1980) Photoinhibition of University of Wales, Bangor photosynthesis in natural assemblages of marine phytoKiefer DA, Mitchell BG (1983) A simple steady state descripplankton. J Mar Res 38:687-701 tion of phytoplankton growth based on absorption cross Platt T, Sathyendranath S, Caverhill C, Lewis MR (1988) section and quantum efficiency. Limnol Oceanogr 28: Oceanic primary production and available light: Further 770-776 algorithms for remote sensing. Deep-Sea Res 35:855-879 Koblents-Mishke 0 1 (1983) An attempt to classify the marine Platt T, Caverhill C, Sathyendranath S (1991) Basin-scale estipelagic ecosystems on the basis of primary production and mates of oceanic primary production by remote sensing: its spatial variability. Oceanology 23(2):233-239 Kosro PM, Huyer A, Rampt SR, Smith RL, Chavez FP, Cowles The North Atlantic. J Geophys Res 96:15147-15159 TJ, Abbott MR. Strub PT, Barber RT, Jessen P, Small LF Platt T, Sathyendranath S, Ulloa 0. Harrison WG, Hoepffner (1991)The structure of the transition zone between coastal N, Goes J (1992) Nutrient control of phytoplankton photowaters and the open ocean off northern California, winter synthesis in the Western North Atlantic. Nature 356: and spring 1987. J Geophys Res 96(C8):14707-14730 229-231 Rienecker MM, Mooers CNK, Hagan DE, Robinson AL (1985) Kostianoy AG, Zatsepin AG (1996) The West African coastal upwelling filaments and cross-frontal water exchange A cool anomaly off northern California: an investigation conditioned by them. In: Dejenidi S (ed) The coastal ocean using IR imagery and in sjtu data. J Geophys Res 90: in a global change perspective. J Mar Syst 7:349-359 4807-4818 Kyewalyanga MN, Platt T, Sathyendranath S, Lutz VA, Stuart Sathyendranath S, Platt T, Horne EPW, Harrison WG, Ulloa V (1998) Seasonal variations in physiological parameters 0, Outerbridge R, Hoepffner N (1991) Estimation of new of phytoplankton across the North Atlantic. J Plankton Res production in the ocean by compound remote sensing 20(1):17-42 Nature 353:129-133 La Violette PE (1974) A satellite-aircraft thermal study of the Sathyendranath S, Longhurst A, Caverhill CM, Platt T (1995) upwelled waters off Spanish Sahara. J Phys Oceanogr Regionally and seasonally differentiated primary pro4(4):674-684 duction in the North Atlantic. Deep-Sea Res 42(10): Lewis MR (1992) Satellite ocean color observations of global 1773-1802 biogeochemical cycles. In: Falkowslu PG, Woodhead AD Sathyendranath S, Platt T, Stuart V, Irwin B, Veldhuis MJW, (eds) Primary productivity and b~ogeochermcalcycles in Kraay GW, Harrison WG (1996) Some bio-optical characthe sea. Plenum Press, New York. p 139-153 teristics of phytoplankton in the NW Indian Ocean. Mar Lewis kIR, Snull~JC ji963j A brnclli volume, ~ i l u ~ i - i l ~ ~ u L d i i u ~ ~ -Ecol Proy Ser 132:293-311 time method for measurement of photosynthesis as a funcShannon LV, Walters NM, Mostert SA (1985) Satellite obsertion of incident irradiance. Mar Ecol Prog Ser 13:99-102 vations of surface temperature and near-surface chloroLewis MR, Horne EPW, Cullen JJ, Oakey NS, Platt T (1984) phyll in the southern Benguela region. In: Shannon LV (ed) South African Ocean Color and Upwelling ExTurbulent motions may control phytoplankton photosynthesis in the upper ocean. Nature 31 1(5981):49-50 periment. Sea Fisheries Research Institute, Cape Town, Longhurst A (1995) Seasonal cycles of pelagic production and p 183-210 consumption. Prog Oceanogr 36:77-167 Strub PT. Kosro PM, Huyer A (1991) The nature of cold filaMacCaull WA, Platt T (1977) Die1 variations in the photosynments in the California current system. J Geophys Res thetic parameters of the coastal marine phytoplankton. 96(C8):14743-14768 Limnol Oceanogr 23:723-731 Swenson MS, Niiler PP, Brink KH, Abbott MR (1992) Dnfter Maraiion E, Holligan PM (1999)Photosynthetic parameters of observations of a cold filament off Point Arena, California. phytoplankton from 50" N to 5 0 " s in the Atlantic Ocean. in July 1988 J Geophys Res 97(C3):3593-3610 Mar Ecol Prog Ser 176:205-214 Taylor AH, Geider RJ, Gilbert FJH (1997) Seasonal and latitudinal dependencies of phytoplankton carbon-to-chloroMargalef R (1982) Ecologia Omega, Barcelona phyll a ratios results of a modelling study. Mar Ecol Prog Marra J (1980) Vertical mixing and primary production. In: Falkowski PG (ed) Primary productivity in the sea. EnviSer 15251-66 ronmental Science Research, Vol 19. Plenum Press, New Traganza ED, Nestor DA, McDonald AK (1980) Satellite York, p 121-137 observations of a nutrient upwelling off the coast of CaliMinas HJ, Minas M, Packard TT (1986) Productivity in fornia. J Geophys Res 85:4104-4106 upwelling areas deduced from hydrographic and chemiVan Camp L, Nykjaer L, Mittelstaedt E. Schlittenhardt P cal fields. Limnol Oceanogr 31:1182-1206 (1991) Upwelling and boundary circulation off Northwest Mooers CNK, Roblnson AL (1984) Turbulent jets and eddies Africa as depicted by infrared and visible satellite obserin the California Current and inferred cross-shore transvations. Prog Oceanogr 26:357-402 ports. Science 223:51-53 Venrick EL, McGowan JA, Mantyla AW (1973) Deep maxima Navarro-Perez E, Barton ED (1998)The physical structure of of photosynthetic chlorophyll in the Pacific Ocean. Fish Bull US 71:41-52 an upwelling filament off the north-west African coast Walsh J J (1976) Herbivory as a factor in patterns of nutrient during August 1993. In: Pillar SC, Moloney CL, Payne AIL, utilization in the sea. Limnol Oceanogr 21:l-13 Shillington FA (eds) Benguela dynamics: impacts of variability on shelf-sea environments and their hving Webb WL, Newton M, Starr D (1974) Carbon dioxide exresources. S Afr J Mar Sci 19:61-74 change of Alnus rubra: a mathematical model. Oecologia 17:281-291 Olaizola M, Ziemann DA, Bienfang PK, Walsh WA, Conquest Wilkerson FP, Dugdale RC (1987)The use of large shipboard LD (1993) Eddy-induced oscill~ations of the pycnoclfne affect the floristic composition and depth distribution of barrels and drifters to study the effects of coastal upphytoplankton in the subtropical Pacific. Mar Biol 116: welling on phytoplankton dynamics. Limnol Oceanogr 32: 533-542 368-382 Editorial responsibility: Otlo Kinne (Editor), Oldendorf/Luhe, Germany
S u b m ~ l t e dM : a y 17, 1999; Accepted: October 26, 1999 Proofs rece~vedfrom duthor(s):April 11, 2000