22 Dec 2003
15:31
AR
AR205-PH66-10.tex
AR205-PH66-10.sgm
LaTeX2e(2002/01/18) P1: IBC 10.1146/annurev.physiol.66.032102.115105
Annu. Rev. Physiol. 2004. 66:239–74 doi: 10.1146/annurev.physiol.66.032102.115105 c 2004 by Annual Reviews. All rights reserved Copyright ° First published online as a Review in Advance on October 15, 2003
METABOLIC RATE AND BODY TEMPERATURE REDUCTION DURING HIBERNATION AND DAILY TORPOR Fritz Geiser Zoology, Center for Behavioural and Physiological Ecology, University of New England, Armidale, NSW Australia 2351; email:
[email protected]
Key Words body mass, body temperature, metabolic inhibition, temperature effects, thermal conductance, thermoregulation ■ Abstract Although it is well established that during periods of torpor heterothermic mammals and birds can reduce metabolic rates (MR) substantially, the mechanisms causing the reduction of MR remain a controversial subject. The comparative analysis provided here suggests that MR reduction depends on patterns of torpor used, the state of torpor, and body mass. Daily heterotherms, which are species that enter daily torpor exclusively, appear to rely mostly on the fall of body temperature (Tb) for MR reduction, perhaps with the exception of very small species and at high torpor Tb, where some metabolic inhibition may be used. In contrast, hibernators (species capable of prolonged torpor bouts) rely extensively on metabolic inhibition, in addition to Tb effects, to reduce MR to a fraction of that observed in daily heterotherms. In small hibernators, metabolic inhibition and the large fall of Tb are employed to maximize energy conservation, whereas in large hibernators, metabolic inhibition appears to be employed to facilitate MR and Tb reduction at torpor onset. Over the ambient temperature (Ta) range where torpid heterotherms are thermo-conforming, the Tb-Ta differential is more or less constant despite a decline of MR with Ta; however, in thermo-regulating torpid individuals, the Tb-Ta differential is maintained by a proportional increase of MR as during normothermia, albeit at a lower Tb. Thermal conductance in most torpid thermo-regulating individuals is similar to that in normothermic individuals despite the substantially lower MR in the former. However, conductance is low when deeply torpid animals are thermo-conforming probably because of peripheral vasoconstriction.
0066-4278/04/0315-0239$14.00
239
22 Dec 2003
15:31
240
AR
AR205-PH66-10.tex
AR205-PH66-10.sgm
LaTeX2e(2002/01/18)
P1: IBC
GEISER
INTRODUCTION Endothermic mammals and birds have the ability to maintain a constant high body temperature (Tb) over a wide range of ambient temperatures (Ta).1 Because the surface area/volume ratio of animals increases with decreasing size, many small endotherms must produce substantial amounts of endogenous heat to compensate for high heat loss during cold exposure. As prolonged periods of high metabolic heat production require high food intake and food availability in the wild often fluctuates, the cost of thermoregulation may become prohibitively expensive. This is one of the reasons why not all mammals and birds are permanently homeothermic (i.e., maintain a constant high Tb), but during certain times of the day or the year enter a state of torpor (9, 92, 106). Torpor in these heterothermic endotherms is characterized by a controlled reduction of Tb, metabolic rate (MR), and other physiological functions. The Tb during torpor falls from high normothermic values of ∼32 to 42◦ C to values between −3 to < 30◦ C, and the minimum torpid metabolic rate (TMR) is on average reduced to 5–30% of the basal metabolic rate (BMR) (3, 50). TMR can be less than 1% of the normothermic resting metabolic rate (RMR) in some species at low Ta, emphasizing the effectiveness of torpor in reducing MR. Although MR during torpor may be a fraction of that in normothermic individuals, regulation of Tb during torpor is not abandoned. Tb is regulated at or above a species- or population-specific minimum by a proportional increase in heat production that compensates for heat loss (30, 71). During entry into torpor, the hypothalamic set point (Tset) for Tb is down-regulated ahead of Tb (73). Only when Tb reaches the low Tset during torpor after a cooling episode is metabolic heat production used to maintain Tb at or above this minimum Tb. However, when undisturbed and in steady-state torpor at Ta above the minimum Tb, torpid endotherms are thermo-conforming. The Tb-Ta differential in this temperature range is usually small, ∼1–3◦ C (140, 142, 159), and a reduction of Ta does not result in an increase of TMR, instead it falls with Tb until a new equilibrium is reached. Nevertheless, at any time, disturbance can result in a rise of Tset in torpid individuals, initiating thermoregulation. Moreover, induced torpor in the laboratory may not always result in steady-state torpor, especially when animals are not allowed to undergo their natural daily or seasonal Tb cycle, and may result in a Tset and TMR that are well above the minima characteristic for the species under investigation (51). Higher than characteristic minima are obviously also observed when not enough time is allowed for reaching the steady-state minima. In addition to possessing the ability to thermoregulate during torpor, heterothermic endotherms can rewarm themselves from the low Tb during torpor by using endogenous heat production, although recent evidence from the field shows that passive rewarming also plays an important role (18, 53, 56, 97, 123, 150, 157). 1
Abbreviations: Tb, body temperature; Ta, air temperature; C, apparent thermal conductance; TNZ, thermoneutral zone; Tlc, lower critical temperature of the TNZ; MR, metabolic rate; BMR, basal metabolic rate; TMR, torpid metabolic rate; RMR, resting metabolic rate.
22 Dec 2003
15:31
AR
AR205-PH66-10.tex
AR205-PH66-10.sgm
LaTeX2e(2002/01/18)
METABOLIC RATES DURING TORPOR
P1: IBC
241
In placental heterotherms, brown fat appears to be a major tissue involved in endogenous heat production during arousal via nonshivering thermogenesis, whereas in birds, monotremes, and marsupials, which appear to lack functional brown fat (128), shivering appears responsible for much of the heat produced (19, 47, 66, 111, 125).
PATTERNS OF TORPOR Most heterothermic mammals and birds appear to use one of two common patterns of torpor: hibernation or prolonged torpor in the hibernators and daily torpor in the daily heterotherms. Hibernation is often seasonal and usually lasts from late summer/autumn to late winter/spring. However, hibernators do not remain torpid throughout the hibernation season. Bouts of torpor, during which Tb is low and bodily functions are reduced to a minimum, last for several days or weeks, but are interrupted by periodic rewarming and brief (usually less than one day) normothermic resting periods with high Tb and high energy turnover (32, 46, 88, 95, 158). Hibernators, which currently include many mammals but only a single bird species, are generally small, and most weigh between 10 and 1000 g, with a median mass of 85 g (50). However, the entire mass range of hibernators for which metabolic data are available, including black bears (Ursus americanus), is ∼5 to 80,000 g. Nevertheless, deep torpor with a reduction of Tb by more than 10◦ C is restricted to species weighing less than 10 kg. Many hibernators fatten extensively before the hibernation season, refuse to hibernate when lean, and rely to a large extent on stored fat or food for an energy source in winter. Hibernating species usually reduce Tb to below 10◦ C, with a minimum of −3◦ C in arctic ground squirrels, Spermophilus parryii (3), and most, with the exception of large carnivores and perhaps tropical hibernators, have Tb minima around 5◦ C (4, 18, 26, 50, 59). The TMR in hibernators is on average reduced to about 5% of the BMR but can be less than 1% of the RMR in normothermic individuals at low Ta. Even when the high cost of periodic arousals is considered, energy expenditure during the mammalian hibernation season is still reduced to below 15% of that the animal would have expended if it remained normothermic throughout winter (152). This enormous reduction in energy expenditure is perhaps best illustrated by the fact that many hibernating mammals can survive for 5 to 7 months entirely on body fat that has been stored prior to the hibernation season (32). Thus energy intake and expenditure in hibernators are not balanced on a daily but rather a yearly basis. Daily torpor in the daily heterotherms is the other widely used pattern of torpor in mammals and, in contrast to hibernation, also commonly in birds (50, 114). This form of torpor is usually not as deep as hibernation, lasts only for hours rather than days or weeks, and is usually interrupted by daily foraging and feeding. On average, daily heterotherms are smaller than hibernators and most weigh between 5 and 50 g, with a median of 19 g, and a range of ∼2 to 9000 g (50). In diurnal heterotherms,
22 Dec 2003
15:31
242
AR
AR205-PH66-10.tex
AR205-PH66-10.sgm
LaTeX2e(2002/01/18)
P1: IBC
GEISER
daily torpor is usually restricted to the night, whereas in nocturnal mammals and birds it is common in the second part of the night and the early morning. However, in the field, two bouts of torpor per day appear common in nocturnal species, and one of these is usually terminated by partially passive arousal via an increase of Ta or exposure to solar radiation (10, 58, 97). Generally, daily torpor is less seasonal than hibernation and can occur throughout the year, although its use often increases in winter. In some species from high latitudes, such as Siberian hamsters (Phodopus sungorus), daily torpor appears to be restricted to winter (67, 95). On the other extreme, in some warm climate species, such as subtropical nectar-eating blossombats (Syconycteris australis), daily torpor is deeper and longer in summer than in winter, and this unusual seasonal pattern appears to be explained mainly by reduced nectar availability in summer (16). Whereas daily torpor often occurs as a response to acute energy shortage, in some species it is employed regularly to balance energy budgets, even when food availability may appear favorable. For example, small arid-zone marsupials of the genus Sminthopsis regularly enter daily torpor in the laboratory when food is freely available (spontaneous torpor), which appears to reflect the generally low energy availability in their natural desert habitat (41, 43). In some hummingbirds, daily torpor at night is used to conserve fat stores for migration on the following day (15). Moreover, the marsupial Mulgara (Dasycercus cristicauda) appears to use spontaneous daily torpor during pregnancy to facilitate fat storage for the following energetically demanding period of lactation (49). Many daily heterotherms, in contrast to most hibernators, do not exhibit extensive fattening prior to the season in which torpor is most commonly employed and typically enter torpor at times when body mass is low (39, 67, 84, 96). Large fat stores, as simulated by administration of the hormone leptin, inhibit daily torpor (55). When food is withheld from small daily heterotherms for several days they will perish (94), whereas hibernators can survive for months. The main energy supply of daily heterotherms, even in the main torpor season, remains ingested food rather than stored body fat, and they appear to balance energy expenditure and uptake on a daily basis. The Tb in daily heterotherms, such as small carnivorous marsupials (e.g., Sminthopsis spp.) and mice (e.g., Peromyscus spp.), usually falls to near 18◦ C, although in some hummingbirds, values below 10◦ C have been reported. In other, mainly large species such as tawny frogmouths (Podargus strigoides) or American badgers (Taxidea taxus), Tb is maintained just below 30◦ C (50, 64, 97). The TMR in daily heterotherms is on average reduced to about 30% of the BMR, although this percentage is strongly affected by body mass and other factors. When RMR at low Ta is used as a point of reference, reductions of MR during daily torpor to about 10–20% of that in normothermic individuals at the same Ta are common. Depending on the species, the duration and intensity of activity, the duration of the torpor bout, and torpor depth, overall daily energy expenditure is usually reduced 50–90% on days when daily torpor is employed, compared with days when no torpor is used (24, 83). Thus torpor bouts in the daily heterotherms are always shorter than one day independent of food supply or prevailing ambient conditions. In contrast, although
22 Dec 2003
15:31
AR
AR205-PH66-10.tex
AR205-PH66-10.sgm
LaTeX2e(2002/01/18)
METABOLIC RATES DURING TORPOR
P1: IBC
243
hibernators usually display bouts of torpor lasting several days or weeks, they are capable of brief torpor bouts of less than one day early and late in the hibernation season or at high Ta (32, 46, 142, 146), which superficially may appear the same as daily torpor in the daily heterotherms and, when it occurs in summer, is often referred to as aestivation. However, it appears that these short torpor bouts in hibernators are functionally nothing but brief bouts of hibernation with TMR well below those of the daily heterotherms even at the same Tb (6, 38, 51, 142, 159). Thus the term daily torpor should not be applied to describe short torpor bouts of hibernators, because it describes only the temporal pattern of Tb fluctuations without considering the apparently functional differences in the mechanism of MR reduction. Whereas the two patterns of torpor described above appear to be the most common, it is likely that not all species conform to these but exhibit some intermediate pattern. However, in some reported cases on intermediate torpor patterns, no longterm experiments with exposure to low Ta have been conducted to clearly establish whether the species is capable of prolonged torpor bouts (e.g., 103, 161). This is an important test because, as is outlined above, hibernators commonly display test drops early in the hibernation season that superficially resemble daily torpor (146). It is interesting that even if such studies are included, heterotherms still clearly fall into two groups (50).
HYPOTHESES ON METABOLIC RATE REDUCTION Whereas most researchers in this field agree that the reduction of MR during torpor is substantial and is pivotal for survival in many species, the mechanisms of how MR is reduced remain controversial. Several, at first glance, mutually exclusive hypotheses attempting to explain the MR reduction during torpor have been proposed. The traditional view is that as Tb and MR fall together at torpor entry and because the Q10 (the change in rate over a 10◦ C increment) between TMR and Tb often approximates 2 (which is typical of biochemical reactions), the MR reduction during torpor below BMR is explained by temperature effects (60, 62, 138). Because unexpectedly high Q10 (>3) have been observed in some species during torpor entry and at high Tb during torpor, it was proposed that a physiological inhibition, in addition to temperature effects, must be involved in the reduction of MR (38, 108, 145). Others have proposed that Tb may have no influence at all on TMR. They argue that MR is down-regulated at torpor entry and the fall of Tb is the consequence of and not the reason for the reduction of MR (68, 69, 127). Finally, it has been suggested that, as during normothermia, MR during torpor is a function of the Tb-Ta differential (68) or that the low TMR may be due to the low apparent thermal conductance (C) in torpid individuals (139). The purpose of this review is to examine these hypotheses with respect to three factors that appear important in determining MR and Tb during torpor: (a) patterns of torpor, (b) state of torpor, and (c) body mass.
22 Dec 2003
15:31
244
AR
AR205-PH66-10.tex
AR205-PH66-10.sgm
LaTeX2e(2002/01/18)
P1: IBC
GEISER
DATA SELECTION AND ANALYSIS For this comparative analysis, data on MR, Tb, and body mass of heterothermic mammals and birds during normothermia and torpor were collected from the literature (Table 1). BMR was used as a reference point for the TMR of thermoconforming individuals because in both physiological states, metabolism is used only for maintenance, without extra energy expenditure for thermoregulation (12, 155). The only torpor values used in this analysis were from studies in which the following conditions pertained: The species appeared to be in steady-state torpor with a TMR below the BMR at some of the measured Ta values, and simultaneous data on Tb were available. For several species it was assumed that at steady-state torpor, Tb was Ta + 1◦ C. In some species, no BMR values were provided and for those species BMR was calculated from allometric equations. To avoid the potential problem arising from temperature corrections, TMR data were statistically analyzed in different Tb bins of 0.0–9.9◦ C, 10.0–14.9◦ C, 15.0–24.9◦ C, and 24.0–32.9◦ C, and both the TMR and the Q10 calculated between BMR and TMR at various Tbs were analyzed as a function of body mass. Data for torpid individuals were collected at Ta both below and above the Tset to examine relations between Tb and MR, MR and the apparent thermal conductance (C), and that between the Tb-Ta differential and MR (Tables 1 and 2). For most variables, data were analyzed separately for daily heterotherms and hibernators because several physiological variables differ significantly between the two groups and because all heterotherms fall into two groups when analyzed by cluster and discriminant analyses (50). Consequently, pooling of the data likely would obscure significant relationships. Data were compared using ANCOVA and t-tests as appropriate, and linear regressions were fitted using the method of least squares. Numeric values are expressed as means ± SD for n, the number of species investigated.
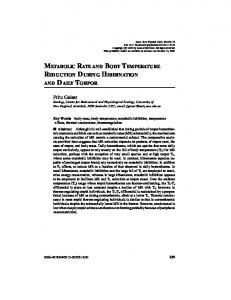
TORPOR ENTRY When an animal enters torpor, the Tset for Tb falls faster than Tb facilitated by thermal inertia (73). As torpor entry usually occurs at low Ta, well below the thermoneutral zone (TNZ) for most species, the fall of Tset should theoretically result in a fall of MR from the resting metabolic rate (RMR) (energetic cost of BMR plus cost of thermoregulation) to BMR (no additional cost for thermoregulation) because heat production for normothermic thermoregulation will cease. This interpretation is supported by empirical data on sugar gliders, Petaurus breviceps (∼120 g), which, when they become torpid in the laboratory, usually do so early in the morning, but on days when they remain normothermic, they lower Tb only slightly at the beginning of the rest phase. The transition from a nocturnal active Tset of ∼39◦ C to a diurnal resting normothermic Tset of ∼35◦ C results in a precipitous drop of MR that superficially appears to be a torpor entry (Figure 1). However, MR falls only from RMR to about BMR, although Ta was 10◦ C (∼ 17◦ C
22 Dec 2003
15:31
AR
AR205-PH66-10.tex
AR205-PH66-10.sgm
LaTeX2e(2002/01/18)
P1: IBC
METABOLIC RATES DURING TORPOR
245
TABLE 1 Body mass, body temperatures (Tb), basal metabolism (BMR), torpid metabolism (TMR), and Q10 in heterothermic endotherms Daily Heterotherms
Mass (g)
Tb1 (◦ C)
T b2 (◦ C)
BMR [ml O2/(gh)]
TMR [ml O2/(gh)]
Q10
Reference
13
34.7
16
1.4
0.25
2.5
119
32.6 34.2 34.4 34.1 34.1 34.3 34.1 35 34.3 34.3 34.3 34 34.1 34.1 34.8 34.8 34.8 35.5 34.3
17.5 19.6 16.6 13.7 16.5 19 25.8 15 16 25 30 24.5 19.9 26.6 12 16 25.8 23 24.4
1.43 1.01 1.35 1.2 1.2 1.2 1.2 1.13 0.89 0.89 0.89 1.04 1.06 1.06b 0.98 0.98 0.98 0.5 0.74
0.54 0.45 0.26 0.25 0.3 0.33 0.81 0.25 0.12 0.28 0.52 0.48 0.66 0.84 0.16 0.18 0.38 0.27 0.44
1.9 1.7 2.5 2.2 2.2 2.3 1.6 2.1 3.0 3.5 3.5 2.3 1.4 1.4 2.2 2.5 2.9 1.6 1.7
45 120 45 43
Dasycercus cristicauda Dasyuroides byrnei
8.3 10 11.6 17.3 17.3 17.7 17.3 19 24.8 24.8 24.8 26 26.1 26.1 27.4 27.4 27.4 113 116
Marsupialia (Diprotodontia) Tarsipes rostratus Petaurus breviceps
10 132
36.6 36.3
5 ∼17
2.9 0.74
0.15 0.1
2.6 2.8
161 27
7.3 7.9
35.5 37.5
22 12
1.95 2.63
∼0.55 ∼0.5
2.6 1.9
85 148
9.5
37.3
15
2.23
∼0.4
2.2
148
12.6 17.4 18 20 25 25 25 22 40 28
35 37 37 36.7 35.6 37 35.6 38 38 34.1
16.7 16 21.5 17.6 15.5 20.7 27.7 15 17.1 21
1.05 1.56 1.96 1.66 2.01 2.06 2.01 0.97 1.25 1.315
0.38 ∼0.3 0.55 0.53 0.7 1 1.04 0.2 0.15 0.3
1.7 2.2 2.3 1.8 1.7 1.6 2.3 2.0 2.8 3.1
14 107 115, 117, 40 78, 22 68 67 68 149 153 23
Group/species Mammals Marsupialia (Didelphimorphia) Marmosa sp. Marsupialia (Dasyuromorphia) Planigale gilesi Planigale maculata Ningaui yvonneae Sminthopsis crassicaudata
Sminthopsis murina Sminthopsis macroura
Antechinus flavipes Antechinus stuartii Antechinomys laniger
Rodentia Baiomys taylori Reithrodontomys megalotis longicaudus Reithrodontomys megalotis ravus Gerbillus pusillus Peromyscus eremicus Peromyscus maniculatus Peromyscus leucopus Phodopus sungorus
Perognathus californicus Perognathus hispidus Steatomys pratensis
57 140
35, 39 39 36
94 43
(Continued)
22 Dec 2003
15:31
246
AR
AR205-PH66-10.tex
AR205-PH66-10.sgm
LaTeX2e(2002/01/18)
P1: IBC
GEISER
TABLE 1 (Continued) Daily Heterotherms
Mass (g)
Tb1 (◦ C)
Tb2 (◦ C)
BMR [ml O2/(gh)]
TMR [ml O2/(gh)]
Q10
Reference
Mus musculus Saccostomus campestris
45.5 71
37.4 34
19 28
1.47 0.618
0.3 0.35
2.4 2.6
87 122
2 2 4 10
34.7 34.7 38 35.8
16 22 28 ∼23
5.75 5.75 3.27 2.4
0.6 0.8 1.42 0.9
3.3 4.7 2.3 2.2
33, 34, 31
35.3 34.9 34.9 37
23.1 17.4 27 28.6
1.29 1.3 1.3 1.43
0.7 0.58 1.1 0.67
1.7 1.6 1.2 2.5
5 16, 54
Nyctimene albiventer
16 18 18 28
Carnivora Taxidea taxus
9000
37
28
0.3
0.13
2.5
64
Birds Coliiformes Colius striatus Colius castanotus
51 58
36 38.5
18.2 18
0.83 1.2
0.11 0.1
3.1 3.4
113 133, 81
40 40 40 40 40 40 40 40 39 39 39 39 40 40 40 39.6
23a 21a 16a 24a 17a 23a 13 22.5a 16.6 20.5 24.4 28.8 14 10 18 19.6
3.8 3 3.85 3.85 3.5 3.5 3.36 3.35 3.6 3.6 3.6 3.6 2.83c 3.2 3 2.64
1.24 0.39 0.17 0.54 0.2 0.45 0.43 0.48 0.72 0.84 1.53 2.06 0.5 0.5 1 0.45
1.9 2.9 3.7 3.4 3.5 3.3 2.1 3.0 2.1 2.2 1.8 1.7 1.9 1.9 1.6 2.4
99, 130 99 99
Panterpe insignis Eugenes fulgens Eulampis jugularis Lampornis clemenciae
3.1 3.1 5.4 5.4 3.2 3.2 3.3 3.6 3.5 3.5 3.5 3.5 6 8 8 8
162, 21 162, 21 61 98
Strigiformes/ Caprimulgiformes Caprimulgus argus
75
39
29.6
0.83
0.4
2.2
20
Columbiformes Drepanoptila holosericea
200
37.7
25
0.72
0.27
2.2
135
Passeriformes Delichon urbica
18
40
26
2.4
1.2
1.6
132
Insectivora Suncus etruscus Notiosorex crawfordi Crocidura russula Chiroptera Macroglossus minimus Syconycteris australis
Trochiliformes Selasphorus sasin Calypte costae Calypte anna Archilochus alexandri Selasphorus rufus Selasphorus platycercus
101 124
7
99 99, 76 99 11, 12
(Continued)
22 Dec 2003
15:31
AR
AR205-PH66-10.tex
AR205-PH66-10.sgm
LaTeX2e(2002/01/18)
P1: IBC
TABLE 1 (Continued) Hibernators Mammals Monotremata Tachyglossus aculeatus Marsupialia (Diprotodontia) Acrobates pygmaeus Cercartetus lepidus
Cercartetus concinnus
Cercartetus nanus
Burramys parvus Rodentia Zapus hudsonicus Zapus princeps Muscardinus avellanarius Eliomys quercinus Glis glis Mesocricetus auratus Cricetus cricetus Tamias amoenus Tamias striatus Spermophilus tereticaudus Spermophilus lateralis
Spermophilus mexicanus Spermophilus citellus Spermophilus saturatus
Spermophilus mohavensis Spermophilus richardsonii Spermophilus parryii
Mass (g)
Tb1 (◦ C)
Tb2 (◦ C)
BMR [ml O2/(gh)]
TMR [ml O2/(gh)]
Q10
Reference
2800 2800
32.2 32.2
4 16
0.15 0.15
0.02 0.045
2.0 2.1
1, 127
14 14 12.6 12.6 12.6 18.6 18.6 18.6 36 36 36 36 36 50 50
34.9 34.9 33.7 33.7 33.7 34.4 34.4 34.4 34.3 34.3 34.3 34.3 34.3 36 36
2 6 6.8 13 25.5 6.6 15.6 29 5.9 15 24.5 25 31.4 2.5 9.3
1.08 1.08 1.49 1.49 1.49 1.2 1.2 1.2 0.66 0.66 0.66 0.66 0.66 0.83 0.83
0.042 0.065 0.047 0.1 0.33 0.034 0.092 0.5 0.019 0.054 0.16 0.17 0.341 0.033 0.043
2.7 2.6 3.6 3.7 6.3 3.6 3.9 5.1 3.5 3.7 4.2 4.3 9.7 2.6 3.0
28, 52
22.6 25 33.6 27.7 23.5 70 140 140 90 330 60 87 125 125 200 200 200 200 200 200 240 257 246 257 260 400 400 1000 1000 1000 1000 1000
37.3 37.3 37.2 37.2 35.8 37 ∼37 ∼37 37 36.8 38 38.2 35 36 37.8 36.2 36.5 37.2 37.4 36.2 36.5 38 38 38 35.8 37.1 37.1 37 37 37 37 37
6a 11a 5.5 5.5 11a 7.5a ∼5 ∼17 5 7.5a 1.2 7 11 26 5.4 9.3 9.5 10.9 13.9 ∼8 8a 3.6 5.3 9.3 21.3 5a 15a 4.7 8.2 12.6 17.1 20.7
1.5 1.5 1.55b 1.66b 1.75b 1.22b 0.97b 0.97b 1.19b 0.88 1.69 1.03 0.72 0.78 1.159 0.598 0.82 0.629 0.867 0.85b 0.79b 0.47d 0.47d 0.47d 0.85 0.535d 0.535d 0.51b 0.51b 0.51b 0.51b 0.51b
0.043 0.04 0.042 0.027 0.04 0.034 0.017 0.031 0.07 0.032 0.042 0.06 0.048 0.23 0.045 0.068 0.064 0.068 0.084 0.06 0.018 0.031 0.038 0.048 0.15 0.02 0.04 0.012 0.012 0.014 0.018 0.047
3.1 4.0 3.1 3.7 4.6 3.4 3.5 5.6 2.4 3.1 2.7 2.5 3.1 3.4 2.7 2.2 2.6 2.3 2.7 2.6 3.8 2.2 2.2 2.2 3.3 2.8 3.2 3.2 3.7 4.4 5.4 4.3
118, 121
37, 38
37, 38
142
29, 48
17 89, 91 91 159 104 89, 91 44, 93 154 8 138
126 89, 90 46, 93
6 152 86 13, 80
(Continued)
247
22 Dec 2003
15:31
248
AR
AR205-PH66-10.tex
AR205-PH66-10.sgm
LaTeX2e(2002/01/18)
P1: IBC
GEISER
TABLE 1 (Continued) Mass (g)
Tb1 (◦ C)
Tb2 (◦ C)
BMR [ml O2/(gh)]
TMR [ml O2/(gh)]
Q10
Reference
2500 3100 3100 4000
36.6 ∼36 ∼36 37
7.5 8 21 7a
0.25 0.19 0.19 0.27b
0.022 0.014 0.024 0.032
2.3 2.5 4.0 2.0
30 129
45 45 45 63 63
36.8 36.8 36.8 36.7 36.7
9 16 27 10 18
1.06 1.06 1.06 1.05 1.05
0.025 0.06 0.27 0.079 0.155
3.8 4.0 4.0 2.6 2.8
103
270 1220 360 700 700
32 33 33 35 35
16.5 16.5 16.9 5.2a 16a
0.34 0.27 0.31 0.433 0.357
0.07 0.025 0.02 0.016 0.011
2.8 4.2 5.5 3.0 6.2
91, 77 91, 77
250
∼37
18.3
0.69b
0.12
2.5
18
35 35 35 35 37 37 35.7 35.7 35.7 35.7 36 36 36 37 37.5 36
5 11 21 25 4.5 6a 6.3 15 25 29.4 10.1 16.8 ∼10 5.3a 4.5a ∼10
1.53 1.53 1.53 1.53 2.08b 2.05b 1.36 1.36 1.36 1.36 1.22 1.22 2 1.47b 1.45b 1.2
0.06 0.049 0.23 0.29 0.04 0.024 0.037 0.09 0.215 0.36 0.052 0.14 ∼0.1 0.03 0.04 ∼0.1
2.9 4.2 3.9 5.3 3.4 4.2 3.4 3.7 5.6 8.2 3.4 3.1 3.2 3.4 3.0 2.6
74 74, 79 74, 79 74 131 91 51
Eptesicus fuscus Nyctalus noctula Myotis myotis Tadarida brasiliensis
6 6 6 6 7 7.4 7 7 7 7 10 10 10.4 23.8 25 16.9
Carnivora Ursus americanus
80,000
35
30
0.221
0.042
27.0
156, 4
35 35
37 37
10 20
0.788 0.788
∼0.05 0.086
2.8 3.7
160
Hibernators Marmota flaviventris Marmota marmota Marmota monax Macroscelidea Elephantulus rozeti
Elephantulus myurus Insectivora Setifer setosus Tenrec ecaudatus Erinaceus europaeus Primates Cheirogaleus medius Chiroptera Myotis lucifugus
Barbastella barbastellus Pipistrellus pipistrellus Nyctophilus geoffroyi
Nyctophilus gouldi
Birds Strigiformes/ Caprimulgiformes Phalaenoptilus nuttallii a
- Tb calculated from Ta + 1◦ C.
b
- BMR calculated from 65.
c
- BMR calculated from 21.
d
- BMR corrected for mass from 65.
105
103
147
51 75 91 131 75
22 Dec 2003
15:31
AR
AR205-PH66-10.tex
AR205-PH66-10.sgm
LaTeX2e(2002/01/18)
P1: IBC
METABOLIC RATES DURING TORPOR
249
TABLE 2 Apparent thermal conductance (C) in heterothermic endotherms during normothermia and during torpor while thermo-conforming and thermo-regulating
Group/Species
Mass (g)
C normothermia (ml O2/g/h/◦ C)
Marsupialia (Didelphimorphia) Marmosa sp.
13
0.258
Marsupialia (Dasyuromorphia) Planigale gilesi Ningaui yvonneae Sminthopsis crassicaudata Sminthopsis macroura Antechinomys laniger Dasyuroides byrnei
8.3 11.6 17.3 24.8 27.4 116
Marsupialia (Diprotodontia) Cercartetus lepidus Cercartetus concinnus Cercartetus nanus Petaurus breviceps
C-torpor conforming [ml O2/(gh◦ C)]
C-torporregulating [ml O2/(gh◦ C)]
Reference
0.125
0.253
119
0.33 0.21 0.23 0.19 0.169 0.1
0.145 0.13 0.15 0.09 0.11 0.057
0.38 0.13 0.29 0.26 0.2 0.08
45 45 45 140 36 45
12.6 18.6 36 132
0.21 0.21 0.106 0.051
0.052 0.046 0.023 0.03
0.17 0.17 0.094 0.051
37 37 142 27, 82
Rodentia Phodopus sungorus Steatomys pratensis Spermophilus lateralis Spermophilus parryii Marmota marmota
25 28 200 1000 3100
0.15 0.18 0.04 0.029 0.012
0.13 ∼0.02 0.012 0.004
0.17 0.12 0.03 0.012 0.0072
67, 68 23 144 13, 25 129
Insectivora Suncus etruscus Notiosorex crawfordi Crocidura russula
2 4 10
0.7 0.55 0.285
0.3 0.47 0.22
0.75 0.56 0.25
33, 34 101 124
Chiroptera Macroglossus minimus Syconycteris australis
16 18
0.17 0.16
0.13 0.13
0.15 0.14
5 54, 16
Birds Trochiliformes Selasphorus rufus Panterpe insignis Eugenes fulgens
3.3 6 8
0.45 0.32 0.3
0.35 ∼0.25 ∼0.25
0.7 0.43 0.36
76 162, 21 162, 21
below the Tlc of the TNZ). Thus the initial sharp fall of MR represents only the transient period when thermoregulatory heat production appears to be switched off to facilitate cooling, i.e., from the high normothermic Tb during the activity phase to the slightly lower normothermic Tb during the rest phase. The MR is raised again when the lowered Tset is approached. This transient fall in MR clearly shows that a small reduction in Tset can substantially reduce energy expenditure because of thermal inertia. Thermoregulatory heat production is not required during the
22 Dec 2003
15:31
250
AR
AR205-PH66-10.tex
AR205-PH66-10.sgm
LaTeX2e(2002/01/18)
P1: IBC
GEISER
Figure 1 Metabolic rates measured as oxygen consumption of a sugar glider (Petaurus breviceps) during activity at night and rest during daytime. Note the precipitous drop of the metabolic rate to near BMR during the cooling phase from active to resting body temperatures (data from 82).
cooling phase and can result in a substantial MR reduction without the need for a large change of Tb. Thus the transient fall of MR is not due to the fall of Tb but the fall of Tset. The initial reduction of MR at torpor onset at low Ta in most species follows a similar pattern. However, the Tset is reduced even further, and the substantial change in Tb that follows the reduction from RMR to BMR at torpor onset of most heterothermic species is one of the reasons why MR can fall well below BMR (Figure 2). Thus it is correct that the MR has to fall before Tb can fall, as it is often stated. However, this relationship of the initial MR decline usually explains only the reduction from RMR to BMR, not that from BMR to TMR. Obviously, the scope of the reduction of RMR depends on size. Small mammals and birds (10 g) have a high RMR at low Ta, and a fall of Tset results in a large reduction of MR from RMR to BMR (Figure 3). The substantial reduction of MR, together with the large surface area of small heterotherms, results in high cooling rates (100), and the fast fall of Tb in turn affects MR. In contrast, large heterotherms (5000 g) have a low Tlc of the TNZ and only a small increase of RMR over BMR at low Ta (Figure 3). Consequently, a fall of
22 Dec 2003
15:31
AR
AR205-PH66-10.tex
AR205-PH66-10.sgm
LaTeX2e(2002/01/18)
METABOLIC RATES DURING TORPOR
P1: IBC
251
Figure 2 Metabolic rates measured as oxygen consumption of a dunnart (Sminthopsis macroura). Similar to that found for the glider in Figure 1, the initial fall of the metabolic rate is associated with only a small change of body temperature. Only when the metabolic rate falls below BMR does the simultaneous decline of metabolic rate and body temperature become obvious.
Tset and the small reduction from RMR to BMR and their low surface-to-volume ratio will result in a slow cooling rate. Even larger species, such as bears, are under thermoneutral conditions even at Ta near 0◦ C (137), and a fall of Tset should have no effect on MR. Thus physiological mechanisms employed for MR reduction during torpor entry must differ between small and large heterotherms.
TMR AND Tb IN THERMO-CONFORMING TORPID HETEROTHERMIC ENDOTHERMS Small Heterotherms As discussed above, small heterotherms have high RMR at low Ta and a high BMR. A reduction of Tset results in a precipitous drop of MR to near BMR (141) and, because not enough heat is produced for normothermic thermoregulation, Tb will follow, which in turn affects MR. Nevertheless, the reduction of MR below BMR appears to differ between small daily heterotherms and hibernators. The main energy supply of daily heterotherms, even during the period when torpor is commonly used, remains food collected during usually daily foraging. Thus energetics differ from hibernators, which heavily rely on fat. Small daily heterotherms (body mass ∼2 to 70 g) have high BMRs, and the effects of a reduction
22 Dec 2003
15:31
252
AR
AR205-PH66-10.tex
AR205-PH66-10.sgm
LaTeX2e(2002/01/18)
P1: IBC
GEISER
Figure 3 Resting metabolic rate within thermoneutrality (BMR) and below thermoneutrality (RMR) of a 10-g and a 5000-g endotherm. Note the wide TNZ and the small increase from BMR to RMR at low ambient temperatures in the large species and the narrow TNZ and the large increase of RMR over BMR at low ambient temperatures in the small species. This difference will strongly affect metabolic rate reduction at torpor onset.
of Tb by about 20◦ C, as commonly observed in daily heterotherms, results in a maximum reduction of TMR to about 25% of BMR assuming a Q10 of 2. This TMR may seem rather high, however because torpor in daily heterotherms is relatively shallow and brief and is usually interrupted by daily foraging, a small reduction of MR relying largely on temperature effects without major biochemical adjustments appears to be a sensible approach. Not surprisingly then, the reduction of MR in a daily heterotherm, the marsupial Sminthopsis macroura (Figure 4), follows closely that predicted by temperature effects (Q10 = 2.5) similar to that for many other small daily heterotherms and the minimum TMR is about 25% of BMR in many species (Table 1). Perhaps more importantly, the extrapolation of TMR as a function of Tb intercepts with BMR at the normothermic Tb of 35◦ C in this species. This apparent continuum between normothermia in the TNZ (BMR) and TMR as a function of Tb, which also occurs during passive rewarming (53), provides further
22 Dec 2003
15:31
AR
AR205-PH66-10.tex
AR205-PH66-10.sgm
LaTeX2e(2002/01/18)
METABOLIC RATES DURING TORPOR
P1: IBC
253
Figure 4 Metabolic rates measured as oxygen consumption of a torpid thermoconforming small daily heterotherm, the dunnart (Sminthopsis macroura), as a function of body temperature. Note the intercept of the extrapolation of TMR with BMR at the normothermic body temperature of 35◦ C (data from 140).
evidence that the MR reduction below BMR in small daily heterotherms is largely determined by Tb. Small hibernators undergo prolonged periods of torpor and can survive on stored fat for months. If small hibernators exhibited the same MR reduction as that of small daily heterotherms, their fuel stores would be depleted within days or weeks, well before the end of winter. Thus it is not surprising that the reduction of TMR below BMR in small hibernators (∼5 to ∼100 g) is much more pronounced than in daily heterotherms and that the relationship between Tb and TMR of the two groups differs. In the insectivorous bat, Nyctophilus geoffroyi, which is capable of prolonged torpor bouts of up to two weeks, the decline of TMR with Tb (Figure 5) is much more pronounced than in S. macroura (Figure 4), and the Q10 value for TMR of 3.0 is higher than expected for temperature effects alone. Moreover, in contrast to S. macroura (Figure 4), the extrapolation of TMR of N. geoffroyi does not intercept with BMR at the normothermic Tb of 35◦ C, but about 40% below
22 Dec 2003
15:31
254
AR
AR205-PH66-10.tex
AR205-PH66-10.sgm
LaTeX2e(2002/01/18)
P1: IBC
GEISER
Figure 5 Metabolic rates measured as oxygen consumption of torpid thermoconforming small hibernator, the bat (Nyctophilus geoffroyi), as a function of body temperature. Note the intercept with the normothermic body temperature of 35◦ C of the extrapolation of TMR is 40% below the BMR (data from 51).
BMR (Figure 5). Thus there is a clear break between BMR and TMR at high Tbs, suggesting that mechanisms other than temperature effects must be involved. Further evidence for largely temperature-independent metabolic inhibition comes from the marsupial hibernator, Cercartetus nanus, which can enter torpor within the TNZ and is able to reduce TMR to about 50% of BMR with a Tb reduction of only 2.9◦ C (Q10 = 9.7; Table 1). The minimum TMR of these small hibernators is only a fraction of that in the daily heterotherms. These observations suggest that during torpor entry, and at most Tb in steady-state torpor, small hibernators employ temperature-independent metabolic inhibition in addition to the effects of the greatly reduced Tb for MR reduction. When the TMR as a function of Tb of thermo-conforming individuals below the BMR in a small daily heterotherm (S. macroura, 25 g) is compared with that of a small hibernator (C. nanus, 35 g), the TMR at the same Tb in the daily heterotherm
22 Dec 2003
15:31
AR
AR205-PH66-10.tex
AR205-PH66-10.sgm
LaTeX2e(2002/01/18)
METABOLIC RATES DURING TORPOR
P1: IBC
255
Figure 6 Metabolic rates measured as oxygen consumption of a torpid thermoconforming small daily heterotherm, the dunnart (Sminthopsis macroura), compared with that of a small hibernator, the pygmy-possum (Cercartetus nanus), as a function of body temperature. Note that at the same body temperature the metabolic rate of the hibernator is about half of that of the daily heterotherm. The minimum metabolic rate of the daily heterotherm is about seven times that of the hibernator because of the further decline of body temperature in the latter (data from 140, 142).
is about twice that of the hibernator (Figure 6), which emphasizes the influence of metabolic inhibition in the hibernator. The minimum TMR in S. macroura is about sevenfold that of C. nanus because of the greater than 10◦ C lower minimum Tb in C. nanus (Figure 6), which emphasizes the additional effect of Tb. Log TMR is linearly related to Tb in both species, but the elevation of the regressions differs significantly (p < 0.0001, ANCOVA). The difference in TMR at the same Tb is not the result of differences in torpor duration because TMR minima in both species are reached about 3–4 hours after torpor onset. The differences in TMR at the same Tb suggest that the mechanisms of MR reduction differ between small daily heterotherms and hibernators.
22 Dec 2003
15:31
256
AR
AR205-PH66-10.tex
AR205-PH66-10.sgm
LaTeX2e(2002/01/18)
P1: IBC
GEISER
Medium-Sized Heterotherms Medium-sized heterotherms are capable of carrying more fat and have substantially lower RMR and BMR than small species. Consequently, energy constraints should be less extreme than for small species. Information on MR reduction during torpor in medium-sized daily heterotherms is limited to three marsupials and a bird (body mass ∼110 to 200 g). Nevertheless, existing data suggest that TMR below the BMR in heterothermic marsupials falls as predicted by the reduction of MR via falling Tb through Q10 effects. In the four species examined, Q10 ranged between 1.6 and 2.8, suggesting that Tb plays a major role in the MR reduction below BMR (Table 1). Similar observations have been made in medium-sized hibernators. In goldenmantled ground squirrels, Spermophilus lateralis (200 g), the Q10 for TMR between different Tb during torpor was 2.39 (62) and 2.3 between BMR and TMR (138). Similarly, in Spermophilus saturatus (250 g), the log TMR was a function of Tb and the Q10 calculated for the slope was 2.04. However, these measured Q10 values are restricted to low Tb during torpor (3 at mainly high Tb in other medium-sized hibernators (Table 1) support this interpretation. Interestingly, at a Tb of 18.3◦ C, even the TMR of the fat-tailed lemur, Cheirogaleus medius (250 g), a tropical primate that hibernates at unusually high Tb (18), falls very close to that predicted for S. saturatus at the same Tb, suggesting that there are no general differences between tropical and temperate hibernators. Thus low Q10 values observed in medium-sized hibernators appear to be restricted to low Tb during torpor, whereas at high Tb, Q10 values are greater than predicted. This suggests that, unlike in small hibernators, metabolic inhibition in medium-sized hibernators predominately is used to minimize TMR at high Tb and torpor entry, whereas at low Tb these animals largely rely on Tb for TMR reduction.
Large Heterotherms Whereas small heterotherms have to overcome the problem of having high normothermic MR and low fat stores, large heterotherms (body mass >1000 g) have to deal with a small relative surface area and only a small reduction of MR from RMR to BMR during torpor entry (Figure 3). Cooling rates consequently will be slow, and a reliance on Tb for reduction in MR will be ineffective, at least in the initial phase of torpor. American badgers, Taxidea taxus (∼9000 g), are the only large daily heterotherms for which metabolic data during torpor are available. Their MRs fell with Tb with a Q10 value of 2.15 over ∼10 h torpor entry (64). This suggests that despite their large size, these animals rely mainly on temperature effects for a 57% MR reduction.
22 Dec 2003
15:31
AR
AR205-PH66-10.tex
AR205-PH66-10.sgm
LaTeX2e(2002/01/18)
METABOLIC RATES DURING TORPOR
P1: IBC
257
Figure 7 Metabolic rates measured as oxygen consumption of torpid thermoconforming medium-sized hibernator, the ground squirrel (Spermophilus saturatus, Ss), as a function of body temperature. Note the intercept with the normothermic body temperature of 38◦ C of the extrapolation of TMR is 25% below the BMR. The minimum metabolism of the medium-sized tropical hibernator the lemur (Cheirogaleus medius, Cm) is similar to that predicted for the temperature of the ground squirrel at the Tb measured for the lemur (data from 18, 46).
Because of the small surface area and the negligible differential between TMR and BMR, large hibernators appear to employ metabolic inhibition at torpor onset, to permit cooling of the body. Echidnas, Tachyglossus aculeatus (body mass ∼2000 g), exhibit high Q10 values of 6.7 between Tb and TMR during torpor entry (127), supporting this interpretation. Arctic ground squirrels, Spermophilus parryii (1000 g), have a constant and low TMR over a Tb range of ∼5 to 13◦ C, suggesting that at least at the higher Tb, metabolic inhibition is involved in reducing TMR (13). Alpine marmots, Marmota marmota (body mass ∼4000 g), appear to use metabolic inhibition during torpor entry and maintain TMR at very low levels for several hours while the Tb declines, but TMR increases somewhat later in the torpor bout (129). The likely reason why TMR returns to higher values after torpor entry is that the very low initial MR does not suffice for prolonged function.
22 Dec 2003
15:31
258
AR
AR205-PH66-10.tex
AR205-PH66-10.sgm
LaTeX2e(2002/01/18)
P1: IBC
GEISER
Nevertheless, large thermal gradients may partially explain the observed patterns because the measured core Tb does not reflect peripheral temperatures during cooling. Thus, while the function of metabolic inhibition in small hibernators appears to minimize energy expenditure at all Tb to overcome the energetic constraints of small amounts of stored fat, in large hibernators this mechanism is important to allow the initial reduction of Tb that, in turn, will influence TMR to some extent. The situation in bears is even more extreme. Because bears are under thermoneutral conditions even at very low Ta, they cannot rely on cooling through a reduction in Tset. Consequently, they appear to down-regulate MR to about 20% of BMR resulting in a decline of Tb of about 5◦ C. The Q10 = 27 for bears is very high, but this value may be inflated because the predicted BMR by Watts et al. (156) is substantially above that predicted by allometric equations for hibernators derived here, which would result in a Q10 of 7.2 (Figure 8B).
Tb AND THE ALLOMETRY OF STEADY-STATE BMR AND TMR OF THERMO-CONFORMING TORPID ANIMALS As we have seen in the previous section, the fall of MR at torpor entry and consequently the fall of Tb depend on size. But even during steady-state torpor, TMR is affected by size. Small heterotherms have relatively high BMR and small fat stores, whereas large species have low BMR and relatively large energy stores. Consequently, mechanisms of MR reduction should be reflected in allometric relationships between mass and BMR and mass and TMR at different Tbs (Figure 8). Because of the large number of birds included in the daily heterotherms, which generally have higher BMR than mammals (21), the BMR intercept differed between daily heterotherms and hibernators (p = 0.043, ANCOVA). When birds −−−−−−−−−−−−−−−−−−−−−−−−−−−−−−−−−−−−−−−−−−−−−−−−−−−−−−−−−→ Figure 8 Metabolic rate as a function of body mass for daily heterotherms (A) and hibernators (B). BMR (filled circles) and the TMR of animals with minimum Tb between 25–33◦ C (unfilled squares), 15–25◦ C (filled triangles), 10–15◦ C (unfilled triangles) and 0–10◦ C (unfilled circles) are shown. The equations for daily heterotherms (A) were log10 BMR = 0.678 – 0.381 log10 mass, r2 = 0.75, P < 0.001; log10 TMR (at Tb 25–33◦ C) = 0.320 – 0.347 log10 mass, r2 = 0.72, P < 0.001; log10 TMR (at Tb 15–25◦ C) = −0.037 – 0.328 log10 mass, r2 = 0.28, P < 0.001; log10 TMR (at Tb 10–15◦ C) = 0.070 – 0.535 log10 mass, r2 = 0.72, P = 0.034. The equations for hibernators (B) were log10 BMR = 0.519 −0.299 log10 mass, r2 = 0.77, P < 0.001; log10 TMR (at Tb 25–33◦ C) = −0.270 −0.214 log10 mass, r2 = 0.78, P = 0.001; log10 TMR (at Tb 15–25◦ C) = −0.573 −0.304 log10 mass, r2 = 0.49, P < 0.001; log10 TMR (at Tb 10–15◦ C) = −0.963 −0.177 log10 mass, r2 = 0.24, P = 0.091; log10 TMR (at Tb 0–10◦ C) = −1.229 −0.128 log10 mass, r2 = 0.22, P = 0.002.
22 Dec 2003
15:31
AR
AR205-PH66-10.tex
AR205-PH66-10.sgm
LaTeX2e(2002/01/18)
METABOLIC RATES DURING TORPOR
P1: IBC
259
22 Dec 2003
15:31
260
AR
AR205-PH66-10.tex
AR205-PH66-10.sgm
LaTeX2e(2002/01/18)
P1: IBC
GEISER
were excluded, the BMR was indistinguishable between daily heterotherms and hibernators (p = 0.49, ANCOVA). The normothermic Tb at BMR was similar (p = 0.086, t-test) between daily heterotherms (Tb = 36.8 ± 2.2◦ C) and hibernators (Tb = 36.2 ± 1.5◦ C), even with both birds and mammals included. In daily heterotherms, the regression lines for TMR as a function of body mass declined in parallel with Tbs at all Tb examined (Figure 8A), and the slopes were indistinguishable among the Tb groups (p > 0.4, ANCOVA). However, the elevation differed between BMR and TMR at Tb 25–33◦ C, and also between TMR at Tb 25–33◦ C and TMR at Tb 15–25◦ C (p < 0.001, ANCOVA). TMRs at Tb 15– 25◦ C and Tb 10–15◦ C was indistinguishable (p > 0.3, ANCOVA) likely because of the low sample size (n = 6) for the latter. TMR as a function of mass of avian daily heterotherms did not differ from mammalian daily heterotherms at most Tbs examined (p > 0.1, ANCOVA). However, at Tb 10–15◦ C, the two groups differed in slope (p < 0.003), but again this probably reflects the low sample size (n = 3, in each case ) rather than a biological difference. Hibernators also reduce MR as a function of mass from BMR to TMR in parallel from normothermic Tb down to Tb 15–25◦ C (Figure 8B). The slope of the regression for BMR was indistinguishable from TMR at Tb 25–33◦ C, Tb 15–25◦ C, and Tb 10–15◦ C. However, at Tbs lower than 10◦ C, the slope for the regression of TMR versus mass changed significantly (p < 0.024, ANCOVA). Above Tb 15◦ C, the slopes for TMR versus body mass ranged from −0.214 to −0.304; below Tb 10◦ C, the slope was about half (−0.128) because in this Tb range the reduction of TMR relative to BMR in the small species is more pronounced than in the large species. When TMRs based on the Tb bins of daily heterotherms (Figure 8A) and hibernators (Figure 8B) were compared, all differed significantly in elevation (p < 0.0001, ANCOVA) at the three Tb ranges that could be compared (Tb 25–33◦ C, 15–25◦ C, 10–15◦ C); the slopes were indistinguishable. These differences in elevation were not due to differences in Tb because mean Tbs in all Tb bins were indistinguishable (t-test; mean Tbs at Tb 25–33◦ C: 27.3 ± 1.6◦ C versus 27.3 ± 2.4◦ C; at Tb 15–25◦ C: 19.1 ± 3.0◦ C versus 17.8 ± 2.6◦ C; at Tb 10–15◦ C: 12.5 ± 1.5◦ C versus 11.1 ± 1.3◦ C; daily heterotherms versus hibernators, respectively).
Q10 BETWEEN BMR AND TMR The relationship between TMR and body mass is reflected in the Q10 values. As the TMR in daily heterotherms was relatively high, the Q10 between BMR and TMR at various Tbs during torpor ranged between ∼1.5 and 3.5, with a maximum of 4.7 in the 2-g pygmy shrew (Suncus etruscus) (Figure 9A). Most Q10 values were between 1.5 and 2.5 (average 2.3 ± 0.6, n = 49) and close to those typical for biochemical reactions. The Q10 values were not related to body mass at Tb 25–33◦ C and Tb 10–15◦ C; however, there was a weak correlation (r2 = 0.09) at Tb
22 Dec 2003
15:31
AR
AR205-PH66-10.tex
AR205-PH66-10.sgm
LaTeX2e(2002/01/18)
METABOLIC RATES DURING TORPOR
P1: IBC
261
15–25◦ C. Generally, the Q10 values of daily heterotherms (Figure 9A) were well below those for hibernators (Figure 9B). Hibernators at high Tb during torpor (Tb 25–33◦ C) have high Q10 values of >3 to 27 (Figure 9B) (as stated above, the value for the bear is likely to be on overestimate because of the high BMR). Whereas most of these high Q10s are restricted to small species, with the exception of the bear, they are also likely to occur in other medium-sized and large hibernators, but there are no data currently available in this Tb range. At Tb 25–33◦ C, the Q10 shows a significant positive correlation with body mass (r2 = 0.49) because of the bear. At intermediate Tb (Tb 15–25◦ C and Tb 10–15◦ C), Q10 and mass were not related despite a substantial data set. However, at all body masses, the Q10 values in this temperature range were generally high, with most values between 3 and 6. Only at low Tb 0–10◦ C was Q10 negatively related to body mass (r2 = 0.28), reflecting a greater reduction of steady-state TMR in the small species compared with that of the large species at low Tb. The Q10 in most small species (3, whereas in large hibernators (>1000 g) Q10 was around 2–2.5. Thus although the normal Q10 between BMR and TMR at low Tb in the large hibernators suggests that these animals generally rely on temperature effects for MR reduction (38), they do in fact rely heavily on metabolic inhibition. The normal Q10 merely reflects an average of the high Q10 values at high Tb during torpor and the low Q10 at low Tb. The overall mean Q10 for hibernators was 3.9 ± 3.7 (n = 43).
TMR AND THE Tb-Ta DIFFERENTIAL In the Ta range where torpid heterotherms are thermo-conforming, the Tb-Ta differential is often constant or changes little, although TMR declines significantly (13, 51, 74, 79, 142, 159). These observations indicate that the Tb-Ta differential does not determine TMR above the Tset as has been suggested (68). The constant Tb-Ta differential, despite a declining TMR over the same Ta range, may appear surprising because at constant thermal conductance (C) the Tb-Ta differential and MR should fall together. However, it appears that C is not constant and changes from high values at high Tb to low values at low Tb, which explains the more or less constant Tb-Ta differential despite the change of TMR (142). The lack of a functional link between the Tb-Ta differential of thermoconforming torpid individuals and TMR also can be demonstrated by exposing torpid individuals to a decline or rise of Ta. During passive rewarming, the Tb-Ta differential often becomes very small or temporarily negative (18, 102, 136), but despite the decline in the Tb-Ta differential, the TMR increases with the rise of Tb. When the Tb-Ta differential of torpid thermo-conforming individuals is experimentally increased by a reduction of Ta, TMR does not increase, despite a rise in the Tb-Ta differential, but declines, following the decline of Tb (44). Similarly, thermal manipulations of the hypothalamus at Tb above the Tset, which amounts to the same as change in the Tb-Ta differential, do not elicit any increase of TMR (72).
22 Dec 2003
15:31
262
AR
GEISER
AR205-PH66-10.tex
AR205-PH66-10.sgm
LaTeX2e(2002/01/18)
P1: IBC
22 Dec 2003
15:31
AR
AR205-PH66-10.tex
AR205-PH66-10.sgm
LaTeX2e(2002/01/18)
METABOLIC RATES DURING TORPOR
P1: IBC
263
In contrast to thermo-conforming torpid individuals, in which the Tb-Ta differential appears inconsequential for determining TMR, thermo-regulating torpid individuals below the Tset for Tb maintain TMR according to the Tb-Ta differential, albeit at a lower Tb. An increase of TMR in thermo-regulating torpid individuals similar to the response of the RMR has long been recognized (61). Obviously, regulation of Tb, even during torpor, will result in a proportional heat loss as occurs during normothermia, which must be compensated for by an increase in heat production. Whereas the Tb-Ta differential determines TMR in thermo-regulating torpid individuals, it has been suggested that the slope of TMR versus Ta during torpor may be shallower than that for RMR versus Ta during normothermia, perhaps because of a decrease in C at low Tb (74, 143). Although this interpretation may appear plausible, it is not supported by the empirical evidence from most species. The slope and elevation for RMR versus Ta during normothermia and that of TMR versus Ta in thermo-regulating individuals at body mass 200 g are included (n = 3), the slope differs significantly between normothermic and torpid thermoregulating individuals (Figure 10) suggesting that large species can reduce heat loss when thermo-regulating during torpor.
APPARENT THERMAL CONDUCTANCE AND TMR Snyder & Nestler (139) argued that Q10 effects are confounded by changes in thermal conductance and consequently that Q10 calculations in endotherms are unsound. They found, that C is lower during torpor than during normothermia in rodents and proposed that the reduction in C is a central part of torpor, as it allows endotherms to markedly reduce levels of metabolism without abandoning regulation of Tb (139). However, this argument has several problems. First, as shown above, thermal conductance during torpor in most species is lower only ←−−−−−−−−−−−−−−−−−−−−−−−−−−−−−−−−−−−−−−−−−−−−−−−−−−−−−−−−− Figure 9 The Q10 between BMR and TMR as a function of body mass for daily heterotherms (A) and hibernators (B). Q10s were calculated between BMR and TMR of animals with minimum Tb between 25–33◦ C (unfilled squares), 15–25◦ C (filled triangles), 10–15◦ C (unfilled triangles), and 0–10◦ C (unfilled circles). The equation for daily heterotherms (A) was log10 Q10 = 0.453 – 0.078 log10 mass, r2 = 0.09, P = 0.046 (Tb 15–25◦ C). Insignificant correlations are shown as broken lines for better identification of points. The equations for hibernators (B) were log10 Q10 = 0.577 – 0.057 log10 mass, r2 = 0.28, P = 0.001 (Tb 0–10◦ C); log10 Q10 = 0.560 + 0.149 log10 mass, r2 = 0.49, P = 0.024 (Tb 25–33◦ C). Insignificant correlations are shown as broken lines for better identification of points.
22 Dec 2003
15:31
264
AR
AR205-PH66-10.tex
AR205-PH66-10.sgm
LaTeX2e(2002/01/18)
P1: IBC
GEISER
Figure 10 Conductance as a function of body mass for normothermic animals (filled circles, N), thermo-regulating torpid animals (unfilled circles, TR) and thermo-conforming torpid animals (filled triangles, TC-D daily heterotherms, TC-H hibernators). The equations were log10 C log10 C r2 log10 C r2 log10 C r2
= = = = = = =
−0.032 − 0.539 log10 mass, r2 = 0.966, P < 0.001 (normothermia); 0.0992 − 0.656 log10 mass, 0.943, P < 0.001 (thermo-regulating torpor); −0.185 − 0.565 log10 mass, 0.874, P < 0.01 (thermo-conforming torpor, daily heterotherms); −0.860 − 0.402 log10 mass, 0.915, P < 0.01 (thermo-conforming torpor, hibernators).
when torpid animals are thermo-conforming and apparently do not regulate Tb (Table 2; Figure 9). Second, the reduction of C from RMR to TMR is small compared with the large difference in metabolism. Third, if C were important in determining MR of thermo-conforming torpid individuals, a change of C by exposure to 21% oxygen in helium, which is a more conductive atmosphere than air, should result in an increase in MR, which it does not (54). Fourth, the thermal conductance of most thermo-regulating animals is the same during torpor and normothermia (142; Figure 10), but the TMR even in thermo-regulating individuals is only a fraction of that during normothermia. Thus, as explained by Nicol et al. (127), C cannot be the reason for the low MR, but rather it is a consequence of
22 Dec 2003
15:31
AR
AR205-PH66-10.tex
AR205-PH66-10.sgm
LaTeX2e(2002/01/18)
METABOLIC RATES DURING TORPOR
P1: IBC
265
the low TMR and peripheral vasoconstriction in thermo-conforming individuals. Nevertheless, C may play a role in reducing Tb and, consequently, TMR at high Ta or during torpor entry.
ARE Q10 CALCULATIONS MEANINGFUL IN ENDOTHERMS? As is true for all other physiological measurements, common sense must be applied to the calculation of Q10 (155). This is especially important in heterothermic endotherms that exhibit pronounced changes in their physiological state. If meaningful calculations for Q10 are to be made, changes of MR that change with Tb and are based on equivalent performance at different Tbs appear most appropriate (155). Thus in the present comparison, Q10 was calculated between BMR and TMR in thermo-conforming individuals because both states do not include a thermo-regulatory energetic component and reflect maintenance metabolism only at different Tbs. Calculations of Q10 between TMR at different Tbs during torpor in thermo-conforming individuals also are appropriate, as may be comparisons between thermo-regulating individuals at the same Ta but at different Tbs because they represent equivalent performance (142). In contrast, comparisons of thermo-regulating individuals with thermoconforming individuals (139) are not likely to provide a meaningful Q10, because a change of state rather than the effect of temperature on rates is examined. Similarly, calculations of Q10 during torpor entry can be meaningless if they fail to consider that the initial decline of MR is not related to a reduction of Tb, but to a reduction of Tset (see Figures 1 and 2). Another approach that has been applied to resolve whether Tb is a possible reason for the decline of MR has been to compare the percent change of MR with the percent change of Tb during torpor entry (69). This approach is flawed for two reasons. First, as is outlined above, the initial change of MR during torpor entry can occur without a change of Tb because MR falls from RMR to approximately BMR, and it is therefore not surprising that MR falls faster than Tb. Second, as TMR in thermo-conforming individuals is an exponential function of Tb (38, 140, 142, 159), a comparison of a percent change to assess whether Tb and TMR are related is not likely to provide meaningful information.
BIOCHEMICAL MECHANISMS If MR reduction in many heterothermic species involves metabolic inhibition, the question arises as to the underlying biochemical mechanisms. However, considering the enormous reduction in MR that occurs especially during hibernation, in vitro data provide less clear and often contradictory results. A potential inhibitor for MR during torpor may be a reduced pH, which may lower metabolic processes (63, 109, 110, 116). In S. lateralis, the respiratory quotient (RQ) falls during entry into hibernation and rises during arousal (138), suggesting that storage of CO2 could result in a decrease of pH. This observation differs from data on the daily heterotherm, P. sungorus, which increases RQ
22 Dec 2003
15:31
266
AR
AR205-PH66-10.tex
AR205-PH66-10.sgm
LaTeX2e(2002/01/18)
P1: IBC
GEISER
during torpor entry and decreases RQ before arousal (70), suggesting that not all heterotherms store CO2 during torpor entry. Changes in enzyme activities at different states during torpor are other potential candidates for involvement in MR reduction. However, such measurements are often limited to a single room temperature that is representative for neither high normothermic Tb nor low torpid Tb. No major changes in enzyme activity were observed in P. sungorus during daily torpor with the exception of pyruvate dehydrogenase (70), but because this species appears to rely largely on Tb for MR reduction, this result is not surprising. In hibernating Zapus hudsonicus, several glycolytic enzymes had reduced activity by about 50%, which is similar to that observed during metabolic inhibition in some species at the whole animal level without the effect of Tb, and this change may be controlled by reversible phosphorylation (145). Similarly, mitochondrial respiration is reduced to about half during torpor in Spermophilus compared with that in normothermic individuals (2, 112). Furthermore, transcriptional initiation during torpor in S. lateralis is substantially reduced compared with that of interbout normothermia (151). Although these are promising findings, it is clear that further in vitro work is required to fully explain what happens in vivo. Whereas Arrhenius plots of enzyme function have received considerable attention with respect to heterothermy in the past (42, 134), little recent progress has been made in this area, despite the observed increase in the Q10 in torpid individuals compared with that in normothermic individuals. Perhaps more emphasis on in vitro work considering cellular functions over the Tb ranges that are observed in vivo may help resolve some of the questions.
CONCLUSIONS The above analysis suggests that mechanisms of metabolic rate reduction differ between daily heterotherms and hibernators and between small and large heterotherms. It shows that, against expectations, most of the apparently contradictive hypotheses proposed to explain metabolic rate reduction are correct. However, not all hypotheses match the published data for all species at all stages of torpor. Thus the present paper supports the view that extrapolations from one species to to another can be erroneous and underscores the strength of a comparative approach.
ACKNOWLEDGMENTS I thank Mark Brigham and Gerhard K¨ortner for critical comments on the manuscript, Loren Buck for data on arctic ground squirrels, and Rebecca Drury for help with assembling the manuscript. The Australian Research Council supported the work.
22 Dec 2003
15:31
AR
AR205-PH66-10.tex
AR205-PH66-10.sgm
LaTeX2e(2002/01/18)
METABOLIC RATES DURING TORPOR
P1: IBC
267
The Annual Review of Physiology is online at http://physiol.annualreviews.org
LITERATURE CITED 1. Augee ML, Ealey EHM. 1968. Torpor in the echidna, Tachyglossus aculeatus. J. Mammal. 49:446–54 2. Barger JL, Brand MD, Barnes BM, Boyer BB. 2003. Tissue-specific depression of mitochondrial proton leak and substrate oxidation in hibernating arctic ground squirrels. Am. J. Physiol. Regul. Integr. Comp. Physiol. 284:R1306–13 3. Barnes BM. 1989. Freeze avoidance in a mammal: body temperatures below 0◦ C in an Arctic hibernator. Science 244:1593– 95 4. Barnes BM, Toien O, Edgar DM, Grahn D, Heller C. 2000. Comparison of the hibernation phenotype in ground squirrels and bears. Life in the Cold. Eleventh Int. Hibernation Symp. p. 11 (Abstr.) 5. Bartels W, Law BS, Geiser F. 1998. Daily torpor and energetics in a tropical mammal, the northern blossom-bat Macroglossus minimus (Megachiroptera). J. Comp. Physiol. B 168:233–39 6. Bartholomew GA, Hudson JW. 1960. Aestivation in the Mohave ground squirrel, Citellus mohavensis. Bull. Mus. Comp. Zool. 124:193–208 7. Bartholomew GA, Dawson WR, Lasiewski RC. 1970. Thermoregulation and heterothermy in some of the smaller flying foxes (Megachiroptera) of New Guinea. Z. Vergl. Physiol. 70:196– 209 8. Bickler PE. 1984. CO2 balance of a heterothermic rodent: comparison of sleep, torpor, and awake states. Am. J. Physiol. Regul. Integr. Comp. Physiol. 246:R49– 55 9. Boyer BB, Barnes BM. 1999. Molecular and metabolic aspects of mammalian hibernation. Bioscience 49:713–24 10. Brigham RM, K¨ortner G, Maddocks TA, Geiser F. 2000. Seasonal use of torpor by free-ranging Australian owlet-nightjars
11.
12.
13.
14.
15.
16.
17.
18.
(Aegotheles cristatus). Physiol. Biochem. Zool. 73:613–20 Bucher TL, Chappell MA. 1992. Ventilatory and metabolic dynamics during entry into and arousal from torpor in Selasphorus hummingbirds. Physiol. Zool. 65:978–93 Bucher TL, Chappell MA. 1997. Respiratory exchange and ventilation during nocturnal torpor in hummingbirds. Physiol. Zool. 70:45–52 Buck CL, Barnes BM. 2000. Effects of ambient temperature on metabolic rate, respiratory quotient, and torpor in an arctic hibernator. Am. J. Physiol. Regul. Integr. Comp. Physiol. 279:R255– 62 Buffenstein R. 1985. The effect of starvation, food restriction, and water deprivation on thermoregulation and average daily metabolic rates in Gerbillus pusillus. Physiol. Zool. 58:320–28 Carpenter FL, Hixon MA. 1988. A new function of torpor: fat conservation in a wild migrant hummingbird. Condor 90:373–78 Coburn DK, Geiser F. 1998. Seasonal changes in energetics and torpor patterns in the sub-tropical blossom-bat Syconycteris australis (Megachiroptera). Oecologia 113:467–73 Cranford JA. 1983. Body temperature, heart rate and oxygen consumption of normothermic and heterothermic western jumping mice (Zapus princeps). Comp. Biochem. Physiol. 74A:595–99 Dausmann KH, Ganzhorn JU, Heldmaier G. 2000. Body temperature and metabolic rate of a hibernating primate in Madagascar: preliminary results from a field study. In Life in the Cold. Eleventh Int. Hibernation Symp., ed. G. Heldmaier, M. Klingenspor, pp. 41–47. Berlin/Heidelberg/New York: Springer
22 Dec 2003
15:31
268
AR
AR205-PH66-10.tex
AR205-PH66-10.sgm
LaTeX2e(2002/01/18)
P1: IBC
GEISER
19. Dawson TJ. 1983. Monotremes and Marsupials: the Other Mammals. London: Edward Arnold 20. Dawson WR, Fisher CD. 1969. Responses to temperature by the spotted nightjar (Eurostopodus guttatus). Condor 71:49– 53 21. Dawson WR, Hudson JW. 1970. Birds. In Comparative Physiology of Thermoregulation, ed. GC Whittow, pp. 223–310. New York: Academic 22. Deavers DR, Hudson JW. 1981. Temperature regulation in two rodents (Clethrionomys gapperi and Peromyscus leucopus) and a shrew (Blarina brevicaudata) inhabiting the same environment. Physiol. Zool. 54:94–108 23. Ellison GTH. 1995. Thermoregulatory responses of cold-acclimated fat mice (Steatomys pratensis). J. Mammal. 76: 240–47 24. Ellison GTH, Skinner JD. 1992. The influence of ambient temperature on spontaneous daily torpor in pouched mice (Saccostomus campestris: Rodentia Cricetidae) from southern Africa. J. Therm. Biol. 17:25–31 25. Erickson H. 1956. Observations on the metabolism of arctic ground squirrels (Citellus parryii) at different environmental temperatures. Acta Physiol. Scand. 36:66–74 26. Fietz J, Tataruch F, Dausmann KH, Ganzhorn JU. 2003. White adipose tissue composition in the free-ranging fattailed dwarf lemur (Cheirogaleus medius; Primates), a tropical hibernator. J. Comp. Physiol. B 173:1–10 27. Fleming MR. 1980. Thermoregulation and torpor in the sugar glider, Petaurus breviceps (Marsupialia: Petauridae). Aust. J. Zool. 28:521–34 28. Fleming MR. 1985a. The thermal physiology of the feathertail glider, Acrobates pygmaeus (Marsupialia: Burramyidae). Aust. J. Zool. 33:667– 81 29. Fleming MR. 1985b. The thermal physiol-
30.
31.
32.
33.
34.
35.
36.
37.
38.
39.
ogy of the mountain pygmy-possum Burramys parvus (Marsupialia: Burramyidae). Aust. Mammal. 8:79–90 Florant GL, Heller HC. 1977. CNS regulation of body temperature in euthermic and hibernating marmots (Marmota flaviventris). Am. J. Physiol. Regul. Integr. Comp. Physiol. 232:R203–8 Fons R, Sicard R. 1976. Contribution a´ la conaissance du m´etabolisme e´ nerg´etique chez deuz crocidurinae: Suncus etruscus (Savi, 1882) et Crocidura russula (Hermann, 1780) (Insectivora, Soricidae). Mammalia 40:299–311 French AR. 1985. Allometries of the duration of torpid and euthermic intervals during mammalian hibernation: a test of the theory of metabolic control of the timing of changes in body temperature. J. Comp. Physiol. B 156:13–19 Frey H. 1979. La temp´erature corporelle de Suncus etrucus (Sorcidae, Insectivora) au cours de l’activit´e, du respos normothermique et du la torpeur. Revue Suisse Zool. 86:653–62 Frey H. 1980. Le m´etabolisme e´ nerg´etique de Suncus etrucus (Sorcidae, Insectivora) en torpeur. Revue Suisse Zool. 87:739–48 Geiser F. 1985. Tagesschlaflethargie bei der gelbf¨ussigen Breitfussbeutelspitzmaus, Antechinus flavipes (Marsupialia: Dasyuridae). Z. S¨augetierkunde 50:125– 27 Geiser F. 1986. Thermoregulation and torpor in the Kultarr, Antechinomys laniger (Marsupialia: Dasyuridae). J. Comp. Physiol. B 156:751–57 Geiser F. 1987. Hibernation and daily torpor in two pygmy possums (Cercartetus spp., Marsupialia). Physiol. Zool. 60:93– 102 Geiser F. 1988a. Reduction of metabolism during hibernation and daily torpor in mammals and birds: temperature effect or physiological inhibition? J. Comp. Physiol. B 158:25–37 Geiser F. 1988b. Daily torpor and
22 Dec 2003
15:31
AR
AR205-PH66-10.tex
AR205-PH66-10.sgm
LaTeX2e(2002/01/18)
METABOLIC RATES DURING TORPOR
40.
41.
42.
43.
44.
45.
46.
47.
48.
thermoregulation in Antechinus (Marsupialia): influence of body mass, season, development, reproduction, and sex. Oecologia 77:395–99 Geiser F. 1991. The effect of unsaturated and saturated dietary lipids on the pattern of daily torpor and the fatty acid composition of tissues and membranes of the deer mouse Peromyscus maniculatus. J. Comp. Physiol. B 161:590–97 Geiser F. 2003. Thermal biology and energetics of carnivorous marsupials. In Predators with Pouches: the Biology of Carnivorous Marsupials, ed. M Jones, C Dickman, M Archer, pp. 234–49. Melbourne: CSIRO Geiser F, McMurchie EJ. 1984. Differences in the thermotropic behaviour of mitochondrial membrane respiratory enzymes from homeothermic and heterothermic endotherms. J. Comp. Physiol. B 155:125–33 Geiser F, Baudinette RV. 1987. Seasonality of torpor and thermoregulation in three dasyurid marsupials. J. Comp. Physiol. B 157:335–44 Geiser F, Kenagy GJ. 1987. Polyunsaturated lipid diet lengthens torpor and reduces body temperature in a hibernator. Am. J. Physiol. Regul. Integr. Comp. Physiol. 252:R897–901 Geiser F, Baudinette RV. 1988. Daily torpor and thermoregulation in the small dasyurid marsupials Planigale gilesi and Ningaui yvonneae. Aust. J. Zool. 36:473– 81 Geiser F, Kenagy GJ. 1988. Torpor duration in relation to temperature and metabolism in hibernating ground squirrels. Physiol. Zool. 61:442–49 Geiser F, Baudinette RV. 1990. The relationship between body mass and rate of rewarming from hibernation and daily torpor in mammals. J. Exp. Biol. 151:349–59 Geiser F, Broome LS. 1993. The effect of temperature on the pattern of torpor in a marsupial hibernator. J. Comp. Physiol. B 163:133–37
P1: IBC
269
49. Geiser F, Masters P. 1994. Torpor in relation to reproduction in the Mulgara, Dasycercus cristicauda (Dasyuridae: Marsupialia). J. Therm. Biol. 19:33– 40 50. Geiser F, Ruf T. 1995. Hibernation versus daily torpor in mammals and birds: physiological variables and classification of torpor patterns. Physiol. Zool. 68:935– 66 51. Geiser F, Brigham RM. 2000. Torpor, thermal biology, and energetics in Australian long-eared bats (Nyctophilus). J. Comp. Physiol. B 170:153–62 52. Geiser F, Ferguson C. 2001. Intraspecific differences in behaviour and physiology: effects of captive breeding on patterns of torpor in feathertail gliders. J. Comp. Physiol. B 171:569–76 53. Geiser F, Drury RL. 2003. Radiant heat affects thermoregulation and energy expenditure during rewarming from torpor. J. Comp. Physiol. B 173:55–60 54. Geiser F, Song X, K¨ortner G. 1996. The effect of He-O2 exposure on metabolic rate, thermoregulation and thermal conductance during normothermia and daily torpor. J. Comp. Physiol. B 166:190–96 55. Geiser F, K¨ortner G, Schmidt I. 1998. Leptin increases energy expenditure of a marsupial by inhibition of daily torpor. Am. J. Physiol. Regul. Integr. Comp. Physiol. 44:R1627–32 56. Geiser F, Goodship N, Pavey CR. 2002. Was basking important in the evolution of mammalian endothermy? Naturwissenschaften 89:412–14 57. Geiser F, Augee ML, McCarron HCK, Raison JK. 1984. Correlates of torpor in the insectivorous dasyurid marsupial Sminthopsis murina. Aust. Mammal. 7:185–91 58. Geiser F, Holloway JC, K¨ortner G, Maddocks TA, Turbill C, Brigham RM. 2000. Do patterns of torpor differ between free-ranging and captive mammals and birds? In Life in the Cold. Eleventh Int. Hibernation Symp., ed. G Heldmaier,
22 Dec 2003
15:31
270
59.
60.
61.
62.
63.
64.
65.
66.
67.
AR
AR205-PH66-10.tex
AR205-PH66-10.sgm
LaTeX2e(2002/01/18)
P1: IBC
GEISER M Klingenspor, pp. 95–102. Berlin/ Heidelberg/New York: Springer Grigg GC, Beard LA. 2000. Hibernation by echidnas in mild climates: hints about the evolution of endothermy? In Life in the Cold. Eleventh Int. Hibernation Symp., ed. G Heldmaier, M Klingenspor, pp. 5–19. Berlin/Heidelberg/New York: Springer Guppy M, Withers PC. 1999. Metabolic depression in animals: physiological perspectives and biochemical generalizations. Biol. Rev. 74:1–40 Hainsworth FR, Wolf LL. 1970. Regulation of oxygen consumption and body temperature during torpor in a hummingbird, Eulampis jugularis. Science 168:368–69 Hammel HT, Dawson TJ, Adams RM, Anderson HT. 1968. Total calorimetric measurements on Citellus lateralis in hibernation. Physiol. Zool. 41:341–57 Hand SC, Somero GN. 1983. Phosphofructokinase of the hibernator Citellus beecheyi: temperature and pH regulation of activity via influences of the tetramerdimer equilibrium. Physiol. Zool. 56:380– 88 Harlow HJ. 1981. Torpor and other physiological adaptations of the badger (Taxidea taxus) to cold environment. Physiol. Zool. 54:267–75 Hayssen V, Lacy RC. 1985. Basal metabolic rates in mammals: taxonomic differences in the allometry of BMR and body mass. Comp. Biochem. Physiol. 81A:741–54 Hayward JS, Lyman CP. 1967. Nonshivering heat production during arousal and evidence for the contribution of brown fat. In Mammalian Hibernation III, ed. KC Fisher, AR Dawe, CP Lyman, E Sch¨onbaum, FE South, pp. 346–55. Edinburgh: Oliver & Boyd Heldmaier G, Steinlechner S. 1981. Seasonal pattern and energetics of short daily torpor in the Djungarian hamster, Phodopus sungorus. Oecologia 48:265–70
68. Heldmaier G, Ruf T. 1992. Body temperature and metabolic rate during natural hypothermia in endotherms. J. Comp. Physiol. B 162:696–706 69. Heldmaier G, Steiger R, Ruf T. 1993. Suppression of metabolic rate in hibernation. In Life in the Cold, ed. C Carey, GL Florant, BA Wunder, B Horwitz, pp. 545–48. Boulder, CO: Westview 70. Heldmaier G, Klingenspor M, Werneyer M, Lampi BJ, Brooks SPJ, Storey KB. 1999. Metabolic adjustments during daily torpor in the Djungarian hamster. Am. J. Physiol. Endocrinol. Metab. 276:E896– 906 71. Heller HC, Hammel HT. 1972. CNS control of body temperature during hibernation. Comp. Biochem. Physiol. 41A:349– 59 72. Heller HC, Colliver GW. 1974. CNS regulation of body temperature during hibernation. Am. J. Physiol. 227:583–89 73. Heller HC, Colliver GW, Beard J. 1977. Thermoregulation during entrance into hibernation. Pfl¨ugers 369:55–59 74. Henshaw RE. 1968. Thermoregulation during hibernation: application of Newton’s law of cooling. J. Theor. Biol. 20:79– 90 75. Herreid CF, Schmidt-Nielsen K. 1966. Oxygen consumption, temperature, and water loss in bats from different environments. Am. J. Physiol. 211:1108–12 76. Hiebert S. 1990. Energy costs and temporal organization of torpor in the rufous hummingbird (Selasphorus rufus). Physiol. Zool. 63:1082–97 77. Hildwein G. 1970. Capacit´es thermor´egulatrices d’un mammif`ere insectivore primitive, le Tenrec; leurs variations saisonni`eres. Arch. Sci. Physiol. 24:55– 71 78. Hill RW. 1975. Daily torpor in Peromyscus leucopus on an adequate diet. Comp. Biochem. Physiol. 51A:413–23 79. Hock RJ. 1951. The metabolic rates and body temperatures of hibernating bats. Biol. Bull. 101:289–99
22 Dec 2003
15:31
AR
AR205-PH66-10.tex
AR205-PH66-10.sgm
LaTeX2e(2002/01/18)
METABOLIC RATES DURING TORPOR 80. Hock RJ. 1960. Seasonal variations in physiologic functions of Arctic ground squirrels and black bears. Bull. Mus. Comp. Zool. 124:155–71 81. Hoffman RA, Prinzinger R. 1984. Torpor und Nahrungsausnutzung bei 4 Mausvogelarten (Coliiformes). J. Ornithologie 125:225–37 82. Holloway JC. 1998. Metabolism and thermoregulation in the sugar glider, Petaurus breviceps (Marsupialia). PhD thesis. Univ. New England, Armidale, Aust. 271 pp. 83. Holloway JC, Geiser F. 1995. Influence of torpor on daily energy expenditure of the dasyurid marsupial Sminthopsis crassicaudata. Comp. Biochem. Physiol. 112A:59–66 84. Holloway JC, Geiser F. 1996. Reproductive status and torpor of the marsupial Sminthopsis crassicaudata: effect of photoperiod. J. Therm. Biol. 21:373–80 85. Hudson JW. 1965. Temperature regulation and torpidity in the pygmy mouse, Baiomys taylori. Physiol. Zool. 38:243– 54 86. Hudson JW, Deavers DR. 1973. Thermoregulation at high ambient temperatures of six species of ground squirrels (Spermophilus spp.) from different habitats. Physiol. Zool. 46:95–109 87. Hudson JW, Scott JM. 1979. Daily torpor in the laboratory mouse Mus musculus var albino. Physiol. Zool. 52:205–18 88. Humphries MM, Thomas DW, Kramer DL. 2003. The role of energy availability in mammalian hibernation: a costbenefit approach. Physiol. Biochem. Zool. 76:165–79 89. Kayser C. 1939. Exchanges respiratoires des hibernants r´eveill´es. Ann. Physiol. Physicochim. Biol. 15:1087–219 90. Kayser C. 1961. The Physiology of Natural Hibernation. Oxford: Pergamon 91. Kayser C. 1964. La d´epense d’´energie des mammiferes en hibernation. Arch. Sci. Physiol. 18:137–50 92. Kenagy GJ. 1989. Daily and seasonal uses
93.
94.
95.
96.
97.
98.
99.
100.
101.
102.
P1: IBC
271
of energy stores in torpor and hibernation. In Living in the Cold II, ed. A Malan, B Canguilhem, pp. 17–24. London: Libby Eurotext Kenagy GJ, Vleck D. 1982. Daily temporal organisation of metabolism in small mammals: adaptation and diversity. In Vertebrate Circadian Systems, ed. J Aschoff, S Daan, G Groos, pp. 322–37. Berlin/Heidelberg/New York: Springer Kennedy PM, MacFarlane WV. 1971. Oxygen consumption and water turnover of the fat-tailed marsupials Dasycercus cristicauda and Sminthopsis crassicaudata. Comp. Biochem. Physiol. 40A:723– 32 K¨ortner G, Geiser F. 2000. The temporal organization of daily torpor and hibernation: circadian and circannual rhythms. Chronobiol. Int. 17:103–28 K¨ortner G, Geiser F. 2000. Torpor and activity patterns in free-ranging sugar gliders Petaurus breviceps (Marsupialia). Oecologia 123:350–57 K¨ortner G, Brigham RM, Geiser F. 2000. Winter torpor in a large bird. Nature 407:318 Kr¨uger K, Prinzinger R, Schuchmann K-L. 1982. Torpor and metabolism in hummingbirds. Comp. Biochem. Physiol. 73A:679–89 Lasiewski RC. 1963. Oxygen consumption of torpid, resting, active and flying hummingbirds. Physiol. Zool. 36:122–40 Lasiewski RC, Lasiewski RJ. 1967. Physiological responses of the Blue-throated and Rivoli’s hummingbirds. Auk 84:34– 48 Lindstedt SL. 1980. Regulated hypothermia in the desert shrew. J. Comp. Physiol. B 137:173–76 Lovegrove BG, Lawes MJ, Roxburgh L. 1999. Confirmation of pleisiomorphic daily torpor in mammals: the roundeared elephant shrew Macroscelides proboscideus (Macroscelidea). J. Comp. Physiol. B 169:453–60
22 Dec 2003
15:31
272
AR
AR205-PH66-10.tex
AR205-PH66-10.sgm
LaTeX2e(2002/01/18)
P1: IBC
GEISER
103. Lovegrove BG, Raman J, Perrin MR. 2001. Heterothermy in elephant shrews, Elephantulus spp. (Macroscelidea): daily torpor or hibernation? J. Comp. Physiol. B 171:1–10 104. Lyman CP. 1948. The oxygen consumption and temperature regulation in hibernating hamsters. J. Exp. Zool. 109:55–78 105. Lyman CP. 1958. Oxygen consumption, body temperature and heart rate of woodchucks entering hibernation. Am. J. Physiol. 194:83–91 106. Lyman CP, Willis JS, Malan A, Wang LCH. 1982. Hibernation and Torpor in Mammals and Birds. New York: Academic 107. MacMillen RE. 1965. Aestivation in the cactus mouse Peromyscus eremicus. Comp. Biochem. Physiol. 16:227–47 108. Malan A. 1986. pH as a control factor in hibernation. In Living in the Cold, ed. HC Heller, XJ Musacchia, LCH Wang, pp. 61–70. New York: Elsevier 109. Malan A. 1989. pH as a control factor of cell function in hibernation: the case of brown adipose tissue thermogenesis. In Living in the Cold II, ed. A Malan, B Canguilhem, pp. 205–15. London: Libby Eurotext 110. Malan A. 1993. Temperature regulation, enzyme kinetics, and metabolic depression in mammalian hibernation. In Life in the Cold, ed. C Carey, GL Florant, BA Wunder, B Horwitz, pp. 241–52. Boulder, CO: Westview 111. Marsh RL, Dawson WR. 1989. Avian adjustments to cold. In Advances in Comparative and Environmental Physiology, ed. LCH Wang, pp. 205–53. Berlin/Heidelberg: Springer 112. Martin SL, Maniero GD, Carey C, Hand SC. 1999. Reversible depression of oxygen consumption in isolated liver mitochondria during hibernation. Physiol. Biochem. Zool. 72:255–64 113. McKechnie AE, Lovegrove BG. 2001. Heterothermic responses in the speck-
114.
115.
116.
117.
118.
119.
120.
121.
122.
123.
124.
led mousebird (Colius striatus). J. Comp. Physiol. B 171:507–18 McKechnie AE, Lovegrove BG. 2002. Avian facultative hypothermic responses: a review. Condor 104:705–24 McNab BK, Morrison PR. 1963. Body temperature and metabolism in subspecies of Peromyscus from arid and mesic environments. Ecol. Monogr. 33:63–82 Milsom WK. 1993. Metabolic depression during hibernation: the role of respiratory acidosis. In Life in the Cold, ed. C Carey, GL Florant, BA Wunder, B Horwitz, pp. 541–44. Boulder, CO: Westview Morhardt JE. 1970. Body temperatures of white-footed mice (Peromyscus sp.) during daily torpor. Comp. Biochem. Physiol. 33:423–39 Morrison PR, Ryser FA. 1962. Metabolism and body temperature in a small hibernator, the meadow jumping mouse, Zapus hudsonicus. J. Cell. Comp. Physiol. 60:169–80 Morrison PR, McNab BK. 1962. Daily torpor in a Brazilian murine opossum (Marmosa). Comp. Biochem. Physiol. 6:57–68 Morton SR, Lee AK. 1978. Thermoregulation and metabolism in Planigale maculata (Marsupialia: Dasyuridae). J. Therm. Biol. 3:117–20 Muchlinski AE, Ryback EN. 1978. Energy consumption of resting and hibernating meadow jumping mice. J. Mammal. 59:435–37 Mzilikazi N, Lovegrove BG. 2002. Reproductive activity influences thermoregulation and torpor in pouched mice, Saccostomus campestris. J. Comp. Physiol. B 172:7–16 Mzilikazi N, Lovegrove BG, Ribble DO. 2002. Exogenous passive heating during torpor arousal in free-ranging rock elephant shrews, Elephantulus myurus. Oecologia 133:307–14 Nagel A. 1985. Sauerstoffverbrauch, Temperaturregulation und Herzfrequenz
22 Dec 2003
15:31
AR
AR205-PH66-10.tex
AR205-PH66-10.sgm
LaTeX2e(2002/01/18)
METABOLIC RATES DURING TORPOR
125.
126.
127.
128.
129.
130. 131.
132.
133.
134.
bei europ¨aischen Spitzm¨ausen (Soricidae). Z. S¨augetierkunde 50:249–66 Nedergaard J, Cannon B. 1984. Preferential utilization of brown adipose tissue lipids during arousal from hibernation in hamsters. Am. J. Physiol. Regul. Integr. Comp. Physiol. 247:R506–12 Neumann RL, Cade TJ. 1965. Torpidity in the Mexican ground squirrel, Citellus mexicanus parvidens (Mears). Can. J. Zool. 43:133–40 Nicol S, Andersen NA, Mesch U. 1992. Metabolic rate and ventilatory pattern the echidna during hibernation and arousal. In Platypus and Echidnas, ed. ML Augee, pp. 150–9. Sydney: Royal Zool. Soc. NSW Nicol S, Pavlides D, Andersen NA. 1997. Nonshivering thermogenesis in marsupials: absence of thermogenic response to ß3-adrenergic agonists. Comp. Biochem. Physiol. 117A:399–405 Ortmann S, Heldmaier G. 2000. Regulation of body temperature and energy requirements of hibernating Alpine marmots (Marmota marmota). Am. J. Physiol. Regul. Integr. Comp. Physiol. 278:R698– 704 Pearson OP. 1950. The metabolism of hummingbirds. Condor 52:145–52 Pohl H. 1961. Temperaturregulation und Tagesperiodik des Stoffwechsels bei Winterschl¨afern. Z. Vergl. Physiol. 45:109– 53 Prinzinger R, Siedle K. 1988. Ontogeny of metabolism, thermoregulation and torpor in the house martin Delichon u. urbica (L.) and its ecological significance. Oecologia 76:307–12 Prinzinger R, G¨oppel R, Lorenz A, Kulzer E. 1981. Body temperature and metabolism in the red-backed mousebird (Colius castanotus) during fasting and torpor. Comp. Biochem. Physiol. 69A:689– 92 Raison JK, Lyons JM. 1971. Hibernation: alteration of mitochondrial membranes as a requisite for metabolism at low tempera-
135.
136.
137.
138.
139.
140.
141.
142.
143.
P1: IBC
273
ture. Proc. Natl. Acad. Sci. USA 68:2092– 94 Schleucher E. 2001. Heterothermia in pigeons and doves reduces energetic costs. J. Therm. Biol. 26:287–93 Schmid J. 1996. Oxygen consumption and torpor in mouse lemurs (Microcebus murinus and M. myoxinus): preliminary results of a study in western Madagascar. In Adaptations to the Cold: Tenth Int. Hibernation Symp., ed. F Geiser, AJ Hulbert, SC Nicol, pp. 47–54. Armidale, AU: Univ. New England Press Scholander PF, Hock RJ, Walters V, Johnson F, Irving L. 1950. Heat regulation in some arctic and tropical mammals and birds. Biol. Bull. 99:237–58 Snapp BD, Heller HC. 1981. Suppression of metabolism during hibernation in ground squirrels (Citellus lateralis). Physiol. Zool. 54:297–307 Snyder GK, Nestler JR. 1990. Relationship between body temperature, thermal conductance, Q10 and energy metabolism during daily torpor and hibernation in rodents. J. Comp. Physiol. B 159:667–75 Song X, K¨ortner G, Geiser F. 1995. Reduction of metabolic rate and thermoregulation during daily torpor. J. Comp. Physiol. B 165:291–97 Song X, K¨ortner G, Geiser F. 1996. Interrelations between metabolic rate and body temperature during entry into daily torpor in Sminthopsis macroura. In Adaptations to the Cold: Tenth Int. Hibernation Symp., ed. F Geiser, AJ Hulbert, SC Nicol, pp. 63–69. Armidale, AU: Univ. New England Press Song X, K¨ortner G, Geiser F. 1997. Thermal relations of metabolic rate reduction in a hibernating marsupial. Am. J. Physiol. Regul. Integr. Comp. Physiol. 273:R2097–104 Speakman JR, Thomas DW. 2003. Physiological ecology and energetics of bats. In Bat Ecology, ed. TH Kunz, M Brock Fenton, pp. 430–90. Chicago/London: Univ. Chicago Press
22 Dec 2003
15:31
274
AR
AR205-PH66-10.tex
AR205-PH66-10.sgm
LaTeX2e(2002/01/18)
P1: IBC
GEISER
144. Steiger R. 1992. Energiehaushalt im Winterschlaf vom Goldmantelziesel (Spermophilus lateralis) und vom Siebenschl¨afer (Glis glis). Diplom thesis. Univ. Marburg. 81 pp. 145. Storey KB, Storey JM. 1990. Metabolic rate depression and biochemical adaptation in anaerobiosis, hibernation and estivation. Q. Rev. Biol. 65:145–74 146. Strumwasser F. 1960. Some physiological principles governing hibernation in Citellus beecheyi. Bull. Mus. Comp. Zool. Harvard Coll. 124:282–318 147. Th¨ati H. 1978. Seasonal differences in O2 consumption and respiratory quotient in a hibernator (Erinaceus europaeus). Ann. Zool. Fenn. 15:69–75 148. Thompson SD. 1985. Subspecific differences in metabolism, thermoregulation, and torpor in the western harvest mouse Reithrodontomys megalotis. Physiol. Zool. 58:430–44 149. Tucker VA. 1965. Oxygen consumption, thermal conductance, and torpor in the Californian pocket mouse Perognathus californicus. J. Cell. Comp. Physiol. 65:393–404 150. Turbill C, Law BS, Geiser F. 2003. Summer torpor in a free-ranging bat from subtropical Australia. J. Therm. Biol. 28:223– 36 151. van Breukelen F, Martin SL. 2002. Reversible depression of transcription during hibernation. J. Comp. Physiol. B 172:355–61 152. Wang LCH. 1978. Energetics and field aspects of mammalian torpor: the Richardsons’s ground squirrel. In Strategies in Cold, ed. LCH Wang, JW Hudson, pp. 109–45. New York: Academic 153. Wang LCH, Hudson JW. 1970. Some physiological aspects of temperature regulation in normothermic and torpid hispid pocket mouse, Perognathus hispidus. Comp. Biochem. Physiol. 32:275–93
154. Wang LCH, Hudson JW. 1971. Temperature regulation in normothermic and hibernating eastern chipmunk, Tamias striatus. Comp. Biochem. Physiol. 38A: 59–90 155. Wang LCH, Lee T-F. 2000. Perspectives on metabolic suppression during mammalian hibernation and daily torpor. In Life in the Cold: Eleventh Int. Hibernation Symp., ed. G Heldmaier, M Klingenspor, pp. 149–58. Berlin/Heidelberg/New York: Springer 156. Watts PD, Oritsland NA, Jonkel C, Ronald K. 1981. Mammalian hibernation and the oxygen consumption of a denning black bear (Ursus americanus). Comp. Biochem. Physiol. 69A:121– 23 157. Willis CKR, Brigham RM. 2003. Defining torpor in free-ranging bats: experimental evaluation of external temperaturesensitive radiotransmitters and the concept of active temperature. J. Comp. Physiol. B 173:379–89 158. Willis JS. 1982. The mystery of the periodic arousal. In Hibernation and Torpor in Mammals and Birds, ed. CP Lyman, JS Willis, A Malan, LCH Wang, pp. 92–103. New York: Academic 159. Wilz M, Heldmaier G. 2000. Comparison of hibernation, estivation and daily torpor in the edible dormouse, Glis glis. J. Comp. Physiol. B 170:511–21 160. Withers PC. 1977. Respiration, metabolism, and heat exchange of euthermic and torpid poorwills and hummingbirds. Physiol. Zool. 50:43–52 161. Withers PC, Richardson KC, Wooller RD. 1990. Metabolic physiology of euthermic and torpid honey possums, Tarsipes rostratus. Aust. J. Zool. 37:685–93 162. Wolf LW, Hainsworth FR. 1972. Environmental influence on regulated body temperature in torpid hummingbirds. Comp. Biochem. Physiol. 41A:167–73