JOURNAL
OF GEOPHYSICAL
RESEARCH,
VOL. 101, NO. D19, PAGES 24,105-24,115, OCTOBER
30, 1996
Meteorological conditions associated with vertical distributions of aerosols
off the west coast of Africa
Henry E. Fuelberg and JonathanD. VanAusdall Department of Meteorology,Florida State University,Tallahassee
Edward
V. Browell
NASA Langley ResearchCenter, Hampton, Virginia
Scott P. Longmore Department of Meteorology,Florida State University,Tallahassee
Abstract. Vertical distributionsof aerosolbackscatteringwere obtainedon Transport and AtmosphericChemistryNear the Equator--Atlantic (TRACE A) flightsparallel to the westcoastof Africa usingthe airbornedifferentialabsorptionlidar (DIAL) instrument. Aerosoldistributionson the flight of October 15, 1992 (from 22øSto 5.5øS),exhibitstrong horizontal and vertical gradients.The top of the aerosollayer rangesfrom 3.5 to 5.7 km above sea level, while its thicknessrangesfrom 1.4 to 4.5 km. The greatestaerosolloading generallyoccursnear 4.0- to 4.5-km altitude between8ø and 12øS.Meteorological conditionsare found to exert a major influenceon the aerosol distributions.Dropsonde data along the flight track indicate numeroustemperature inversionsand stable layersin each sounding.The top of the aerosolregion is associatedwith stronginversionsdue to subsidence.Five-daybackwardtrajectoriesare calculatedalong the flight track at vertical intervalsof 1 km usingglobal meteorologicalanalyses.Trajectoriesarriving at most locationsof large aerosolloading originate over southernAfrica, where biomassburning is occurringand deep surface-based mixed layersare common.Conversely,the air with less aerosolloadingoriginatesover the Atlantic Ocean. The exceptionis the northernmost segmentof the flight above3.5 km. Although this segmentreceivesflow off Africa at these altitudes,lower level stablelayersinhibit transportto higher levels.In addition, trajectoriesarrivingat this part of the flight passover a portion of Africa with reduced biomassburning and extensivedeep convectionthat penetratesthe stablelayers. 1.
Introduction
Numerousstudieshave examinedaerosolsover the tropical South Atlantic Ocean [e.g., Chesteret al., 1972;Parkin et•al., 1972;Cachieret al., 1986;Losnoet al., 1992]. In a very recent paper, Garstanget al. [this issue]used satellite-derivedmeasurementsof aerosol optical depth to determine horizontal distributionsof aerosolsover the South Atlantic during August-October1987 and 1992.The australspringof 1992 coincided with the Southern African Fire-Atmosphere Research Initiative (SAFARI). They found enhancedaerosol loading extendinginto the Atlantic from the coastsof Angola and northernNamibia. In a related SAFARI study,Swapet al. [this issue] examined aerosol transport between southern Africa andthe centralSouthAtlanticOcean(AscensionIsland).West Africa, between 20øSand 10øN, was found to be the major sourcefor air arrivingin the lower troposphereoverAscension Island. The aerosolswithin this air were attributed largely to biomassburning and soil dust. In addition, air over southern Africa wasfound to undergoconsiderablerecirculationdue to closedanticyclonesthat are commonover the region [Garstang et al., this issue;Swapet al., this issue].
The Transportand AtmosphericChemistryNear the Equator-Atlantic (TRACE A) experimentwas conductedsimultaneouslywith SAFARI. The TRACE A flightsof October 14, 15, and 18 were conducted over the eastern South Atlantic
Ocean, nearly parallel to the west coastof Africa [Fishmanet al., this issue].These flightsintersectedthe region of greatest aerosolloading describedby Garstanget al. [this issue].The airborne differential absorption lidar (DIAL) instrument [Browell,1989, 1991] provided information about the vertical distribution of aerosol loading, while dropsondesreleased along the flight tracksyielded in situ meteorologicaldata. This paper examinesmeteorologicalconditionsassociated with aerosoldistributionsobservedduringthe TRACE A flight of October 15, 1992.It complementsGarstanget al. [thisissue] and Swapet al. [this issue]by focusingon the vertical aerosol distribution
between
Africa
and Ascension
Island.
Aerosol
data from the DIAL are describedfirst, followed by atmosphericthermodynamics revealedby the dropsondedata and land-basedsoundings.Backwardtrajectoriesthen are used to estimate origins of the aerosol-ladenair. Finally, trajectories for the October 15 caseare comparedwith thosefor a monthlong period during TRACE A.
Copyright1996by the AmericanGeophysicalUnion.
2.
Paper number 95JD02889.
The TRACE A flight of October !5, !992, is depicted in Figure 1. The DC 8 aircraft departed Windhoek, Namibia
0148-0227/96/95 JD-02889509.00
24,105
Aerosol
Distributions
24,106
FUELBERG
300 MB
1200 UTC
ET AL.: METEOROLOGY
OCT. 15, 1992
20N
20
40S 100W
60
80
40
500MB
20
0
1200UTC
20
40E
OCT. 15,1992
20N
20
40S 100W
80
60
40
700 MB ,i
20
0
1200 UTC i
i
20
40E
OCT. 15, 1992 i
i
20N
i
OF AEROSOLS OFF WEST AFRICA
Aerosol distributionsalong the flight track exhibit strong horizontalandverticalgradients(Plate 1). For easeof presentation, we define the aerosollayer by valuesof relative atmosphericbackscattering greater than 10 units (blue and green shades),andregionsof heavyaerosolloadingby valuesgreater than 30 units(beginningwith the yellowshading).Along the southern(left) portion of the flight, southof approximately 19øS,the aerosollayer is relativelythin and centerednear 4 km. The aerosolloadingis relativelylight. The aerosollayer is thickestalongthe centralportion of the flight, where its top reaches5.7 km. Regionsof heavyloadingare found within this deepestregion. Dark segmentsbelow ---1 km are due to extensivelow-level cloud cover. The greatestrelative aerosol backscattering, exceeding50 units,occursin a broadlayernear 4-km altitude between 8ø and 12øS.The top of the overall aerosollayer is graduallylower toward the north in this area. Finally, at the northernmostportion of the flight, the air is relatively free of aerosolsat altitudes above 3.5 km; instead, greatestloadingis near 1.5 km. The aerosolfeatureson October 15 (Plate 1) are similarto thoseof the other flightsin this area (October 14 and 18, not shown).The followingsections examinemeteorologicalconditionsassociated with the aerosol distributions
3. 20
40S
100W
80
60
850 MB
40
20
1200 UTC
0
20
40E
OCT. 15, 1992 ,
20N
20
40S 100W
80
60
40
20
0
20
40E
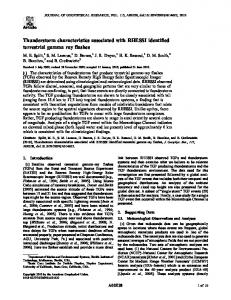
Figure 1. Streamline analysesfrom ECMWF data for variouslevels(in millibars)on 1200 UTC October15, 1992.The flight track for October 15, 1992, is superimposed.
(22.5øS,17.5øE),near 0720 UTC, headednorthwestto near 20øS,8øE, and then turned to a more northerlyheading.The northernmostextent of the flight was 5.5øS,4øE, and the aircraft cruisingaltitude was 10.2 km. The airborne DIAL systemhas been used in many field experimentsto studythe distributionof aerosolsand ozonein the troposphereand to relate these observationsto chemical and dynamicalprocesses [e.g.,Browellet al., 1988,1990,1994]. The lidar backscatterreturn at 1064 nm is usedin the present analysisto determinethe aerosoldistributionalongthe DC 8 flight track during TRACE A. At this laser wavelength,the lidar return is most sensitiveto aerosolswith diametersgreater than 1.0/am [Van de Hulst, 1957].This providessensitivityto air masseswith differentamountsof large aerosols,suchas is foundin biomassburningplumes[Andreaeet al., 1988;Anderson et al., this issue].
of October
15.
Meteorological Conditions
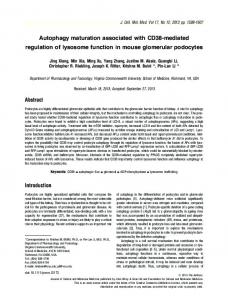
Large-scalecirculationpatternsover the area are depicted usingstreamline analyses (Figure1) obtainedfromtheEuropean Centrefor Medium-Range WeatherForecasts (ECMWF) global dataset[Bengtsson, 1985].Flow patternsat all levels(850, 700, 500, and300 mbar) exhibitstronghorizontalandverticalshear alongthe flight.At 850 mbar (approximately1.5 km abovesea level) the flightpassesthrougha weak cyclonelocatedoff the coastof Angola. At higher levels,important circulationfeatures are the semipermanentanticycloneover the central South Atlantic Ocean, transient systemsin the middle latitudes,and a col (a region of light and variablewinds).The flightintersectsthe ridgeline and col,with onshoreflow along the southernreachesof the flighttrackbut offshoreflowin the northernportions.Additional informationaboutflow patterns during TRACE A and SAFARI is given by Bachmeierand Fuelberg[thisissue],Diab et al. [thisissue],Garstanget al. [this issue],and Swapet al. [this issue]. Dropsondeswere releasedat approximately20-minintervals duringthe flight of October 15, for a total of sevensoundings. Thesedatadescribein situmeteorologicalconditionsalongthe flighttrack.Characteristics of the dropsondedata are outlined by theNationalCenterfor Atmospheric Research[1994].Soundingsfrom drops1 (southernmost, 21øS,11øE),4 (central,14øS, 6øE),and 7 (northernmost, 6øS,4øE)are shownin Figure2. Numeroustemperatureinversionsor stablelayersare indicated along the flight track (Figure 2), but two featuresare mostprominent.The well-knowntrade wind inversionis very intense;itsbaserisesfrom approximately 0.9 km (915mbar) at drop 1 to 1.2 km (880 mbar) at drop 7. These levels are approximately0.5 km higherthan annualvaluesgivenby yon Ficker [1936] and reportedby Garstanget al. [thisissue].The inversionis deepestalongthe southernportion of the flight. A secondgroupof intenseinversionsoccursbetween5.0 and 6.5 km (550 and 450 mbar) (Figure2). Althoughpresentin all sevensoundings,the inversionis mostpronouncedalongthe centralportionof the flight(e.g.,drop4). It ishighestalongthe northern end of the flight. These inversionsare due to subsi-
FUELBERGET AL.: METEOROLOGYOF AEROSOLSOFF WESTAFRICA
o
¸
o
(v•:• z
o
o
o
o
o
24,107
24,108
FUELBERG
/
ET AL.' METEOROLOGY
IO0
A DROP
I
200
300,2
400 E
/
/
600
800 1000
-30-Z0-•0
0
•0
Z0
30 100
•ROP 4 300
320
200
300,2
400 E
'
600
/
-•o-2o-•o
o
•o
2o
DROP
above the trade wind inversion.
•o
7
300'2
400 E 600
800
./
?
••X
••7
the lowest 2 km of the cross section. The 2- to
following sections. Figure 3b contains an analysisof potential temperature along the flight track derivedfrom the dropsondedata. Near the surface,the closeverticalspacingof the isentropesdenotes the very stabletrade wind inversion.The subsidence inversions
2O0
•/
sion dominates
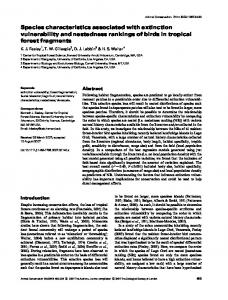
5-km layer containsalmostno stablelayersalongthe southern two thirds of the flight. Conversely,the northernmostpart of the flight, especiallydrop 7, containsseveralstable features within this layer. Multiple stable layersassociatedwith subsidence are located above5 km throughoutthe flight. The top of the aerosol region correspondsto altitudes of major stablelayers(Figure3a). Many of the soundings exhibit severalstablelayersof variousintensitiesaboveapproximately 5 km; however,the top of the aerosolregion generallyagrees with the baseof the loweststrongstablezone abovethe trade wind inversion.The aerosolregionitselfis almostfree of stable layers.The northernmostlocation(drop 7) is especiallyinteresting.Stable layersoccur at lower altitudesthan at locations farther south,and the top of the aerosolregionis considerably lower as well (3.5 km). Nonetheless,the top of the enhanced aerosolscoincideswith a stablelayer, albeit not the lowestone
I000
IO0
c
We prepared a cross section showingthe altitudes and strengthsof all absolutelystablelayersin the sevendropsondederivedsoundings (Figure 3a). The thicknessof eachbar representsthe top and bottom of the stablelayer, while its width correspondsto strength.The widestbars representisothermal layersor temperatureinversionsin which potential temperature 0 increasesat a rate exceeding10øC/km.The narrowest bars denotelayersin which riO/& increasesat between5.0øand 7.5øC/km.These layers still are absolutelystable, since their temperature T lapse rates are less than the moist adiabatic value. Finally, an intermediate categorydenotesstable layers in which riO/& rangesbetween 7.5ø and 10.0øC/km.Aerosol distributionsare shownin the background(also seePlate 1). The manystable/inversion layersalongthe flight track (Figure 3a) exhibitgood spatialcontinuity.The trade wind inver-
800
T (øC)
/
OF AEROSOLS OFF WEST AFRICA
This is discussed further
in the
above5 km are mostintensenear the centerof the flight (e.g., drops3 and 4). The basesof theseinversions(Figures2 and 3a) correspondto a potential temperatureof approximately 320 K, and thisvalue agreescloselywith the top of the aerosol layer at all but the northernmostlocation(drop 7), where the top correspondsto a value near 317 K. The isentropesexhibit relativelylargevertical spacingbetween2 and 5 km alongthe southerntwo thirds of the flight. This denotesthe nearly dry adiabaticlapse rates occurringin the layer (Figure 2). The wind data (Figure 3b) showthe strongshearsalsoseenin the ECMWF analyses(Figure 1). Strong stable layers act as a cap or lid to synoptic-scale vertical
motion.
Thus there
is little
interaction
between
the
layernearthe surface(belowthe tradewind inversion)andthe -so-so-•o o •o •o so lessstableair in the middle troposphere.Similarly,the intense subsidenceinversionsbetween 5 and 6 km greatly limit the Figure 2. Skew TIn p diagramsof dropsondedata at loca- exchangeof air above and below it. Only intense convection tions (a) 1 (southernmost,21øS,11øE), (b) 4 (central, 14øS, would be able to penetrate these stablelayers. 6øE),and (c) 7 (northernmost,6øS,4øE). IO00
4. dence associatedwith the major anticycloneover the Atlantic. They are a semipermanentfeature over southernAfrica and Ascension Island during the TRACE A/SAFARI periods [Garstanget al., this issue;Swapet al., this issue].
Trajectory Analyses
We determinedthe originsof air comprisingthe regionsof large and smallaerosolloadingin Plate 1. Specifically,threedimensional5-day backwardtrajectorieswere calculatedusing a kinematictrajectorymodel in which parcelsare advectedby
FUELBERG ET AL.: METEOROLOGY OF AEROSOLSOFF WEST AFRICA
24,109
9 8
4OO 7
E6
500
o
600
n
N5 4
7OO 2
8OO 900 I000 I
2
3
4
5
6
SOUTH
7
NORTH
9 8
4OO 7 500
E6 '-'5
600 4
7OO 8OO
2
90O I000
I
2
3
SOUTH
4
5
6
7
NORTH
Figure3. (a) Altitudes andstrengths of majorstablelayersdiagnosed fromdropsonde dataalongtheflight track.Thewidthof eachbar denotes the degreeof stability, whilethe bar thicknesses denotethe topsand bottoms of thestablelayers. Seetextfor additional details. Aerosoldistributions fromPlate1 aresuperimposed, i.e.,the10-and30-unitisolines. (b) Isentropes (in degrees Kelvin)andwinddataalongtheflighttrack.
Windsarein m s-•, withshortandlongbarbsdenoting values of 2.5and5 m s-•, respectively. Aerosol distributions are superimposed as in Figure 3a.
the windswithoutemployingthe isentropicassumption [Fuel- at AscensionIsland (8øS,14øW) duringTRACE A/SAFARI berget al., thisissue;Loringet al., thisissue].ECMWF global were producedfrom vegetation,soils,and biomassburning analysesof the three wind componentsat 12-hour intervals overAfrica [Swape! al., thisissue].Thereforewe countedthe between1000and50 mbarservedasinput.Pickering etal. [this numberof hoursthat the 25 trajectoriesof eachclusterwere issue]noted that ECMWF analyseswere marginallybetter overthe Africancontinentduringthe 5-dayperiod.A trajecthan thosefrom the NationalMeteorologicalCenter during tory clusterconsisted of as manyas 3025hours(25 pointsx the TRACE A period. Nonetheless,the ECMWF wind anal- 121hours);however,sometrajectoriesarrivingat 1 and 2 km yses(Figure1) do not agreeperfectlywiththe observed drop- intersected the surfacebeforethe endof the 5-dayperiod.For sonde-derived winds(Figure3b). This occursbecausethe re- example,one clusterarriving at 2 km consistedof as few as gionsof largehorizontalandverticalshearare difficultto place 2750 hours,while one arrivingat 1 km had only 1736hours. accuratelywith the limited observationsthat are availableover Figure 4 depictsthe percentageof time that a clusterat each the South Atlantic Ocean. altitudewasoverthecontinent, i.e.,actualhoursdividedbythe Trajectorieswere calculatedat 1-km vertical intervalsbe- numberof possible hours(from 1736to 3025hours). tween 1 and 9 km at each of the sevendropsonderelease The above-mentioned procedureattemptsto documentthe points.Acknowledging the largewindshearsthat are observed, time that parcelsspendoverAfrica;however,it haslimitations. and the uncertaintiesassociated with the ECMWF analyses For example,the choiceof a 5-dayperiodwasarbitrary.Most and trajectorymethodologies,trajectorieswere obtainedfor clustersof pointscenteredon eachdrop site. Similarprocedureshavebeenadvocated byMenill etal. [1985],Kahl [1993], andPickering et al. [thisissue].Eachclusterconsisted of a 5 x 5 matrixof points,with eachpoint separatedby a 1ø latitude/ longitudeinterval.Thusa total of 1575trajectories wereprepared(7 dropsitesx 9 levelsx 25 pointsper cluster). Sinceit is not feasibleto showtrajectories for all 63 clusters, we deviseda simpleprocedurefor quantifyingthe resultsand relatingthemto the aerosoldistributions. Mostaerosols arriving
parcelsthat ultimatelypassedoverAfrica would do sowithin 2
or 3 days;however,somemeanderedoverthewaterfor longer periodsbeforecrossing the coastline.If trajectorieshad been calculatedover 10-dayperiods,for example,the statisticsin Figure4 wouldchange.Thesechanges will be discussed in the followingsectionswhere appropriate. The trajectorydata(Figure4) mustbe incorporated with the stabilityanalyses(Figure 3) to understandthe aerosoldistributions(Plate 1). However,it is interestingthat the trajectory data alone showgenerallygood agreementwith the vertical
24,110
FUELBERG
ET AL.: METEOROLOGY
OF AEROSOLS OFF WEST AFRICA
9 8
400 7
'•6
500
N5
600 •
4
700
2
800
I
900
IOO0
I
SOUTH
2
.'5
4
o 4o •o%
5
6
7
NORTH
Figure 4. Percentagesof time that a cluster spent over the African continent. See scale at the bottom. Valueswere obtainedfrom trajectoryanalysesasdescribedin the text.Aerosoldistributionsare superimposed as in Figure 3a.
Each of these parcels originatesover south central Africa 5 daysearlier (Figure 6a). They are typicalof all the trajectories originating over this region. The parcels generally begin at lower levels,and their altitudesrange from approximately580 mbar (4.6 km) to 870 mbar (1.3 km) duringthe period. C respondingtime seriesfor three representativetrajectoriesarrivingat 4 km in cluster4 (Figure 7b) showa similarrangeof altitudesand similar originsat lower altitudes. Few upper air sites are located over south central Africa; however, soundingsare available at Etosha National Park, Namibia (19øS,16øE),and Lusaka,Zambia (15øS,28øE)(Figures8a and 8b). Thesesoundings exhibita nearlydry adiabatic layerbetweenthe surfaceand550-600 mbar (•--4.5km) that is capped by a temperature inversion.Deep mixed layers and associatedcappinginversionswere commonover southernAfrica during TRACE A/SAFARI [Garstanget al., this issue; Swap et al., this issue].Dry convectivetransportwithin such layers mixes surface-basedaerosolsthroughout their depths. These soundings,the dropsondedata along the flight track (Figure 3a), and the altitudeplots(Figures7a and 7b) indicate that are both farther north and south. The 1-km level is within that the trajectoriesoriginatingover south central Africa rethe strongtradewindinversion(Figures2 and3a), andparcels main within the mixed layer during their transitsto clusters1 arrivingthere experienceonly slightvertical displacementdur- and 4. This agreeswith findingsof Swapet al. [this issue]and Garstanget al. [this issue]. ing the 5-day period (not shown). Greatest aerosol loading along the southern two thirds of Unlike drop locations I and 4, location 7 at 6øS, 4øE is the flightoccursnear 4 km. Trajectoriesarrivingat 4 km (•--635 relativelyfree of aerosolsat 4 km (Plate 1). Instead,the aerosol mbar) within drop clusters1 and 4 have spentapproximately layer extendsfrom about 1 to 3 km. This occurseven though half of their 5-day historiesover Africa (Figure 4). However, parcelsarriving at 4 and 5 km spendapproximately75% of trajectorypaths for these two drops differ considerablyfrom their 5-dayhistoriesoverAfrica (Figure 4). A few of the 5-day each other (Figures6a and 6b). All of the parcelsarrivingat trajectoriesoriginatenorth of the equator (Figure 6c); howcluster 4 originate almost due east over Africa. This area, ever, the majoritybeginbetween0 and 10øS.Somefactor other between approximately 10ø and 20øS, contains the greatest than African origin is responsiblefor the relativelyaerosolfree biomassburning duringthe TRACE A period [Fishmanet al., air above 3.5 km. this issue].Trajectoriescomprisingcluster I originate over a The soundingfor drop 7 (Figure 2c) containsseveralstable much larger area. Many of them travel over the SouthAtlantic layersbelow the top of the aerosollayer, i.e., between2 and 4 Ocean and follow long counterclockwise paths that passover km (Figure 3a). Trajectoriesindicatethat air arrivingat these the southwesterncorner of Africa. Others originate over Af- levels(e.g., 4 km in Figure 6c) would havebeen over extreme rica between 10ø and 20øS.If the trajectoryperiod were ex- westernAfrica approximately2 daysearlier, i.e., on October tended beyond 5 days, the percentagesfor cluster 4 would 13. Several conditionsover westernAfrica might explain the increaserelativeto thoseof clusterI (Figure4), therebyagree- relative aerosolminimum at location7. The soundingat Brazing with the greater aerosolloading at the more central site. zaville, Congo(4øS,15øE),for 0948 UTC October 13 (Figure Time seriesof pressurealtitudesfor three trajectoriesarriv- 8c) doesnot exhibitthe deepsurface-based mixedlayerseenat ing at 4 km (•--635mbar) in clusterI are shownin Figure 7a. Etoshaand Lusaka(Figures8a and 8b). Instead,it containsa
distributionof aerosols(Figure 4). The northernmostdrop site is the exception.In general,trajectoriesarrivingat between3and 5-km altitude spendthe greatestpercentagesof time over Africa, and this layer usuallycorrespondsto the altitudesof largestaerosolloading (exceptfor the extremenorth). Conversely, the smallestpercentagesoccur at 1 km and the top levels,where loadingsare relativelysmall.Drop locations1, 4, and 7 are examinedin detail in the followingparagraphs. The air at I km (•--905mbar) is relativelyfree of aerosolsat all locationsalongthe flighttrack(Plate 1), andthe trajectories reveal that this air has spent little time over Africa during the past 5 days(Figure 4). Percentagesare lessthan 16% at all locations.Horizontal depictionsof the trajectoriesshowthat air arrivingat the southernend of the flight at 1 km (drop 1, Figure 5a) travels parallel to the coastlinefor several days before fanning out over the South Atlantic Ocean. At the northernend of the flight (drop 7, Figure 5c), the air arriving at 1 km originatesfarther north. More of these trajectories probablywould reach central Africa if trackedbeyond5 days. Finally, parcels arriving near drop 4 originate from locations
FUELBERG
ET AL.: METEOROLOGY
OF AEROSOLS
OFF WEST AFRICA
24,111
broad stable layer of varying intensity between approximately 1 and3.0km(900-700mbar).Thisstablelayerwillinhibitaero-
solsfromreachinghigherlevels.In addition,biomass burning
was relatively infrequent north of approximately 10øS [Fishman 0 etal., this issue], and satellite imagery (not shown) indicates
widespread deep convection over this portion of Africa on the
•___•
days near October 15.Theregion ofsmall aerosol loading-20
0 --4
-:•0
-40--
'•-• -
•
•-•
40
-20
-40
0
-20
0
20
40
-4O
DROP -40
-20
0
20
7 40
-20
Figure 6. As in Figure5, exceptfor arrivalsat 4 km (---635 mbar).
-40
above3.5 km corresponds to a wedgeof enhancedozone-rich air that is thoughtto have comefrom biomassburningover DROP 7 Africa [Browellet al., thisissue].The lackof aerosolsin the air masspossiblyis due to removalby washoutduringconvective -40 -20 0 20 40 transport.Pressurealtitudesof selectedtrajectoriesarriving within cluster7 at 4 km (Figure7c) indicatethat the air origFigure 5. Horizontaldepictionof 5-daybackwardtrajectoriesarrivingat 1 km (---905mbar)for dropsites(a) 1, (b) 4, and inatesfrom a variety of altitudes.It is importantto note that mesoscale motions associated with individual convective (c) 7. Dotsrepresent locations at 1-dayintervals.
24,112
FUELBERG ET AL.: METEOROLOGY OF AEROSOLS OFF WEST AFRICA I00
100
ETOSHA
.........
DROPI
A
3/0 10-14-92 o,/332 ø/ • IO0;03UTC 200
200
IO-
_
8-
300
•oo•
.....
/ 4oo•
•c o_
400
,
_/
500 -
2-_Y / / / •// o-l/ ,/ ,/ .••/
600 700 8OO 9OO
-30-20-•0
0
10000 1'2 2'4 3'6 4'8 6'0 7'2 8'4 9'61•)8120
• •0
/ • .••/
20
800 Iooo
30
T (øC)
TIME (HRS) 100
I00
.........
DROP
4
B
//
_
_
200 200 --
•o-
3oo•
8-
400 E
-
300
-
400
E6•
5O0
-
N4_
600
600
-
700 80O 900
2-
-o
800
o-
10000 12 24 36 48 60 72 84 96 108120
-
/
•
•
-30-20-•0
/
•
•
0
•0
/
•
20
•
I000
30
T (øC)
TIME (HRS)
I00
100
.........
DROP 7
C
RAZZAVlLLE
/
/
)/
•
•0-•-•
•oo'•o% • o9•8 UTC •o0
200
•o-
300
3oo•
8-
I.l.i 400 500
/ •oo•
-
•
•_•/
600
-
700 8OO 9OO
100001'22'43'64'86'07'28'49'61•)8120
•
•_1/ _• / /•/ / •/ O--30 -20 -I0 0
TIME(HRS)
•
•• •/ I0
•,
20
/
.
• 30
•oo 800 I000
T (øC)
Figure7. Timeseries ofpressure altitude forselected traiec- •i•, • qt•.... •' !n• ,•.•,•, ......... ,,,•/................. tories arriving at4 km(-635mbar) inlocations (a)1,(b)4, Park,Namibia (0703UTCOctober 14,1992),(b) Lusaka, and(c)7. Zambia (1100UTCOctober 14,1992),and(c) Brazzaville, Congo(0948UTC October13, 1992).No dewpoint datawere available at Etosha.
FUELBERG
ET AL.: METEOROLOGY
OF AEROSOLS OFF WEST AFRICA
stormsare not resolvedby the synoptic-scale ECMWF analyses.Thustrajectoriespassingthroughareasof deep convection are lesslikely to describethe motionsactuallyexperiencedby air parcels. The air at 7-km altitude is relatively free of aerosolsat all locationsalongthe flighttrack (Plate 1). At the five southernmost drop sites,the trajectoriesspendlittle time over Africa during the preceding5 days(Figure 4). Instead, most begin over SouthAmerica and the SouthAtlantic Ocean (e.g.,drops 1 and 4 in Figures9a and 9b). Furthermore,exceptfor deep convectiveprocessesthat can removelarge aerosols,the aerosol-laden burning plumes that do originate over Africa are preventedfrom reachingthis heightby the strongstablelayers at lower levels (Figure 3a). At the northernmostdrop locations, air comprisingthe clusterspendsmore time over Africa (Figure4), althoughmanyparcelsstill originateoverthe ocean (Figure9c).As notedearlier,the numerousstablelayersbelow 7 km will prevent aerosolsfrom being transportedto this higher altitude, and the deep convectionnorth of 10øSprobably reducestheir concentrationaswell.
24,113
-40½.......... i........... •........... '• .... -60
-40
-20
0
-20
20
---'
,
•
-40
-20
40
•--•-
:
;
0
20
-
-40
5.
i
Generality of Findings
-60
4 km 40
It is importantto considerthe generalityof currentfindings. Enhancedaerosolloading off the coastsof Angola and northern Namibia appears to be common during austral spring
-20 ...............
............. '!-- -=':, ............. 'i............. i.......... +................. -40................ [...... ? -100
-80
-60
:.':............. -40
-20
0
20
40
0 ........ ........ .................... 'i............. i............ ................... .............. ...... ¾-
'..................
'
--4-
/
•
-401 ............ j............ r........... •
[
!
-60
-40
i 7km -20
0
20
40
Figure 10. Percentagesof trajectoryhours for daily arrivals between September 27 and October 26, 1992. Calculations were made for grid squaresof 1ø latitude/longitude;25% of residence
time
hours
are contained
within
each
contoured
region. The 5-day backwardtrajectoriesarrive at the 5 x 5 clusterof pointsat altitudesof (a) 1 km, (b) 4 km, and (c) 7 km.
-20 ................. i ......... •:,............................ -•.......... i........
[Garstanget al., this issue].The vertical distributionsof these aerosolswere quite similar on October 14, 15, and 18 (not shown).In addition,the tradewind temperatureinversionnear
-40
1 km and the intense
-1 O0
-80
-60
-40
-20
0
20
40
........ •.......;................. •r .....•' .....';........................... [.............. *,.......... • ....
here were similar
-40
• -100
-80
-60
-40
DROP 7 -20
0
20
40
Figure 9. As in Figure 5, exceptfor arrivalsat 7 km (-435 mbar).
subsidence
inversions
between
5 and 6
km are semipermanentfeaturesof the region [Garstanget al., this issue;Swap et al., this issue]. We examinedthe generalityof trajectoriesendingon October 15by calculatingadditionaltrajectoriesendingon eachday betweenSeptember27 and October 26, 1992, i.e., encompassing most of the TRACE A period. The methodologiesused to those described
in section 4. To facilitate
the displayof results,proceduressimilarto thoseof Poirotand Wishinski[1986] and Merrill [1994] were employed. Specifically,we countedthe numberof hoursspentby the trajectories within grid boxes of 1ø latitude/longitude.Figure 10 shows resultsfor trajectoriesarriving at site 4 at altitudesof 1, 4, and 7 km. The isoplethsdenote percentagesof the total number of trajectoryhours.That is, eachisolineencompasses 25% of the total number of hours.We did not apply the geometricalcor-
24,114
FUELBERG
ET AL.: METEOROLOGY
OF AEROSOLS OFF WEST AFRICA
rection factor utilized by Poirot and Wishinski[1986] and Merrill [1994]. Results for the month-longperiod generallyare similar to thoseof October15. Iseplethsfor arrivalsat 1 km (Figure 10a) are elongatedalong the coastline;however,many trajectories do passover southernAfrica. This was not observedon October 15 (Figure 5b). One shouldrecall that trajectorieswere terminated once they intersected the surface.Most 4-km arrivalsfor the month-longperiod havepassedover southcentral Africa (Figure 10b), and thisis very similarto the situationon October 15 (Figure 6b). Finally, many of the arrivalsat 7 km (Figure10c)haveresidedoverthe SouthAtlanticOcean,similar to findingsof the current case (Figure 9b). One should note, however,that someair parcelsfrom Africa do reach site 4 at 7 km (note the elongationof the 75% isopleth).This only occurredat locationsfarther north on October15 (Figure 9c).
vations,soundingdata, and trajectory calculationswill be necessary to confirm this hypothesis. It is clear that the combinationof DIAL observationsand meteorologicalanalysesis a powerful tool for understandingaerosol distributions and their transport.
6.
References
Summary and Conclusions
Acknowledgments.This researchwas sponsoredby NASA under grant NAGl-1312 from the TroposphericChemistryProgram. We appreciatethe assistance of Jim Hoell and Jack Fishmanof NASA LangleyResearchCenter (LaRC), and ScottBachmeierat Lockheed/ LaRC. Rob Loring and Mark Watson at FSU alsowere very helpful. The dropsondedata were providedby Dean Lauritsenof the National Center for AtmosphericResearch.The soundingsat Etosha were under the supervisionof RoseanneDiab of the Univeristyof NatalDurban. The soundingsat Brazzavillewere collectedby Dominique Nganga.
The TRACE A flight of October 15, 1992, wasjust off the Anderson, B. E., W. B. Grant, G. L. Gregory, E. V. Browell, J. E. CollinsJr., G. W. Sachse,D. R. Bagwell,and C. H. Hudgins,Aerowest coast of southern Africa from 22.5øS to 5.5øS. This is a solsfrom biomassburningover the tropicalSouthAtlantic region: regionof large aerosolloading[e.g.,Garstanget al., thisissue]. Distributionsand impacts,J. Geophys.Res.,this issue. The airborne DIAL instrumentindicatedmajor variationsin Andreae, M. O., et al., Biomassburningemissionsand associatedhaze layersover Amazonia, J. Geophys.Res., 93, 1509-1527, 1988. the vertical distribution of aerosols.The top of the aerosol Bachmeier,S. A., and H. E. Fuelberg,A meteorologicaloverviewof layer ranged from 3.5 to 5.7 kin, while its thicknessranged the Transport and AtmosphericChemistryNear the Equatorfrom 1.4 to 4.5 kin. Greatestaerosolloadinggenerallyoccurred Atlantic (TRACE A) period,J. Geophys. Res.,this issue. near 4.0- to 4.5-km altitude between 8ø and 12øS,where the Bengtsson, L., Medium-rangeforecasting--Theexperience of ECMWF, Bull. Am. Meteorol. Soc., 66, 1133-1146, 1985. aerosollayer was thickest. Browell, E. V., Differential absorptionlidar sensingof ozone,Proc.
Meteorologicalconditionsand air parcel trajectorieswere closely associatedwith the aerosol distributions.Dropsonde data indicated that the southern two thirds of the flight contained strong subsidence-induced inversionsor stable layers above approximately5 km. Although multiple stable layers often were present above5 km, the top of the aerosolregion correspondedto the altitude of the lowest one. This is expected,sincestablelayersinhibit vertical transport.The depth of the aerosol region coincidedwith a layer of near-neutral stability. Trajectory analysesshowedthat the southerntwo thirds of the aerosolregion consistedof parcelsthat had spentconsiderable time over the African continent,where a deep surfacebased mixed layer was prevalent. Altitudes of these parcels were consistentwith those of the stablelayers.The relatively aerosol free air above and below the aerosollayer originated over the South Atlantic
Ocean.
The top of the aerosol region was much lower over the northernmostportionof the flight (approximately3.5 km) than over locationsfurther south.Although air abovethis top still originated over Africa and contained enhancedozone, stable layersin the lower troposphereapparentlypreventedthe aerosolsfrom being transportedto the higher levels.These lower level stablelayerswere not presentfurther south.In addition, most trajectoriesarriving at altitudesabove3.5 km originated over a part of Africa (north of 10øS)where biomassburning was less frequent [Fishmanet al., this issue]and which contained extensivedeep convection. In conclusion,aerosol loading off the west coast of Africa exhibitsstronghorizontaland vertical gradients.The transport of this aerosol-ladenair from Africa is heavily influencedby atmosphericstability. Furthermore, since flow patterns over the region are complex,trajectoriesfor nearbypointscanvary greatly.The resultsfor October 15, 1992, appear to be representativeof australspring.However, additionalaerosolobser-
IEEE, 77, 419-432, 1989. Browell, E. V., Ozone and aerosol measurements with an airborne lidar system,Opt. PhotonicsNews, 8-11, 1991.
Browell, E. V., G. L. Gregory,R. C. Harriss,and V. W. J. H. Kirchoff, Troposphericozone and aerosoldistributionsacrossthe Amazon Basin,J. Geophys.Res., 93, 1431-1451, 1988. Browell, E. V., G. L. Gregory,R. C. Harriss, and V. W. J. H. Kirchoff, Ozone and aerosoldistributionsover the Amazon Basinduringthe wet season,J. Geophys.Res., 95, 16,887-16,901, 1990. Browell, E. V., M. A. Fenn, C. F. Butler, W. B. Grant, R. C. Harriss,
and M. C. Shipham,Ozone and aerosoldistributionsin the summertimetroposphereover Canada,J. Geophys. Res.,99, 1739-1755, 1994.
Browell, E. V., et al., Ozone and aerosol distributions and air mass
characteristicsover the South Atlantic basin during the burning season,J. Geophys.Res.,this issue. Cachier, H., P. Buat-Menard, M. Fontugne, and P. Chesselet,Longrange transportof continentallyderived particulatecarbonin the marine atmosphere:Evidencefrom stablecarbonisotopestudies, Tellus, 38, 161-177, 1986. Chester, R., H. Elderfield, J. J. Griffin, L. R. Johnson, and R. C.
Padgham,Eolian dust along the eastern margins of the Atlantic Ocean, Mar. Geol., 13, 91-105, 1972.
Diab, R. D., M. R. Jury,J. M. Combrink,andF. Sokolic,A comparison of anticycloneand trough influenceson the vertical distributionof ozone and meteorologicalconditionsduring SAFARI 92, J. Geophys.Res., this issue. Fishman, J., J. M. Hoell Jr., R. D. Bendura, V. W. J. H. Kirchoff, and
R. J. McNeal Jr., NASA GTE TRACE A experiment(SeptemberOctober 1992): Overview,J. Geophys.Res.,this issue. Fuelberg, H. E., R. O. Loring Jr., M. V. Watson, M. C. Sinha, K. E. Pickering,A.M. Thompson,G. W. Sachse,D. R. Blake, and M. R. Schoeberl,TRACE A trajectoryintercomparison, 2, Isentropicand kinematicmethods,J. Geophys.Res.,this issue. Garstang,M., P. D. Tyson,R. Swap,M. Edwards,P. Kallberg, and J. A. Lindesay,Horizontalandverticaltransportof air oversouthern Africa, J. Geophys.Res., this issue.
Kahl, J. D., A cautionarynote on the use of air trajectoriesin interpretingatmospheric chemistrymeasurements, Atmos.Environ.,27A, 3037-3038, 1993.
Loring, R. O., Jr., H. E. Fuelberg,J. Fishman,M. V. Watson, and E. V. Browell,Influenceof a middle-latitudecycloneon tropospheric
FUELBERG ET AL.: METEOROLOGY OF AEROSOLS OFF WEST AFRICA ozonedistributions duringa periodof TRACE A, J. Geophys. Res., this issue.
24,115
history associatedwith the summertime aerosol in northern Vermont, Atmos. Environ., 20, 1457-1469, 1986.
Losno,R., G. Bergametti,and P. Carlief, Originsof atmospheric Swap,R., M. Garstang,S. A. Macko, P. D. Tyson,W. Maenhaut, particulate matter over the North Sea and the Atlantic Ocean, J. P. Artaxo,P. Kallberg,and R. Talbot,The long-rangetransportof Atmos. Chem., 15, 333-352, 1992. southernAfricanaerosolsto the tropicalsouthAtlantic,J. Geophys. Res., this issue. Merrill, J. T., Isentropicairflowprobabilityanalysis, J. Geophys. Res., 99, 25,881-25,889, 1994. Van de Hulst, H. C., Light Scattering by SmallParticles,JohnWiley, New York, 1957. Merrill,J. T., R. Bleck,andL. Avila,Modelingatmospheric transport to the Marshall Islands,J. Geophys.Res.,90, 12,927-12,936,1985. von Ficker, H., Die passatinversion, l/eroffenlichungen Meteorol.Inst. NationalCenterfor Atmospheric Research,SSSFobserving facilities: Univ.Berlin,1, 33 pp., 1936. Descriptionand specifications, Version1.0, Surfaceand Sounding Syst.Facility, Boulder, Colo., 1994. E. V. Browell, NASA Langley ResearchCenter, Hampton, VA Parkin, D. W., D. R. Phillips,R. A. L. Sullivan,and L. R. Johnson, Airborne dustcollectionsdownthe Atlantic, Q. J. R. Meteorol.Soc.,
23681.
H. E. Fuelberg,S. P. Longmore,andJ. D. VanAusdall,Department of Meteorology,FloridaStateUniversity,Tallahassee, FL 32306-3034. Pickering,K. E., A.M. Thompson,D. P. McNamara,M. R. Schoeberl, (e-mail:
[email protected]) H. E. Fuelberg,R. O. Loring Jr., M. V. Watson,K. Fakhruzzaman, and A. S. Bachmeier,TRACE A trajectoryintercomparison, 1, Effectsof differentinput analyses, J. Geophys. Res.,this issue. (ReceivedMarch 21, 1995;revisedJuly24, 1995; Poirot, R. L., and P. R. Wishinski,Visibility, sulfateand air mass acceptedJuly 24, 1995.) 98, 798-808, 1972.