Revista Brasileira de Psiquiatria. 2013;35:161–168 ß 2013 Associac¸a˜o Brasileira de Psiquiatria doi:10.1590/1516-4446-2012-0988
ORIGINAL ARTICLE
Mexican immigration to the U.S., the occurrence of violence and the impact of mental disorders Guilherme Borges,1 Claudia Rafful,2 Daniel J. Tancredi,3,4 Naomi Saito,4 Sergio Aguilar-Gaxiola,5 Maria-Elena Medina-Mora,1 Joshua Breslau6 1 Department of Models for Intervention, National Institute of Psychiatry, Mexico City, Mexico. 2Department of Psychiatry, New York State Psychiatric Institute/Columbia University, New York, NY, United States. 3Department of Pediatrics, UC Davis School of Medicine, Sacramento, CA, United States. 4UC Davis Center for Healthcare Policy and Research, Sacramento, CA, United States. 5Department of Internal Medicine, UC Davis School of Medicine, Sacramento, CA, United States. 6RAND Corporation, Pittsburgh, PA, United States.
Objective: To study immigration, U.S. nativity, and return migration as risk factors for violence among people of Mexican origin in the U.S. and Mexico. Methods: Cross-sectional surveys in the United States (2001-2003; n=1,213) and Mexico (20012002; n=2,362). Discrete time survival models were used. The reference group was Mexicans living in Mexico without migrant experience or a migrant relative. Results: Mexican immigrants in the U.S. have lower risk for any violence (hazard ratio [HR] = 0.5, 95% confidence interval [95%CI] 0.4-0.7). U.S.-born Mexican-Americans were at higher risk for violence victimization of a sexual nature (for sexual assault, HR = 2.5, 95%CI 1.7-3.7). Return migrants were at increased risk for being kidnapped or held hostage (HR = 2.8, 95%CI 1.1-7.1). Compared to those without a mental disorder, those with a mental disorder were more likely to suffer any violence (HR = 2.3, 95%CI 1.9-2.7), regardless of the migrant experience. Conclusions: The impact of immigration on the occurrence of violence is more complex than usually believed. Return migrants are more likely to suffer violence such as being held hostage or beaten by someone other than a partner.
Keywords: Immigration; Mexican-American; survey; mental disorder; violence; Hispanic American
Introduction International migration is associated with a broad range of changes in health status and exposure to health risks.1,2 One area of concern is exposure to violence. Prevention of violence is an important public health goal and exposure to violence is a risk factor for a variety of physical and mental health conditions, including posttraumatic stress disorder (PTSD).3-5 The vulnerability of migrants during transit between countries,6-8 both from and to sending countries, and the risks associated with social disadvantage in their destination country9 put this group at a particular risk. Previous studies have focused on exposure to violence in refugee populations.10,11 In these populations, exposures tend to be extremely high, largely due to premigration stresses which were the underlying causes of displacement.12 However, little is known about violence exposures among labor migrants, who comprise the large majority of international migrants in the world today. It is Correspondence: Dr. Guilherme Borges, Departamento de Modelos de Intervencio´n, Direccio´n de Investigaciones Epidemiolo´gicas y Psicosociales, Instituto Nacional de Psiquiatrı´a, Calzada Me´xico Xochimilco no 101, Col. San Lorenzo Huipulco, Me´xico, DF, CP 14370, Mexico. E-mail:
[email protected] Submitted 03 Sep 2012, accepted 04 Dec 2012.
uncertain whether the immigration process is associated with an increase or decrease in all forms of violence.10,13-16 Ongoing connections between immigrants and the families they left behind provide an additional potential mechanism for migration to influence suicidality in the migrant-sending populations,17 but there is no prior research on other forms of intentional violence. This study examines migration and violence in the context of the largest sustained labor migration in the world today, that between Mexico and the United States. Mexico is a society that has witnessed a large increase in violence in recent years18,19 as well as an extraordinary migration movement to the U.S.20 We are especially interested in testing whether immigration would increase the likelihood of a first episode of violence in newcomers, i.e., first-generation immigrants, because of the uncertainty and negative life events that may occur in the migration process12 and settlement into a society where Hispanics in general have a lower socioeconomic status than those of an Anglo ethnicity. On the other hand, we might also expect that with increasing social ties, better jobs, and educational attainment, all forms of violence would decrease in the second generation, that is, among U.S.-born Mexican-Americans. Migration from Mexico to the U.S. has been shown to be associated with large increases in risk for psychiatric disorder,21-23 an established risk factor for exposure to violence,24,25 so that assessment
162
G Borges et al.
of prior psychiatric disorders is needed, though rarely done, when studying the role of immigration on the first onset of violence. In order to test these hypotheses we make use of a unique dataset, which includes assessments of timing of migration, a large list of violence experiences, and a broad range of psychiatric conditions in population samples of the Mexican general population and the U.S population of Mexican origin. Our main goal is to examine the first onset of violence among Mexicans and U.S.-born persons of Mexican origin residing both in Mexico and the U.S. We took advantage of our study design to consider whether the age at migration preceded the age of onset of violence and whether a psychiatric disorder increased the likelihood of suffering violence. Our main hypothesis is that, when compared to Mexicans nationals in Mexico, violence will be higher among Mexican immigrants in the U.S., but lower among U.S.-born persons of Mexican origin. Other comparisons of interest among two understudied groups, the possible increase in violence among return migrants and family of migrants, will also be addressed here.
Methods Sample We combined data on 2,362 participants from the Mexican population who answered questions related to violence from the Mexican National Comorbidity Survey (MNCS)26 with data on 1,213 respondents of Mexicanorigin population in the United States from the closely related Collaborative Psychiatric Epidemiology Surveys (CPES), which included the National Comorbidity Survey Replication (NCS-R) and the National Latino and Asian American Study (NLAAS).27-29 All surveys follow the methodology of the World Health Organization’s World Mental Health Survey Initiative.30 The combined sample is weighted to represent the U.S. Mexican-American population using weights developed for this purpose.27,31 Full data on nativity and age at immigration are available for a total of 3,575 respondents from both the U.S. and Mexico. The response rate for the MNCS was 76.6%, 70.9% for the NCS-R and 75.5% for the Latino sample in the NLAAS.22,23 Study procedures were approved by the Institutional Review Boards of Harvard Medical School, the University of Michigan, and the National Institute of Psychiatry Ramon de la Fuente. Definition of migrant groups We define five mutually exclusive groups representing a range of exposure to the U.S. across this transnational population23: 1) U.S.-born Mexican-American respondents; 2) migrants from Mexico; 3) return migrants living in Mexico after having spent at least 3 months in the U.S. for work or study; 4) non-migrants in Mexico with a migrant among their immediate family members; and 5) non-migrants in Mexico with no migrant in their family. The first two groups are from the CPES population and the last three groups from the MNCS population. Rev Bras Psiquiatr. 2013;35(2)
Assessment of violence The World Mental Health version of the Composite International Diagnostic Interview (WMH-CIDI)32 measures 21 different lifetime traumatic events, out of which eight types were considered here as violence-victimization: ever been kidnapped or held hostage; ever been badly beaten by parents; ever been badly beaten up by spouse or romantic partner; ever been beaten up by anyone else; ever been mugged, held up, or threatened with a weapon; ever been raped; ever been sexually assaulted (other than rape); and ever been stalked. We studied here only the first episode of these traumatic events. Assessment of other covariates Analyses also used sociodemographic information collected in the WMH-CIDI on gender, age, marital status, education, and DSM-IV psychiatric disorders, categorized as any mood disorder (major depressive disorder and dysthymia) and any anxiety disorder (panic disorder, agoraphobia without panic disorder, social phobia, generalized anxiety disorder and PTSD), any substance use disorders (alcohol abuse, drug abuse, alcohol dependence with abuse, and drug dependence with abuse), and conduct disorder. A term for any mental disorder was added as a control variable in all models that estimated the risk of violence for the five migration groups. Given the importance of mental disorder as a possible risk factor by itself, we included the estimates for this term in the final models presented below. This term represents the risk of suffering violence (any violence and by type) for those with a mental disorder compared to those without a mental disorder, and it is adjusted for the migration groups. Statistical analysis We used a design-based statistical analysis strategy for point and variance estimates and hypothesis testing, using standard survey data analysis procedures to account for design effects arising from the use of stratification, clustering and unequal selection probabilities in the component surveys.33 We used weights developed by CPES biostatisticians34 for use in designbased analyses that combine the NCS-R and NLAAS to estimate that a total 15.76 million Mexican Americans were in the U.S. sampling frame.34 The Mexican sampling frame does not overlap with the U.S. sampling frame, so in the combined sample we treated each frame as separate domains for purposes of design-based variance estimation.33,35 Hence, we calibrated the MNCS weights to represent 40.6 million individuals, based on the estimated number of 18 to 65 years old lived in households in towns . 2,500 inhabitants in the Mexican Census of the Populations and Households, 2000.36 We used a discrete-time event history analysis with time-varying covariates, implemented using a discrete proportional hazards regression model on a dataset with
Mexican immigration and violence
person-years as the units of analysis,37-39 to study variation in risk of first onset of violence across the five migration groups defined above while statistically adjusting for covariates. The main outcomes that we studied were lifetime violence-victimization (any and by type of violence). The key predictor is immigration group, in five categories. The person-years analyses allow us to take account of the temporal ordering of migration, onset of psychiatric disorders, and first occurrence of violence of specific types38 and to use design-based estimation methods to account for survey design effects.33 Our use of discrete time event history analyses38 relied on retrospective age-at-onset reports to establish a temporal order between the predictors and the outcomes. Designbased standard errors for logistic regression coefficients and for pairwise contrasts between them were estimated using the Taylor linearization method40 with SUDAAN version 10.0141 and were used in Wald tests for statistical significance and for producing 95% confidence intervals (95%CI) for adjusted hazard ratios.
163
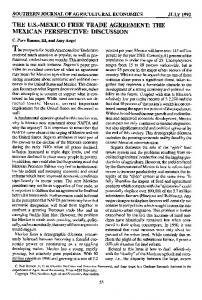
(45.5%) compared to females (41.6%), but large differences in the prevalence by type of violence experienced were found for male and female groups. Among males, being mugged, held up, or threatened with a weapon and being badly beaten up by anyone else was much more common than among females, who were in turn more likely to experience being beaten up by a spouse or romantic partner and violence of a sexual nature. We present a survival curve of one of the most common outcomes with a middle and early-age of initial victimization, i.e., rape (Figure 1), for which an unexpected result was found. Here, the U.S. born group was the most affected, followed by the Mexican population and the current migrants in the U.S. (with current immigrants showing rape rates that followed those of U.S.-born among females, data not shown). Considering all violence types together among current immigrants, most events (60.9%) occurred before migration, especially because most cases of being beaten by parents and being raped occurred while in Mexico (Table 3). On the other hand, most of the violence from being kidnapped, beaten up by a partner, threatened with a weapon and stalked happened after immigration. Table 4 presents the results of survival models that estimate differences in risk for violence across immigration groups, adjusted for sex, age and any mental disorder, for the total population and separately for males and females. The variable any mental disorder was introduced in this multiple regression equation as a time-varying dummy variable, in which those without a mental disorder are the reference group. Marital status and education were also considered as possible confounders, but did not affect the estimates for migration groups and psychiatric disorders and were dropped from the final model for simplicity and to obtain more stable estimates. The reference group for all comparisons was the Mexican population living in Mexico without migrant experience or a migrant relative. A similar model was also fitted separately by sex and we tested for the presence of interactions. In two instances we could not fit an interaction term (for ever badly beaten up by spouse or romantic partner and for ever raped, neither of which had occurred to males in some of the immigrant categories) and in all other instances no significant interaction term was found. We therefore focus here on the results for the total sample.
Results While the families of migrants and the Mexicans living in Mexico without a migrant experience or a migrant relative (Mexican population for short) have larger proportions of females than males, the opposite is true for the other three groups, especially the return migrants (Table 1). The U.S.-born population has the largest proportion of respondents in the older group, while the families of migrants and the Mexican population tend to be much younger and the current migrants are more concentrated in the middle years. Table 2 shows the lifetime prevalence of any violence and violence by type, for the total population and separately for males and females. Starting with the total, about 43.6% reported any experience of violence, with the highest prevalence of any violence found among the return migrants (51.7%) and the lowest among the current immigrants from Mexico (31.8%), with the Mexican population in the middle (41.6%). In all groups, the most common experience was ever mugged, held up or threatened with a weapon, and in most groups, the least common was ever kidnapped or held hostage. Males were only slightly more likely to report any violence
Table 1 Population characteristics by migrant groups (Mexican sample from the MNCS-CPES, n=3,575), n (%)
Sex* Male Female Age* 18-25 26-35 36-45 46-89
U.S. born with Mexican descent (n=659)
Migrant in U.S. (n=554)
Return migrant (n=137)
Family migrant (n=1,058)
No family migrant (n=1,167)
Total (n=3,575)
282 (52.8) 377 (47.2)
259 (54.2) 295 (45.8)
96 (77.9) 41 (22.2)
361 (45.5) 697 (54.6)
396 (46.1) 771 (53.9)
1,394 (49.3) 2,181 (50.7)
201 159 131 168
105 231 117 101
23 37 39 38
309 286 235 228
307 290 259 311
945 (28.7) 1,003 (27.0) 781 (21.7) 546 (22.7)
(32.6) (19.5) (18.9) (29.0)
(20.0) (38.7) (23.1) (18.2)
(19.5) (28.6) (27.2) (24.7)
(31.6) (28.1) (21.7) (18.7)
(28.9) (24.7) (21.6) (24.7)
MNCS = Mexican National Comorbidity Survey; CPES = Collaborative Psychiatric Epidemiology Surveys. Weighted percentages. * Significance at p , 0.001. Rev Bras Psiquiatr. 2013;35(2)
164
G Borges et al.
Table 2 Prevalence of assaultive violence by migration groups and sex (Mexican sample from the MNCS-CPES, n=3,575), n (%) U.S. born with Mexican descent (n=659) Total Any assaultive violence Ever kidnapped or held hostage Ever badly beaten by parents Ever badly beaten up by spouse or romantic partner Ever badly beaten up by anyone else Ever mugged, held up, or threatened with a weapon Ever raped Ever sexually assaulted other than rape Ever been stalked Males Any assaultive violence Ever kidnapped or held hostage Ever badly beaten by parents Ever badly beaten up by spouse or romantic partner Ever badly beaten up by anyone else Ever mugged, held up, or threatened with a weapon Ever raped Ever sexually assaulted other than rape Ever been stalked Females Any assaultive violence Ever kidnapped or held hostage Ever badly beaten by parents Ever badly beaten up by spouse or romantic partner Ever badly beaten up by anyone else Ever mugged, held up, or threatened with a weapon Ever raped Ever sexually assaulted other than rape Ever been stalked
Migrant in U.S. (n=554)
Return migrant (n=137)
Family migrant (n=1,058)
No family migrant (n=1,167)
Total (n=3,575)
342 7 52 78 77 147 88 118 75
(46.2) (1.0) (6.6) (9.8) (11.4) (22.9) (9.0) (12.6) (8.8)
188 7 72 37 35 83 22 30 39
(31.8) (1.1) (12.8) (5.5) (6.2) (14.8) (3.9) (4.4) (5.9)
88 12 32 5 24 65 4 7 3
(51.7) (4.9) (19.5) (0.6) (16.3) (39.2) (2.0) (1.7) (0.7)
584 34 292 107 97 291 75 98 71
(48.7) (3.0) (21.7) (5.1) (7.9) (25.7) (3.6) (6.2) (4.0)
593 16 260 142 81 284 82 105 63
(41.6) (1.2) (15.4) (7.4) (6.0) (22.1) (4.5) (5.3) (3.7)
1,795 76 708 369 314 870 271 358 251
(43.6) (1.9) (15.8) (6.5) (7.9) (23.1) (4.7) (6.4) (4.7)
138 3 21 4 57 101 13 16 13
(43.1) (1.2) (6.9) (1.3) (17.8) (32.7) (3.8) (3.4) (3.5)
92 5 34 4 26 56 2 6 11
(33.5) (1.5) (13.6) (1.7) (9.5) (19.5) (0.7) (2.4) (4.1)
64 11 20 0 21 53 1 2 2
(53.7) (6.1) (18.8) (0.0) (19.7) (43.1) (1.9) (0.8) (0.8)
222 20 99 3 57 156 7 11 12
(54.3) (4.9) (22.2) (0.4) (12.5) (38.6) (1.3) (1.3) (2.3)
209 12 86 8 49 151 10 9 10
(43.1) (2.4) (15.0) (1.3) (10.3) (30.5) (1.2) (1.3) (1.4)
725 51 260 19 210 517 33 44 48
(45.5) (3.0) (15.8) (1.0) (12.6) (32.3) (1.6) (1.7) (2.3)
204 4 31 74 20 46 75 102 62
(49.7) (0.8) (6.3) (19.3) (4.4) (11.9) (14.8) (22.8) (14.7)
96 2 38 33 9 27 20 24 28
(29.7) (0.6) (11.9) (10.0) (2.3) (9.2) (7.6) (6.9) (8.2)
24 1 12 5 3 12 3 5 1
(44.8) (0.8) (22.1) (2.7) (4.3) (25.3) (2.2) (4.8) (0.4)
362 14 193 104 40 135 68 87 59
(44.1) (1.4) (21.4) (9.0) (4.1) (15.0) (5.5) (10.3) (5.5)
384 4 174 134 32 133 72 96 53
(40.3) (0.1) (15.8) (12.6) (2.4) (15.0) (7.3) (8.7) (5.7)
1,070 25 448 350 104 353 238 314 203
(41.6) (0.7) (15.9) (11.8) (3.2) (14.0) (7.7) (10.9) (7.1)
MNCS = Mexican National Comorbidity Survey; CPES = Collaborative Psychiatric Epidemiology Surveys. Weighted percentages.
Figure 1 Survival function of ever been raped according to migration status in the MNCS-CPES, 2001-2003. MNCS = Mexican National Comorbidity Survey; CPES = Collaborative Psychiatric Epidemiology Surveys. Rev Bras Psiquiatr. 2013;35(2)
Mexican immigration and violence
165
Table 3 Prevalence of assaultive violence in Mexican migrants in the U.S. by history of migration (Mexican sample from the MNCS-CPES, n=3,575), n (%) Migrants in the U.S. (n=554) Before migration Any assaultive violence Ever kidnapped or held hostage Ever badly beaten by parents Ever badly beaten up by spouse or romantic partner Ever badly beaten up by anyone else Ever mugged, held up, or threatened with a weapon Ever raped Ever sexually assaulted other than rape Ever been stalked
105 1 57 10 17 18 15 15 14
(60.9) (11.9) (89.6) (28.3) (48.3) (25.0) (73.2) (44.2) (36.6)
Same year 10 0 2 2 1 8 2 4 1
After migration
(5.5) (0.0) (2.4) (7.4) (2.5) (12.0) (11.2) (9.1) (2.2)
70 6 7 23 17 57 4 11 24
(33.5) (88.0) (8.0) (64.2) (49.2) (62.9) (15.5) (46.7) (61.1)
MNCS = Mexican National Comorbidity Survey; CPES = Collaborative Psychiatric Epidemiology Surveys. Weighted percentages.
Table 4 Hazard ratio of assaultive violence by migration and sex (Mexican sample from the MNCS-CPES, n=3,575), HR (95%CI) U.S. born with Mexican descent Migrant in U.S. Return migrant (n=659) (n=554) (n=137) Total Any assaultive violence Ever kidnapped or held hostage Ever badly beaten by parents Ever badly beaten up by spouse or romantic partner Ever badly beaten up by anyone else Ever mugged, held up, or threatened with a weapon Ever raped Ever sexually assaulted other than rape Ever been stalked Males Any assaultive violence Ever kidnapped or held hostage Ever badly beaten by parents Ever badly beaten up by spouse or romantic partner Ever badly beaten up by anyone else Ever mugged, held up, or threatened with a weapon Ever raped Ever sexually assaulted other than rape Ever been stalked Females Any assaultive violence Ever kidnapped or held hostage Ever badly beaten by parents Ever badly beaten up by spouse or romantic partner Ever badly beaten up by anyone else Ever mugged, held up, or threatened with a weapon Ever raped Ever sexually assaulted other than rape Ever been stalked
Family migrant (n=1,058)
Any disorder
1.1 (0.9-1.4) 0.8 (0.3-2.5) 0.4 (0.3-0.7)* 2.0 (1.3-3.0)*
0.5 (0.4-0.7)* 1.1 (0.4-2.9) 0.5 (0.2-1.1) 0.7 (0.4-1.3)
1.3 (0.9-1.9) 2.8 (1.1-7.1)* 1.3 (0.7-2.1) 0.2 (0.1-0.4)*
1.2 (1.0-1.4) 2.4 (0.9-5.9) 1.3 (1.1-1.7)* 0.7 (0.5-1.0)
2.3 2.9 2.1 2.8
(1.9-2.7)* (1.5-5.4)* (1.3-3.3)* (2.2-3.7)*
1.8 (1.2-2.6)* 0.8 (0.6-1.1)
1.0 (0.5-2.0) 0.5 (0.4-0.7)*
2.0 (1.2-3.3)* 1.5 (1.0-2.3)
1.3 (0.9-2.1) 1.2 (0.9-1.5)
3.9 (2.8-5.4)* 1.8 (1.4-2.2)*
2.4 (1.6-3.6)* 2.5 (1.7-3.7)* 1.9 (1.3-2.9)*
0.5 (0.2-1.2) 1.1 (0.5-2.5) 1.6 (0.9-2.8)
0.7 (0.1-3.9) 0.6 (0.2-1.5) 0.3 (0.1-1.1)
0.9 (0.6-1.4) 1.1 (0.7-1.7) 1.2 (0.8-1.8)
2.5 (1.7-3.8)* 3.3 (2.2-4.9)* 2.8 (1.8-4.4)*
1.0 (0.7-1.4) 0.6 (0.1-2.5) 0.5 (0.2-0.9)* 1.2 (0.2-6.6)
0.5 (0.4-0.8)* 0.7 (0.3-2.0) 0.7 (0.3-1.7) 1.5 (0.3-8.3)
1.4 (0.9-2.2) 2.3 (0.9-5.8)* 1.2 (0.6-2.4) 0
1.3 1.9 1.4 0.3
(1.0-1.7) (0.7-5.3) (0.9-2.0) (0.1-1.3)
2.4 (1.9-3.1)* 2.9 (1.4-6.1)* 1.9 (1.0-3.5) 2.6 (0.6-11.0)
1.8 (1.1-2.9)* 1.1 (0.7-1.5)
0.9 (0.5-1.8) 0.5 (0.3-0.7)*
2.0 (1.2-3.4)* 1.5 (0.9-2.5)
1.2 (0.7-2.1) 1.3 (1.0-1.7)
3.5 (2.5-4.9)* 1.8 (1.4-2.3)*
3.0 (1.1-8.8)* 1.9 (0.7-5.2) 2.0 (0.6-6.4)
0 3.8 (0.9-15.8) 3.4 (1.2-9.7)*
1.5 (0.2-13.3) 0.6 (0.1-2.8) 0.5 (0.1-3.3)
1.0 (0.3-3.1) 0.8 (0.3-2.2) 1.7 (0.5-5.9)
2.7 (0.6-11.8) 12.8 (5.4-30.1)* 4.2 (1.8-9.5)*
1.3 (1.0-1.7) 4.5 (0.8-26.0) 0.4 (0.2-0.7)* 2.0 (1.3-3.1)*
0.5 (0.3-0.8)* 9.0 (1.1-73.6)* 0.3 (0.1-1.0) 0.6 (0.4-1.0)
1.1 (0.6-2.1) 6.1 (0.5-72.6) 1.5 (0.7-3.4) 0.2 (0.1-0.6)*
1.1 (0.9-1.4) 9.5 (1.9-47.2)* 1.3 (1.0-1.7) 0.7 (0.5-1.0)
2.0 (1.6-2.4)* 2.6 (0.8-8.4) 2.2 (1.2-4.1)* 2.9 (2.2-3.8)*
1.8 (0.7-5.1) 0.4 (0.3-0.8)*
1.2 (0.3-5.6) 0.5 (0.3-0.7)*
1.8 (0.4-9.2) 1.5 (0.6-3.6)
1.7 (0.7-3.9) 0.9 (0.6-1.3)
5.1 (2.6-10.3)* 1.7 (1.2-2.3)*
2.3 (1.4-3.7)* 2.6 (1.8-3.9)* 2.0 (1.3-3.1)*
0.6 (0.2-1.4) 0.8 (0.4-1.8) 1.1 (0.6-2.2)
0.3 (0.1-1.4) 0.6 (0.2-1.9) 0.1 0.0-0.4)*
0.9 (0.5-1.4) 1.1 (0.7-1.8) 1.1 (0.7-1.6)
2.5 (1.7-3.7)* 2.7 (1.8-4.1)* 2.4 (1.5-3.8)*
MNCS = Mexican National Comorbidity Survey; CPES = Collaborative Psychiatric Epidemiology Surveys. 95%CI = 95% confidence intervals; HR = hazard ratio. Survival model controlled by person-year, sex, age, education, marital status and any mental disorder. Reference group for migration status is No family of migrant (n=1,167). The reference group for any mental disorder is no mental disorder. Migrants in the U.S. includes ONLY person-time AFTER migration. * Significance at p , 0.001.
Few differences were found for any violence across groups, with current immigrants in the U.S. showing a hazard ratio of 0.5 (0.4-0.7) compared to the Mexican
population. No group of immigrants showed consistently increased or consistently decreased risk for all types of violence, but a combination of increased and decreased Rev Bras Psiquiatr. 2013;35(2)
166
G Borges et al.
risks. The U.S. born had increased risk for all violence of sexual nature, but was less likely to suffer from being beaten by parents. Immigrants currently in the U.S. were less likely to report ever mugged, held up or threatened with a weapon and being beaten by parents. The return migrants were less likely to be beaten up by a romantic partner, but more likely to suffer from being held hostage and for being beaten by anyone else. The families of migrants were more likely to have ever been beaten by parents, but less likely to have ever been beaten up by a romantic partner. In all models from Table 4, a term for any mental disorder was introduced and was associated with higher risk of any violence with a hazard ratio of 2.3 (1.9-2.7) for the total population. For the total population, those with a mental disorder also had higher risk for all specific types of violence, with odds ratios ranging from 1.8 (1.4-2.2) for the risk of ever mugged, held up or threatened with a weapon to 3.9 (2.8-5.4) for badly beaten up by anyone else.
Discussion We found violence to be quite common among this population, in both males and females, but with some important differences in the type of violence by sex. Secondly, although violence was associated with immigration, the nature of this association varied across the specific type of violence. Contrary to our expectations, exposure to violence tended to be lower rather than higher among the current immigrant group and higher rather than lower among the U.S. born of Mexican origin. Third, we found that having a mental disorder was a predictor of exposure to violence victimization throughout this population. Our overall prevalence (43.6%) for violence was much higher than the one reported in a large metropolitan U.S. city3 (37.7%) or the prevalences reported recently for five ethnic groups in the U.S. population, which ranged from 16.3 to 29.3%.13 An analysis of more specific types of violence reported by other surveys24,42-44 also suggest higher prevalences in our survey, with one exception.42 The U.S. born in our sample reported a higher prevalence of rape than those of previous American surveys,24,43 including the Hispanic population in Roberts et al.13 The reasons for such high prevalence are not immediately apparent, but differences in survey methodologies, definitions of violence, location of surveys, and timing of inquiry should also be considered. We did not corroborate our main hypothesis that identified current immigrants in the U.S. as the group most prone to suffer violence. In fact, our findings suggest that current Mexican immigrants in the U.S. are less affected by all sorts of violent acts, especially those that in Mexico are common during early childhood (child maltreatment) and the middle years (mugged, held up, or threatened with a weapon); at the same time, they are unlikely to have experienced sexual violence, which becomes surprisingly common among the second generation of Mexican-Americans. Though surprising, this finding is consistent with those from a study of a diverse Rev Bras Psiquiatr. 2013;35(2)
Hispanic sample in South Florida.45 The experience of violence among the Mexican immigrant groups, pre- and post-migration, has been linked to their rates of substance use in the U.S.,45,46 suggesting that lower levels of traumatic experience among immigrant females of Mexican origin may be related to the low prevalence of substance use disorders in this group. An analysis of the possible impact of the immigration experience on disorders such as depression22 or substance use,23 controlling for specific types of violence, is beyond the scope of the present paper, but clearly a promising avenue for future research. Our second hypothesis, that U.S.-born respondents of Mexican origin would have lower rates of violence when compared to Mexican nationals in Mexico, was only corroborated for being a victim of parental violence. Five of eight forms of violence were increased among this group. One of the most surprising results of our survey was the high risk for violence of a sexual nature among the U.S.-born of Mexican origin. It is interesting that national results13 suggest that Hispanics have lower rates of unwanted sex compared to Whites, and we add now that secondgeneration Mexicans may be approaching the rates seen among Whites, with consequences for the future occurrence of PTSD, among other mental consequences of victimization. The reasons associated with this increase in such an extreme form of violence in the second generation are unknown, and we can only speculate on such causes at this moment. A driving idea among Mexican nationals is that immigration to the U.S. will bring a better standard of living and a more secure environment for those settling in the U.S. Our results do not coincide wholly with this idea, as those settling in the U.S. may be at greater risk than Mexicans in Mexico. Those immigrants that return to their home country and the families that the immigrants leave back home are traditionally understudied groups in migration and mental health research, because data from sending countries are necessary but seldom available. The lack of other studies focusing on these groups precludes comparison of our results, but we can nevertheless point to main findings and avenues for future work. Return migrants in Mexico are a vulnerable group for victimization such as kidnapping and being beaten, as we showed here, and this should be a great concern to Mexican public health authorities and those responsible for violent crimes in the country. The perception that those immigrants are, by Mexican standards, a wealthy group that brings with them financial resources after a life of hard work in the U.S. may put this group at high risk of being targeted by organized crime, as their high rate of being beaten by a stranger also suggests. We also showed that the relatives of migrants are more likely to show violence to their children, and that this violence itself may be related to the migration process when deciding within the family which of its members will emigrate.47 The dynamics of these families and the decision process that culminates in choosing the family member that will migrate are usually seen solely as an economic process, but subjective reasons are also at play, as this work has shown.
Mexican immigration and violence
It is well known that the occurrence of violence may lead to PTSD3 and other forms of psychopathology,42,48 such as depression,49 substance abuse,50 and suicidality,51 and violent events such as rape and sexual abuse may also impact an array of mental disorders.52 On the other hand, serious mental disorders have been shown to increase the risk for violent victimization, such as that studied here.53 Other more common forms of psychopathology, such as drug use disorders, are associated with lifestyles that may put someone at increased risk of suffering from violence such as being beaten up or threatened with a weapon,49,54 and alcohol use and alcohol use disorders are associated with all sorts of accidents and violence-related death.55,56 Our results somehow extend the findings from Hiday54 on victimization among persons with serious mental disorders such as psychosis, but are unique in that we used a large series of other, more common mental disorders. These disorders are not usually thought to be associated with increased personal vulnerability, but we showed that they are related to most forms of victimization when taking into account whether the disorder precedes the occurrence of violence. Models to explain why psychopathology may be related to violence are complex,57 and digging into the specific link between each disorder and the occurrence of each form of violence is beyond the scope of this paper, but our results clearly show that mental disorders may have a broad negative consequence for this population. Monitoring the safety of patients with these common mental disorders should also be an important task in clinical settings and among professionals dealing with their re-insertion into the community. The limitations of this survey are worth mentioning. First, these analyses used data on retrospectively reported ages of first occurrence of experiences of violence that are subject to recall error, which probably means that the results we report are conservative. Multiple episodes of violence, sometimes referred to as chronic violence, are not covered in this report. Second, retrospective data on the exact ages at immigration and return migration are lacking in the MNCS, which limited our ability to more fully model the relative timing of outcomes and exposure in these subgroups. Third, the MNCS sampling frame did not include the most rural parts of the country, which lessens the representativeness of the MNCS target population for the entire source population of Mexican immigrants to the U.S., limiting our ability to control for pre-migration factors. Fourth, despite using the same diagnostic interview, both surveys differed in several ways, including the auspices of the survey. We cannot rule out the possibility that these methodological differences contributed to the observed differences in prevalence estimates of violence in the CPES compared to the MNCS. A special concern is the report of sexual-related violence and whether females in Mexico would experience and report some less extreme forms of sexual aggressions and coercions as violence against themselves. The fact that forms of severe violence, including rape, that are equally prosecuted in Mexico and the U.S. are still more reported among the
167
U.S.-born lead us to believe that differential reporting of less extreme forms of sexual violence, if present, should not account for all of our findings here. Finally, Mexican migration to the U.S. is driven by economic reasons and the search for a better standard of living, and whether our results could be applied to other samples of migrants, homeless, and displaced persons is a matter for further studies. Despite these limitations, we found that the impact of immigration on the occurrence of violence is more complex than usually believed, with differences across migration groups varying across different types of violence. Each migration group should be targeted for specific interventions for reducing specific forms of violence, but, at the same time, all members of this population with a prior mental disorder should be a focus of interventions.
Acknowledgments This study was funded by NIMH grant no. R01 MH082023 (J. Breslau, PI).
Disclosure The authors report no conflicts of interest.
References 1 Abraido-Lanza AF, Armbrister AN, Florez KR, Aguirre AN. Toward a theory-driven model of acculturation in public health research. Am J Public Health. 2006;96:1342-6. 2 Santelli JS, Abraido-Lanza AF, Melnikas AJ. Migration, acculturation, and sexual and reproductive health of Latino adolescents. J Adolesc Health. 2009;44:3-4. 3 Breslau N, Kessler RC, Chilcoat HD, Schultz LR, Davis GC, Andreski P. Trauma and posttraumatic stress disorder in the community: the 1996 Detroit Area Survey of Trauma. Arch Gen Psychiatry. 1998;55:626-32. 4 Rosenberg ML, Fenley MA. Violence in America: a public health approach. New York: Oxford University Press; 1991. 5 Breslau N, Chilcoat HD, Kessler RC, Davis GC. Previous exposure to trauma and PTSD effects of subsequent trauma: results from the Detroit Area Survey of Trauma. Am J Psychiatry. 1999;156:902-7. 6 Fortuna LR, Porche MV, Alegria M. Political violence, psychosocial trauma, and the context of mental health services use among immigrant Latinos in the United States. Ethn Health. 2008;13:435-63. 7 Hatch SL, Dohrenwend BP. Distribution of traumatic and other stressful life events by race/ethnicity, gender, SES and age: a review of the research. Am J Community Psychol. 2007;40:313-32. 8 Ngo HM, Le TN. Stressful life events, culture, and violence. J Immigr Minor Health. 2007;9:75-84. 9 Sampson RJ, Morenoff JD, Raudenbush S. Social anatomy of racial and ethnic disparities in violence. Am J Public Health. 2005;95:22432. 10 World Health Organization. World report on violence and health [Internet]. 2002 [cited 2013 May 28]. http://whqlibdoc.who.int/ publications/2002/9241545615_eng.pdf 11 Bhugra D, Gupta S, Bhui K, Craig T, Dogra N, Ingleby JD, et al. WPA guidance on mental health and mental health care in migrants. World Psychiatry. 2011;10:2-10. 12 Bhugra D. Migration and mental health. Acta Psychiatr Scand. 2004;109:243-58. 13 Roberts AL, Gilman SE, Breslau J, Breslau N, Koenen KC. Race/ ethnic differences in exposure to traumatic events, development of post-traumatic stress disorder, and treatment-seeking for postRev Bras Psiquiatr. 2013;35(2)
168
G Borges et al.
14 15
16
17
18
19
20
21 22
23
24
25
26
27
28
29
30
31
32
33 34
35
traumatic stress disorders in the United States. Psychol Med. 2011;41:71-83. Ferrari AM. The impact of culture upon child rearing practices and definitions of maltreatment. Child Abuse Negl. 2002;26:793-813. Hepburn L, Miller M, Azrael D, Hemenway D. The US gun stock: results from the 2004 national firearms survey. Inj Prev. 2007;13:159. Ilgen MA, Zivin K, McCammon RJ, Valenstein M. Mental illness, previous suicidality, and access to guns in the United States. Psychiatr Serv. 2008;59:198-200. Borges G, Breslau J, Su M, Miller M, Medina-Mora ME, AguilarGaxiola S. Immigration and suicidal behavior among Mexicans and Mexican-Americans. Am J Public Health. 2009;99:728-33. Escalante F. Nexos en lı´nea [Internet]. Homicidios 1990-2007. 2009 Sep 1 [cited 2013 May 28]. http://www.nexos.com.mx/?P= leerarticulo&Article=776 Escalante F. Nexos en lı´nea [Internet]. Homicidios 2008-2009. La muerte tiene permiso. 2011 Jan 3 [cited 2013 May 28]. http://www. nexos.com.mx/?P=leerarticulo&Article=1943189 United States Census Bureau. Geographical Mobility/Migration [Internet]. Geographical mobility: 2007 to 2008. 2009 [cited 2013 May 28]. http://www.census.gov/hhes/migration/data/cps/cps2008. html Breslau N. The epidemiology of trauma, PTSD, and other posttrauma disorders. Trauma Violence Abuse. 2009;10:198-210. Breslau J, Borges G, Tancredi D, Saito N, Kravitz R, Hinton L, et al. Migration from Mexico to the US and subsequent risk for depressive and anxiety disorders: a cross-national study. Arch Gen Psychiatry. 2011;68:428-33. Borges G, Breslau J, Orozco R, Tancredi DJ, Anderson H, AguilarGaxiola S, et al. A cross-national study on Mexico-US migration, substance use and substance use disorders. Drug Alcohol Depend. 2011;117:16-23. Kessler RC, Sonnega A, Bromet E, Hughes M, Nelson CB. Posttraumatic stress disorder in the National Comorbidity Survey. Arch Gen Psychiatry.1995;52:1048-60. Darves-Bornoz JM, Alonso J, de Girolamo G, de Graaf R, Haro JM, Kovess-Masfety V, et al. Main traumatic events in Europe: PTSD in the European study of the epidemiology of mental disorders survey. J Trauma Stress. 2008;21:455-62. Medina-Mora ME, Borges G, Lara C, Benjet C, Blanco J, Fleiz C, et al. Prevalencia de trastornos mentales y uso de servicios: resultados de la Encuesta Nacional de Epidemiologı´a Psiquia´trica en Me´xico. Salud Ment (Mex). 2003;26:1-16. Heeringa S, Wagner J, Torres M, Duan N, Adams T, Berglund P. Sample designs and sampling methods for the Collaborative Psychiatric Epidemiology Studies (CPES). Int J Methods Psychiatr Res. 2004;13:221-40. Kessler RC, Merikangas KR. The National Comorbidity Survey Replication (NCS-R): background and aims. Int J Methods Psychiatr Res. 2004;13:60-8. Alegria M, Takeuchi D, Canino G, Duan N, Shrout PE, Meng XL, et al. Considering context, place and culture: the National Latino and Asian American Study. Int J Methods Psychiatr Res. 2004;13:20820. Kessler RC, Haro JM, Heeringa SG, Pennell BE, Ustu¨n TB. The World Heatlh Organization World Mental Health Survey Initiative. Epidemiol Psichiatr Soc. 2006;15:161-6. Heeringa S, Berglund PA. Integrated weights and sampling error codes for design based analysis. In: National Institutes of Mental Health Collaborative Psychiatric Epidemiology Survey Program Data Set. User Guide. ICPSR; Ann Arbor: 2007. Kessler RC, Ustu¨n TB. The World Mental Health (WMH) Survey initiative version of the World Health Organization (WHO) Composite International Diagnostic Interview (CIDI). Int J Methods Psychiatr Res. 2004;13:93-121. Korn EL, Graubard BI. Analysis of health surveys. New York: Wiley Interscience; 1999. National Institute of Mental Health. Collaborative Psychiatric Epidemiology Surveys [Internet]. 2010 [cited 2013 May 28]. http:// www.icpsr.umich.edu/icpsrweb/CPES/ Kish L. Cumulating/combining population surveys. Surv Methodol. 1999;25:129-3.
Rev Bras Psiquiatr. 2013;35(2)
36 Instituto Nacional de Estadı´stica y Geografı´a (INEGI). Censo general de poblacion y vivienda 2000 [Internet]. Conjunto de datos: poblacio´n en hogares y sus viviendas. 2000 [cited 2013 May 28]. http://www.inegi.org.mx/sistemas/olap/Proyectos/bd/censos/cpv2000/ Pobladores.asp?s=est&c=10260&proy=cpv00_phv 37 Efron B. Logistic regression, survival analysis, and the Kaplan-Meier curve. J Am Stat Assoc. 1988;83:414-25. 38 Willett JB, Singer JD. Investigating onset, cessation, relapse, and recovery: why you should, and how you can, use discrete-time survival analysis to examine event occurrence. J Consult Clin Psychol. 1993;61:952-64. 39 Chambless LE, Boyle KE. Maximum-likelihood methods for complex sample data- logistic-regression and discrete proportional hazards models. Commun Stat Theory Methods. 1985;14:1377-92. 40 Binder DA. On the variances of asymptotically normal estimators from complex surveys. Int Stat Rev. 1983;51:279-92. 41 Research Triangle Institute. SUDAAN Release 8.0.1. North Carolina: Research Triangle Institute; 2002. 42 Turner RJ, Lloyd DA. Stress burden and the lifetime incidence of psychiatric disorder in young adults: racial and ethnic contrasts. Arch Gen Psychiatry. 2004;61:481-8. 43 Breslau N, Peterson EL, Poisson LM, Schultz LR, Lucia VC. Estimating post-traumatic stress disorder in the community: lifetime perspective and the impact of typical traumatic events. Psychol Med. 2004;34:889-98. 44 Zlotnick C, Johnson J, Kohn R, Vicente B, Rioseco P, Saldivia S. Epidemiology of trauma, post-traumatic stress disorder (PTSD) and co-morbid disorders in Chile. Psychol Med. 2006;36:1523-33. 45 Turner RJ, Lloyd DA, Taylor J. Stress burden, drug dependence and the nativity paradox among US Hispanics. Drug Alcohol Depend. 2006;83:79-89. 46 Vega WA, Canino G, Zhun C, Alegria M. Prevalence and correlates of dual diagnoses in US Latinos. Drug Alcohol Depend. 2009;100:328. 47 Breslau J, Borges G, Tancredi DJ, Saito N, Anderson H, Kravitz R, et al. Health selection among migrants from Mexico to the U.S.: childhood predictors of adult physical and mental health. Public Health Rep. 2011;126:361-70. 48 Hossain M, Zimmerman C, Abas M, Light M, Watts C. The relationship of trauma to mental disorders among trafficked and sexually exploited girls and women. Am J Public Health. 2010;100:2442-9. 49 Breslau N. Epidemiologic studies of trauma, posttraumatic stress disorder, and other psychiatric disorders. Can J Psychiatry. 2002;47:923-9. 50 Lloyd DA, Turner RJ. Cumulative lifetime adversities and alcohol dependence in adolescence and young adulthood. Drug Alcohol Depend. 2008;93:217-26. 51 Stein DJ, Chiu WT, Hwang I, Kessler RC, Sampson N, Alonso J, et al. Cross-national analysis of the associations between traumatic events and suicidal behavior: findings from the WHO World Mental Health Surveys. PloS One. 2010;5:e10574. 52 Molnar BE, Buka SL, Kessler RC. Child sexual abuse and subsequent psychopathology: results from the National Comorbidity Survey. Am J Public Health. 2001;91:753-60. 53 Maniglio R. Severe mental illness and criminal victimization: a systematic review. Acta Psychiatr Scand. 2009;119:180-91. 54 Hiday VA, Swartz MS, Swanson JW, Borum R, Wagner HR. Criminal victimization of persons with severe mental illness. Psychiatr Serv. 1999;50:62-8. 55 Rehm J, Baliunas D, Borges GL, Graham K, Irving H, Kehoe T, et al. The relation between different dimensions of alcohol consumption and burden of disease: an overview. Addiction. 2010;105:817-43. 56 Taylor B, Irving HM, Kanteres F, Room R, Borges G, Cherpitel C, et al. The more you drink, the harder you fall: a systematic review and meta-analysis of how acute alcohol consumption and injury or collision risk increase together. Drug Alcohol Depend. 2010;110:10816. 57 Hiday VA. Putting community risk in perspective: a look at correlations, causes and controls. Int J Law Psychiatry. 2006;29:316-31.